Abstract
When working with hyperpolarized species, it is often difficult to maintain a stable level of magnetization over consecutive experiments, which renders their detection at the trace level cumbersome, even when combined with chemical exchange saturation transfer (CEST). We report herein the use of ultra-fast Z-spectroscopy as a powerful means to detect low concentrations of 129Xe NMR-based sensors and to measure the in-out xenon exchange. Modifications of the original sequence enable a multiplexed detection of several sensors, as well as the extraction of the exchange buildup rate constant in a single-shot fashion.
Keywords: Magnetic Resonance, Exchange, Hyperpolarization, Biosensors, Sensitivity
Over the last decade, xenon biosensors have been demonstrated to provide sensitive probes of biological events.1-10 In this approach, hyperpolarized 129Xe gas is encapsulated in host molecular systems, which are decorated with ligands that are specific to the targeted receptors. The chemical shift of xenon, which is in continuous exchange between the bulk and the host environments, shows a strong sensitivity to the chemical composition of the host, but also to variations in the local environment and to conformational changes of the hosts that may result from receptor binding events.
Although these shifts can be detected with conventional 129Xe spectroscopy, much lower detection thresholds can be reached with the HyperCEST approach, where the presence of caged xenon is detected indirectly via changes in the large bulk xenon signal.11 This method is a member of the chemical exchange saturation transfer (CEST) family,12 whereby the caged xenon magnetization is saturated by rf irradiation at its characteristic frequency, and exchange with free xenon subsequently depletes the bulk xenon signal.
Whereas this sequence has been shown to be very efficient to detect low concentrations of xenon biosensors, it requires a very stable level of xenon polarization as it is a difference spectroscopy. Furthermore, it is frequently required to detect multiple biosensor frequencies, and single-shot acquisition methods would be preferred to achieve reproducible and mutually compatible results. Recently, Xu et al. proposed an ultra-fast Z-spectroscopy (UFZ) sequence for the one-shot acquisition of Z-spectra for the broadband measurement of CEST effects,13 and it was used recently with modifications by Döpfert et al.14 Previously, this method had been proposed by S. D. Swanson for the broadband measurement of cross-relaxation effects.15 We show here that this approach can be of high value for functionalized xenon, and in general for every hyperpolarized species that exchanges with a bulk pool. We further propose and demonstrate additional modifications to the sequence to take full advantage of the hyperpolarization state and to accommodate the large chemical shift differences in the multiplexed detection of several xenon hosts.
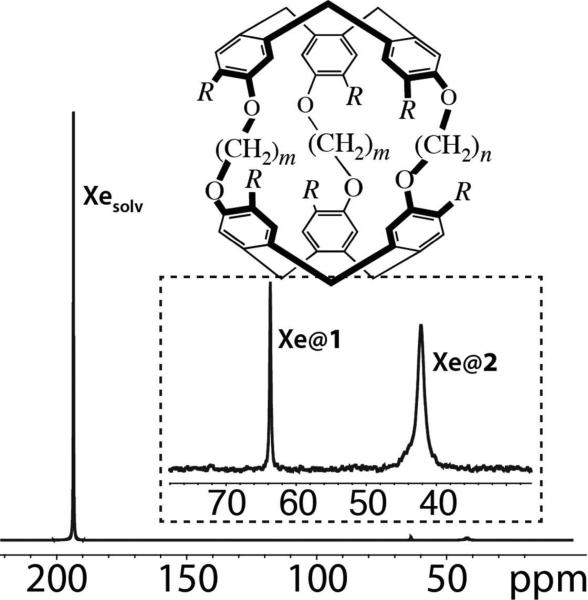
The strength of the UFZ approach has been assessed with a mixture of two water-soluble cryptophanes in H2O: cryptophane-222-hexacarboxylate (compound 1) and cryptophane-233-hexacarboxylate (compound 2), see Figure 1. Their xenon binding constants and in-out exchange rates at room temperature are significantly different (K ~ 6800 M−1, kex ~ 3.2 s−1 for 1, K ~ 2000 M−1, kex ~ 37 s−1 for 2).16 Figure 1 displays the 129Xe NMR spectrum of the noble gas in the presence of 1 and 2 at concentrations of 30 and 90 μM, respectively.
Figure 1.
First molecular system under study: an aqueous mixture of cryptophane 1 (R=OCH2COOH, m=n=2; concentration= 30 μM) and cryptophane 2 (R=OCH2COOH, m=3, n=2; concentration= 90 μM), and 129Xe NMR spectrum obtained in one-scan. A zoomed-in spectrum of the high field region is presented in the insert, together with the peak assignment.
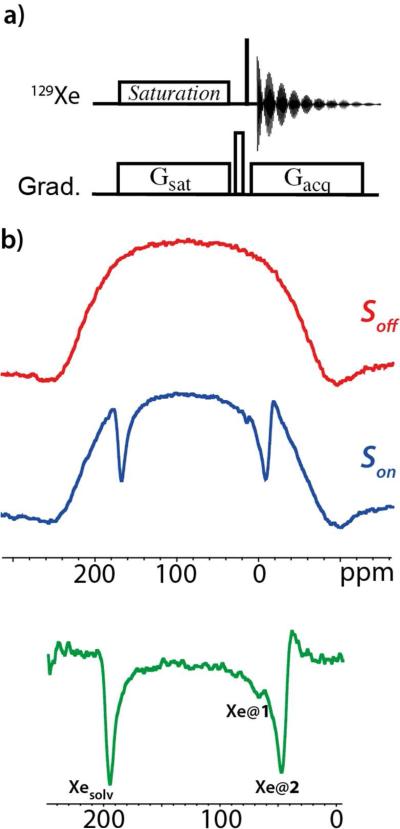
The UFZ method (Figure 2a) uses spatial encoding of the Z-spectrum in a manner similar to other ultrafast NMR spectroscopic approaches.17 A pulsed field gradient Gsat operating during the CW irradiation enables a saturation of the small reservoir signal in a given region of the NMR tube. The profile subsequently obtained via another gradient during the acquisition Gacq enables the recording of the Z-polarization of the large reservoir signal. The frequency-scale can be calibrated to reflect the local rf-irradiation frequencies in a Z-spectrum.
Figure 2.
a) Pulse sequence of UFZ spectroscopy.13 The thin black bar on the 129Xe channel represents the read pulse (in the following a 90° flip angle pulse), Gsat is the gradient applied during saturation, Gacq the gradient applied during acquisition. Both gradients are applied along Z. At the end of the saturation, a gradient crusher is applied along X. b) 129Xe UFZ spectrum performed at 11.7 T. Top: Z-polarization profile obtained without saturation (Soff(z)); middle: Z-polarization profile obtained with a CW saturation of 7.1 μT during 2.4 seconds, in the presence of a 24 G.cm−1 gradient along Z (Son(z)). For both spectra, the acquisition gradient Gacq was also 24 G.cm−1. Bottom: normalized 129Xe UFZ spectrum obtained by computing (Soff(z)-Son(z))/Soff(z).
Figure 2b shows the 129Xe UFZ-spectrum obtained in two scans at 11.7T and 298K with the sequence of Figure 2a. The first scan (in red) was a reference scan acquired without saturation, and the second scan (blue) used a saturation field of 7.1 μT for 2.4 s placed in the middle of the full 129Xe NMR spectrum (at 125 ppm). Two variants for performing the reference scan were tested: (i) For the same xenon bolus a first scan is acquired without saturation via a 45° flip angle read pulse, immediately followed by a second scan with the saturation step and a 90° flip angle read pulse (thus the components of magnetization in the transverse plane are of the same nominal intensity18); (ii) Two xenon boluses are used and adjustment of the global intensity of the Z profiles can be applied after Fourier transformation. Method (ii) gave a slightly better result, likely due to a dependence of the measured profile on the flip angle in (i).
Several advantages with respect to the conventional measurement (point-by-point) of a Z-spectrum can be recognized for transiently polarized species. Averaging can now be performed on a spectrum-by-spectrum basis (adding several UFZ-spectra to increase the signal-to-noise ratio). Therefore, reliable results can be obtained even with significantly fluctuating xenon magnetization between boluses. The robustness of UFZ towards B0 inhomogeneities13 is a further advantage, as discussed below.
Three dips appear in the Z-spectrum in Figure 2b, the first one corresponding to free dissolved xenon, the second and third ones to encapsulated xenon. It is difficult, however, to distinguish between the dips due to Xe@1 and Xe@2. Moreover the dips fall in the rising and descending parts of the z-profile, where the extracted normalized Z-spectrum is noisier. These two problems are linked to the large chemical shift difference between the resonances of free and caged xenon (about 21 kHz), a situation very often encountered with xenon biosensors. Using a much stronger gradient during the saturation step could in principle solve these problems, but this is demanding on the spectrometer hardware.
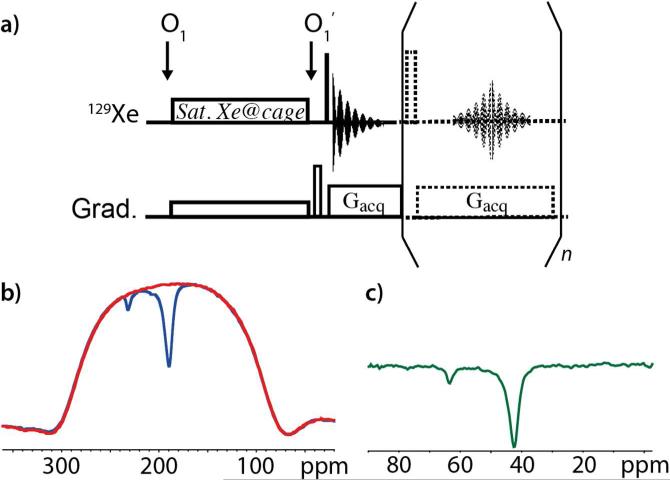
A much better approach, however, that also allows high-resolution discrimination of several 129Xe NMR-based sensors19 can be performed as follows. The original sequence is applied by first placing the saturation offset frequency in the middle of the high field region corresponding to caged xenon (around 50 ppm), while for detection, the offset is placed at the resonance frequency of dissolved xenon (200 ppm).13 This enables the use of a much lower saturation gradient value Gsat, as one needs now to cover a spectral window of only approximately 30 ppm (instead of 200 ppm). Also, since the signal is recorded in the presence of a gradient, the signal lifetime is short. One can therefore read out multiple echoes and co-add the results, as shown in Figure 3a.
Figure 3.
a) Pulse sequence of the modified UFZ spectroscopy. The dashed part is optional, but enables the recording of several successive FIDs thanks to a multiple spin echo (the dashed rectangle is a 180° pulse). The arrows under O1 and O1’ indicate the moment when the offset is shifted. O1 is centered on the spectral region of caged xenon, O1’ is placed at the resonance frequency of dissolved xenon. b) 129Xe UFZ spectrum on the mixture of cryptophanes 1 and 2 in H2O. In red: Z-polarization profile obtained in one scan without saturation (Soff(z)); in blue: Z-polarization profile obtained in one scan with a CW saturation of 2.4 μT during 4 seconds, in the presence of an 8 G.cm−1 gradient (Gsat) along Z (Son(z)). Only the first FID of each sequence has been used. For both spectra, the acquisition gradient Gacq was 16 G.cm−1. c) Normalized 129Xe UFZ spectrum obtained by computing (Soff(z)-Son(z))/Soff(z). An abscissa scaling according to the ratio of the two gradients enables us to obtain the true resonance frequency values of caged xenon.
We have applied this sequence on the mixture of cryptophanes, using a saturation field of 2.4 NT and different saturation times. In Figure 3b the Z-profiles with saturation times of 4 s and without saturation are superimposed, revealing the stability of the sequence. The normalized HyperCEST UFZ spectrum ((Son(z)-Soff(z))/Soff(z)), shown in Figure 3c, enables a clear separation of the signals of xenon caged in 1 and in 2. From this spectrum, and from the experiments performed on other cryptophane mixtures (Fig. S1 of the Supp. Info.), we can deduce that 129Xe signals with a chemical shift splitting of ~4 ppm (550 Hz) can be separated, a value comparable to the results of other groups working with conventional HyperCEST.20-21
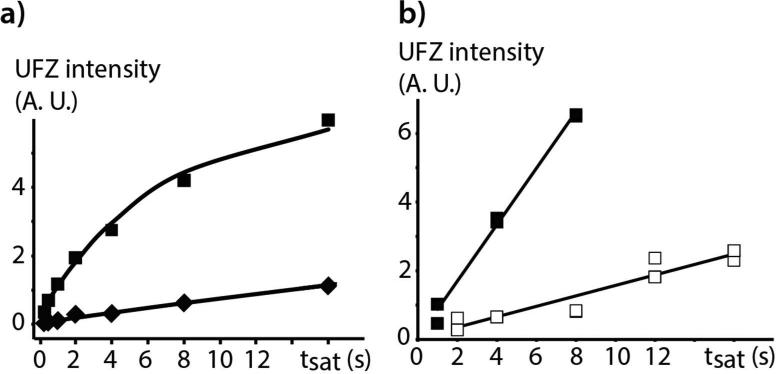
Figure 4a shows the evolution of the UFZ signal as a function of the saturation duration for the mixture of cryptophanes (eight values from 0.25 s to 16 s). Whereas the data points for 1 are aligned, those for 2 deviate from linearity for long saturations. This is easily explained by the fact that there are not enough xenon atoms in solution to enable complete replenishment of the cryptophane environment in hyperpolarization.22 From the best-fit curve to the function f=A*(1-exp(−kextsat)), a factor of ~12 is found between the in-out xenon exchange rates with the two cryptophanes, in agreement with what was previously estimated.17 Note that all the eight experiments (including the spectrum without saturation) have been recorded with the same reservoir of gaseous xenon above the solution.
Figure 4.
Evolution of the UFZ intensity as a function of the saturation duration for a) the mixture of cryptophane 1 and cryptophane 2, at 30 μM and 90 μM in H2O respectively. The diamonds show the data points for 1, and the squares the data points for 2; b) cryptophane 2 alone at 0.5 μM in H2O. In a) the saturation field value was 2.4 μT, in b) the saturation field was either 2.4 μT (white squares) or 4.8 μT (black squares). In each series and for each saturation duration value, two acquisitions have been performed (and the summed areas of the FID and the first echo for each data point were used).
As mentioned in Ref. 13, this sequence is robust against magnetic field inhomogeneity. This feature represents a big advantage over conventional Z-spectroscopy, in particular for the study of samples with large magnetic susceptibility variations, or for injected samples, where inhomogeneities may arise from transient bubbles. This property is verified in Figure S2 of the Supp. Info., which displays the UFZ spectra in the presence of various field homogeneity levels.
The UFZ approach is evaluated in terms of sensitivity in Figure 4b, which shows the UFZ-derived signal as a function of the saturation duration for cryptophane 2 at 0.5 μM (all data points were obtained with a unique xenon reservoir above the solution – so it is a single bolus experiment). Two B1 saturation fields were tested: 2.4 μT (white squares) and 4.8 μT (black squares). For the former the data points are more scattered and should render less precise the determination of the exchange rate. However, multiplying by two the B1 strength produces more sensitive results (although these data points have been acquired at the end of the run, thus with a lower polarization). Here the data points are well fitted with a straight line, as there were enough xenon atoms per cryptophane cage.
For these experiments, the FID and the first echo (n=1) were processed and summed. This provides a further gain in sensitivity: for instance the difference UFZ spectrum after saturation for 8 s with a B1 saturation field of 2.4 μT has a signal-to-noise ratio of 7.1 when using only the first FID, and a signal-to-noise ratio of 9.4 when the first echo is also used.
Owing to the large magnetization afforded by the optical pumping step and the presence of the read gradient that enables fast acquisition, it is possible to obtain the UFZ spectra for various saturation delays within a single shot, by extracting a full UFZ spectrum after small flip angle pulses interleaved with saturation. Figure 5a displays this sequence, which thus allows one to perform a one-shot quantification of exchange as a function of saturation time (QUEST).24 Therefore, we suggest to call this method UFZ QUEST. This sequence has been applied on cryptophane 2 at 20 μM. It can be observed that the evolution of the dip for a constant z profile intensity enables the extraction of the exchange rate in a single shot (Figure 5b).
Figure 5.
Single shot UFZ QUEST. a) Pulse sequence: the read pulse has a small flip angle α, the saturation gradient is along the X axis and has an amplitude variable between two acquisitions; b) Build-up of the 129Xe UFZ intensity as a function of tsat. Twelve saturation delays were acquired (from 0.5 s to 6 s, increment of 0.5 s) in one scan on a sample of cryptophane 2 at 20 μM in H2O. α value: 5°; time interval between each saturation: 6.4 ms; Gsat = 8 G.cm−1; Gacq= 12 G.cm−1. Four Z-profiles are displayed in front of the corresponding saturation delays.
Xenon in several cryptophanes can be simultaneously detected with UFZ, provided that the resonance frequencies differ by more than ca. 500 Hz. Increasing the read gradient splits the apparent frequency difference, but also broadens the dips. Moreover, a too large acquisition gradient (Gacq) would affect the free xenon resonance. A balance should be sought between increasing the saturation gradient (Gsat) and reducing the saturation power. Also as expected a low saturation field strength renders the experiment less sensitive. The use of a composite saturation step made up of multiple pulse inversion elements,25 may make the technique more spectrally-selective, and thus allow one to reduce power further.
The sensitivity limit of the one-shot method is of course higher than for conventional Hyper-CEST, and increases in proportion with the gradient bandwidth used. Stevens et al.26 used constructs that were optimized for sensitivity and a record detection limit of 0.23 pM biosensor was achieved (equivalent to a concentration of 0.23 nM in cryptophane). In such a system if one considers a x Hz inhomogeneous broadening, the one-shot UFZ detection limit would be increased by y/x for a y Hz bandwidth created by the read gradient. In our case, keeping an apparent separation of 4 ppm between the signals of Xe@1 and Xe@2 would mean decreasing the read gradient by a factor 6, and therefore it should be possible to detect 1 nM of each cryptophane in one shot. Also we could have used a higher temperature, which speeds up the exchange and further lowers the detection limit.
The 129Xe UFZ spectroscopy method enables us to derive an exchange rate constant in a very short time; this constitutes the specificity and the usefulness of 129Xe UFZ-spectroscopy with no equivalent in the ‘conventional’ HyperCEST approaches.
The xenon binding constant is by a factor 3.4 lower in 2 as compared to 1 but the excess of Xe makes the exchange rates the determining parameter for sensitivity (97% of the 1 cages and 91% of the 2 cages are filled by a xenon atom). Therefore the measurement of 1 appears more sensitive under these conditions.
In this Communication, we have shown that the recently published UFZ-spectroscopy method can be of high value for transiently polarized samples, as it enables one to avoid complications from fluctuations in the magnetization, and to detect low amounts of xenon in exchange. Such an approach could be valuable for many other studies using hyperpolarized species in exchange, for example in dissolution DNP experiments,27 but perhaps also in the SABRE method.28 Further speedup of such methodology could be achieved by combining UFZ with the parallel measurement of several samples.29
Supplementary Material
ACKNOWLEDGMENT
Support from the French Ministry of Research (project ANR-13-BLAN-0182–03) is acknowledged. A.J. acknowledges funding from an NIH award no. 1R01EB016045-01A.
Footnotes
Supporting Information. Experimental procedures; Test for the spectral separation of the 129Xe signals in UFZ-spectroscopy; Effect of the static magnetic field inhomogeneity on the 129Xe UFZ spectrum. This material is available free of charge via the Internet at http://pubs.acs.org.
The authors declare no competing financial interests.
REFERENCES
- 1.Berthault P, Huber G, Desvaux H. Biosensing Using Laser-Polarized Xenon NMR/MRI. Prog. Nucl. Magn. Reson. Spectrosc. 2009;55:35–60. [Google Scholar]
- 2.Wei Q, Seward GK, Hill PA, Patton B, Dimitrov IE, Kuzma NN, Dmochowski IJ. Designing 129Xe NMR Biosensors for Matrix Metalloproteinase Detection. J. Am. Chem. Soc. 2006;128:13274–13283. doi: 10.1021/ja0640501. [DOI] [PubMed] [Google Scholar]
- 3.Roy V, Brotin T, Dutasta J-P, Charles M-H, Delaire T, Mallet F, Huber G, Desvaux H, Boulard Y, Berthault P. A Cryptophane Biosensor for Detection of Specific Nucleotide Targets through Xenon-NMR. ChemPhysChem. 2007;8:2082–2085. doi: 10.1002/cphc.200700384. [DOI] [PubMed] [Google Scholar]
- 4.Aaron JA, Chambers JM, Jude KM, Di Costanzo L, Dmochowski IJ. Structure of a 129Xe-Cryptophane Biosensor Complexed with Human Carbonic Anhydrase II. J. Am. Chem. Soc. 2008;130:6942–6943. doi: 10.1021/ja802214x. [DOI] [PMC free article] [PubMed] [Google Scholar]
- 5.Lerouge F, Melnyk O, Durand J-O, Raehm L, Berthault P, Huber G, Desvaux H, Constantinesco A, Choquet P, Detour J, Smaïhi M. Towards Thrombosis-Targeted Zeolite Nanoparticles for Laser-Polarized 129Xe MRI. J. Mater. Chem. 2009;19:379–386. [Google Scholar]
- 6.Chambers JM, Hill PA, Aaron JA, Han Z, Christianson DW, Kuzma NN, Dmochowski IJ. Cryptophane Xenon-129 Nuclear Magnetic Resonance Biosensors Targeting Human Carbonic Anhydrase. J. Am. Chem. Soc. 2009;131:563–569. doi: 10.1021/ja806092w. [DOI] [PMC free article] [PubMed] [Google Scholar]
- 7.Schlundt A, Killian W, Beyermann M, Sticht J, Günther S, Höpner S, Falk K, Roetzschke O, Mitschang L, Freund C. A Xenon-129 Biosensor for Monitoring MHC–Peptide Interactions. Angew. Chem. Int. Ed. 2009;48:4142–4145. doi: 10.1002/anie.200806149. [DOI] [PubMed] [Google Scholar]
- 8.Boutin C, Stopin A, Lenda F, Brotin T, Dutasta J-P, Jamin N, Sanson A, Boulard Y, Leteurtre F, Huber G, Bogaert-Buchmann A, Tassali N, Desvaux H, Carrière M, Berthault P. Cell Uptake of a Biosensor Detected by Hyperpolarized 129Xe NMR: the Transferrin Case. Bioorg. Med. Chem. 2011;19:4135–4143. doi: 10.1016/j.bmc.2011.05.002. [DOI] [PubMed] [Google Scholar]
- 9.Kotera N, Tassali N, Léonce E, Boutin C, Berthault P, Brotin T, Dutasta J-P, Delacour L, Traoré T, Buisson D-A, Taran F, Coudert S, Rousseau B. A Sensitive Zinc-Activated 129Xe MRI Probe. Angew. Chem. Int. Ed. 2012;51:4100–4103. doi: 10.1002/anie.201109194. [DOI] [PubMed] [Google Scholar]
- 10.Palaniappan KK, Ramirez RM, Bajaj VS, Wemmer DE, Pines A, Francis MB. Molecular Imaging of Cancer Cells Using a Bacteriophage-Based 129Xe NMR Biosensor. Angew. Chem. Int. Ed. 2013;52:4849–4853. doi: 10.1002/anie.201300170. [DOI] [PubMed] [Google Scholar]
- 11.Schröder L, Lowery TJ, Hilty C, Wemmer DE, Pines A. Molecular Imaging Using a Targeted Magnetic Resonance Hyperpolarized Biosensor. Science. 2006;314:446–449. doi: 10.1126/science.1131847. [DOI] [PubMed] [Google Scholar]
- 12.Vinogradov E, Sherry AD, Lenkinski RE. CEST: From Basic Principles to Applications, Challenges and Opportunities. J. Magn. Reson. 2013;229:155–172. doi: 10.1016/j.jmr.2012.11.024. [DOI] [PMC free article] [PubMed] [Google Scholar]
- 13.Xu X, Lee J-S, Jerschow A. Ultrafast Scanning of Exchangeable Sites by NMR Spectroscopy. Angew. Chem. Int. Ed. 2013;52:8281–8284. doi: 10.1002/anie.201303255. [DOI] [PMC free article] [PubMed] [Google Scholar]
- 14.Döpfert J, Witte C, Schröder L. Slice-Selective Gradient-Encoded CEST Spectroscopy for Monitoring Dynamic Parameters and High-Throughput Sample Characterization. J. Magn. Reson. 2013;237:34–39. doi: 10.1016/j.jmr.2013.09.007. [DOI] [PubMed] [Google Scholar]
- 15.Swanson SD. Broadband Excitation of Cross-Relaxation NMR Spectra. J. Magn. Reson. 1991;95:615–618. [Google Scholar]
- 16.Huber G, Brotin T, Dubois L, Desvaux H, Dutasta J-P, Berthault P. Water Soluble Cryptophanes Showing Unprecedented Affinity for Xenon: Candidates as NMR-Based Biosensors. J. Am. Chem. Soc. 2006;128:6239–6246. doi: 10.1021/ja060266r. [DOI] [PubMed] [Google Scholar]
- 17.Tal A, Frydman L. Single-Scan Multidimensional Magnetic Resonance. Prog. Nucl. Magn. Reson. Spectrosc. 2010;57:241–292. doi: 10.1016/j.pnmrs.2010.04.001. [DOI] [PubMed] [Google Scholar]
- 18.Zhao L, Mulkern R, Tseng CH, Williamson D, Patz S, Kraft R, Walsworth RL, Jolesz FA, Albert MS. Gradient-Echo Imaging Considerations for Hyperpolarized 129Xe MR. J. Magn. Reson. B. 1996;113:179–183. [PubMed] [Google Scholar]
- 19.Berthault P, Bogaert-Buchmann A, Desvaux H, Huber G, Boulard Y. Sensitivity and Multiplexing Capabilities of MRI Based on Polarized 129Xe Biosensors. J. Am. Chem. Soc. 2008;130:16456–16457. doi: 10.1021/ja805274u. [DOI] [PubMed] [Google Scholar]
- 20.Schilling F, Schröder L, Palaniappan KK, Zapf S, Wemmer DE, Pines A. MRI Thermometry Based on Encapsulated Hyperpolarized Xenon. ChemPhysChem. 2010;11:3529–3533. doi: 10.1002/cphc.201000507. [DOI] [PubMed] [Google Scholar]
- 21.Sloniec J, Schnurr M, Witte C, Resch-Genger U, Schröder L, Hennig A. Biomembrane Interactions of Functionalized Cryptophane-A: Combined Fluorescence and 129Xe NMR Studies of a Bimodal Contrast Agent. Chem. Eur. J. 2013;19:3110–3118. doi: 10.1002/chem.201203773. [DOI] [PubMed] [Google Scholar]
- 22.Considering an in-out xenon exchange rate of 37 s−1 for cryptophane 2 means that in 8 seconds, 300 polarized xenon atoms are required per cryptophane. Given that the cryptophane concentration is 90 μM, it would require (in the ideal case) 27 mM of dissolved xenon, which is well above the concentration we have actually. The real situation is that the saturation is not complete, as calculated in ref. 23; a xenon atom that has entered in the cryptophane cavity has not lost totally its hyperpolarization.
- 23.Kilian W, Mitschang L, Freund C, Schlundt A. ISMRM 2010 Proceedings. Stockholm; Sweden: Pressure Dependent Signal Enhancement in Hyper-CEST. [Google Scholar]
- 24.McMahon MT, Gilad AA, Zhou J, Sun PZ, Bulte JWM, van Zijl PCM. Quantifying Exchange Rates in Chemical Exchange Saturation Transfer Agents using the Saturation Time and Saturation Power Dependencies of the Magnetization Transfer Effect on the Magnetic Resonance Imaging Signal (QUEST and QUESP): Ph Calibration for Poly-L-lysine and a Starburst Dendrimer. Magn. Reson. Med. 2006;55:836–847. doi: 10.1002/mrm.20818. [DOI] [PMC free article] [PubMed] [Google Scholar]
- 25.Meldrum T, Bajaj V, Wemmer D, Pines A. Band-selective Chemical Exchange Saturation Transfer Imaging with Hyperpolarized Xenon-based Molecular Sensors. J. Magn. Reson. 2011;213:14–21. doi: 10.1016/j.jmr.2011.06.027. [DOI] [PubMed] [Google Scholar]
- 26.Stevens TK, Palaniappan KK, Ramirez RM, Francis MB, Wemmer DE, Pines A. HyperCEST Detection of a 129Xe-based Contrast Agent Composed of Cryptophane-A Molecular Cages on a Bacteriophage Scaffold. Magn. Reson. Med. 2013;69:1245–1252. doi: 10.1002/mrm.24371. [DOI] [PubMed] [Google Scholar]
- 27.Kettunen MI, De-en Hu D, Witney TH, McLaughlin R, Gallagher FA, Bohndiek SE, Day SE, Brindle KM. Magnetization Transfer Measurements of Exchange between Hyperpolarized [1-13C]Pyruvate and [1-13C]Lactate in a Murine Lymphoma. Magn. Reson. Med. 2010;63:872–880. doi: 10.1002/mrm.22276. [DOI] [PubMed] [Google Scholar]
- 28.Adams RW, Aguilar JA, Atkinson KD, Cowley MJ, Elliott PIP, Duckett SB, Green GGR, Khazal IG, López Serrano J, Williamson DC. Reversible Interactions with para-Hydrogen Enhance NMR Sensitivity by Polarization Transfer. Science. 2009;323:1708–1711. doi: 10.1126/science.1168877. [DOI] [PubMed] [Google Scholar]
- 29.Liu G, Gilad AA, Bulte JWM, van Zijl PCM, McMahon MT. High-Throughput Screening of Chemical Exchange Saturation Transfer MR Contrast Agents. Contrast Med. Molec. Imag. 2010;5:162, 170. doi: 10.1002/cmmi.383. [DOI] [PMC free article] [PubMed] [Google Scholar]
Associated Data
This section collects any data citations, data availability statements, or supplementary materials included in this article.


