

Abstract
Associations between low birth weight (≤2,500 g) and increased risk of mortality and morbidity provided the foundation for the “developmental origins of health and disease” hypothesis. Previous between-family studies could not control for unmeasured confounders. Therefore, we compared differentially exposed siblings to estimate the extent to which the associations were due to uncontrolled factors. Our population cohort included 3,291,773 persons born in Sweden from 1973 to 2008. Analyses controlled for gestational age, among other covariates, and considered birth weight as both an ordinal and a continuous variable. Outcomes included mortality after 1 year, cardiac-related death, hypertension, ischemic heart disease, pulmonary circulation problems, stroke, and type 2 diabetes mellitus. We fitted fixed-effects models to compare siblings and conducted sensitivity analyses to test alternative explanations. Across the population, the lower the birth weight, the greater the risk of mortality (e.g., cardiac-related death (low birth weight hazard ratio = 2.69, 95% confidence interval: 2.05, 3.53)) and morbidity (e.g., type 2 diabetes mellitus (low birth weight hazard ratio = 1.79, 95% confidence interval: 1.50, 2.14)) outcomes in comparison with normal birth weight. All associations were independent of shared familial confounders and measured covariates. Results emphasize the importance of birth weight as a risk factor for subsequent mortality and morbidity.
Keywords: birth weight, cardiovascular diseases, diabetes mellitus, fetal development, stroke
Based on the seminal work by Barker (1), the “developmental origins of health and disease” hypothesis postulates that low birth weight (LBW; ≤2,500 g), a proxy for fetal growth, causally impacts several of the most costly and burdensome (2, 3) noncommunicable diseases. LBW is associated with offspring mortality (4) and physical morbidity, including increased risk of cardiovascular disease (5–10), hypertension (11–17), type 2 diabetes mellitus (18), and stroke (16, 19). The associations are present across populations, and research has identified plausible biological mechanisms that mediate the associations (1, 20–22).
The commonly held assumption that LBW causally influences the risk of adverse adult health outcomes needs to be rigorously tested, however, since alternative explanations exist. The field continues to struggle with inferring causation from correlation (23), and conflicting results across noncommunicable disease outcomes have been reported (11, 24–28). The previously identified associations may be due to unmeasured selection factors, such as environmental confounding and/or shared genetic liability, that influence both the likelihood of experiencing LBW and the disease outcomes (23, 29–31). For example, LBW is associated with environmental risk factors that are themselves predictive of subsequent adverse outcomes (16). Family, twin, and genome-wide linkage analyses have indicated that genetic factors influence birth weight and fetal growth (30, 32–36), as well as the studied outcomes (37). As such, researchers need to rule out plausible environmental and genetic confounders that may be responsible for the associations between LBW and mortality and morbidity. Therefore, making accurate estimates of associations and testing alternative hypotheses is essential (2, 38).
Medical reviews have specifically called for quasi-experimental studies (39), approaches that utilize design features to test alternative explanations by increasing control over unmeasured confounding factors (40). Co-twin control designs, for instance, compare associations between risks and outcomes among monozygotic and dizygotic twins. The systematic genetic and environmental similarities between twins help investigators draw conclusions about the mechanisms responsible for the associations found (14, 27, 41). One co-twin control study suggested that associations between birth weight and cardiovascular disease and stroke may be a result of genetic confounding (27).
Although comparing discordant twins improves internal validity, there are concerns about the external validity of the findings. Birth weight differences in twins may be etiologically distinct from differences in singletons, and twins have a greater risk of growth restriction in utero than singletons (42). Sibling-comparison designs, however, test alternative explanations in a population that is more generalizable to the public than twin populations (31) because they account for all genetic and environmental factors that make siblings similar (40, 43). Few studies, though, have been performed using a sibling-comparison approach (15–17), and such studies have major limitations. One study predicted blood pressure in a relatively small sample of children (15), while another studied associations in males only (17). A third study had excellent follow-up but used a relatively small sample and predicted a combination cardiovascular outcome that was measured via self-report (16). In addition, all previous sibling-comparison studies have been limited by their sole use of a categorical representation of birth weight or fetal growth. Thus, the field would benefit from research using large data sets and powerful analyses to assess the robustness of associations.
In the current investigation, we sought to rigorously examine the associations between birth weight and mortality and physical morbidity related to cardiovascular disease, stroke, and type 2 diabetes mellitus using one of the most comprehensive population-based cohorts assembled to date, a Swedish population cohort of over 3.6 million births. We aimed to provide more accurate estimates of the specific associations by using the sibling-comparison design. We also controlled for measured covariates that varied within families and used both ordinally and continuously measured birth weight.
METHODS
Sample
After approval from the institutional review boards at Karolinska Institutet (Stockholm, Sweden) and Indiana University (Bloomington, Indiana), we created a national cohort for prospective analyses by linking information from the following Swedish registries: 1) the Medical Birth Register, which includes data on more than 99% of all pregnancies in Sweden; 2) the Multi-Generation Register, which contains information about biological relationships for all persons living in Sweden; 3) the Migration Register, which contains information on dates of migration into or out of Sweden; 4) the Cause of Death Register, which supplies dates and causes of all deaths; 5) the National Patient Register, which provides diagnoses and dates of all hospital care; 6) the National Crime Register, which includes information about all criminal convictions; and 7) the Education Register, which contains information on the highest level of formal education completed. Detailed information about these registers is provided in the Web Appendix (available at http://aje.oxfordjournals.org/).
The data set began with 3,619,712 offspring born between 1973 and 2008. We removed offspring from multiple births (n = 86,273) and offspring with missing birth weight information (n = 9,888), as well as those with recorded gestational age values of less than 23 weeks or greater than 42 weeks and 6 days (n = 49,374). Offspring with no sex information (n = 3) and those who had emigrated within the 25-year period (n = 182,223) were removed. We excluded offspring who had missing maternal identification numbers (n = 158) or invalid parity information (n = 20). The final sample consisted of 3,291,773 offspring born to 1,735,250 distinct biological mothers, representing 90.9% of all recorded Swedish births within the year range investigated. For mortality after 1 year, a 1-year age criterion was utilized. Therefore, that subsample included 3,189,312 offspring born between 1973 and 2007. For cardiac-related death, hypertension, ischemic heart disease, pulmonary circulation problems, stroke, and diabetes, a 12-year minimum age criterion for diagnosis was used. Therefore, those subsamples included 2,133,504 offspring born between 1973 and 1995.
Measures
Birth weight
Analyses utilized 2 different representations of birth weight. For the ordinal representation, birth weight was grouped into the following categories: ≤2,500 g, 2,501–3,000 g, 3,001–3,500 g, 3,501–4,000 g (referent), and ≥4,001 g. Continuously measured birth weight was converted to a linear scale centered at 3,750 g (reference 0 point), the approximate mean of the sample.
Offspring outcomes
Two mortality outcomes were predicted. Mortality after 1 year was a right-censored variable that included any death occurring after age 1 year. Cardiac-related death was indicated by the primary cause of death being any cardiac-related disease, as identified through International Classification of Diseases (Eighth, Ninth, and Tenth revisions) codes in the Cause of Death Registry; offspring had to have been at least 12 years old.
We also predicted risk of 5 physical diseases, as determined from the National Patient Register, including the first occurrence of the following (where the diagnoses were primary): 1) hypertension; 2) ischemic heart disease; 3) pulmonary circulation problems; 4) stroke; and 5) type 2 diabetes mellitus. International Classification of Diseases codes and further explanation are presented in Web Table 1. Offspring had to be at least 12 years old at the time of diagnosis.
Covariates
The Medical Birth Register provided information on offspring sex and birth order. Measured maternal and paternal covariates included age at the offspring's birth, highest level of education completed by 2008, and lifetime history of any criminal conviction, which were included to capture some socioeconomic variability in the sample. These covariates were included because they were associated with both birth weight and the outcomes studied.
Analyses
We used Cox survival analysis because of the right-censored outcomes. If offspring did not receive a diagnosis within the study period, they contributed person-time at risk until death, emigration, or the end of follow-up (December 31, 2009), whichever came first.
We fitted a series of 4 models for each outcome. All models controlled for offspring sex, birth order, and linear and quadratic gestational age. First, we used the ordinal representation of birth weight to derive clinically interpretable estimates of risk across outcomes (model 1). Second, we used a continuous representation of birth weight in a baseline model (model 2). This model included both a linear representation of birth weight and a quadratic representation. Model fit, established by means of the Akaike Information Criterion, was used to determine whether linear or quadratic modeling best fitted the data for use in adjusted and fixed-effects models. Third, we incorporated measured covariates, including offspring-specific covariates (i.e., sex, birth order, and maternal and paternal age at childbearing) and parent-specific covariates (i.e., highest maternal and paternal levels of education and history of criminal conviction) (model 3). Fourth, we fitted a fixed-effects model that clustered at the maternal level (44), which accounted for factors that siblings share, including all genetic and environmental factors that make siblings similar (43) (model 4). Siblings were identified as persons sharing a biological mother (i.e., full siblings or maternal half-siblings). We controlled for covariates that may vary between siblings (i.e., offspring sex and birth order) in the fixed-effects model.
Sensitivity analyses
We performed sensitivity analyses to examine the role of gestational age and to test assumptions of the sibling-comparison design.
RESULTS
Table 1 presents demographic characteristics by birth weight category. Table 2 presents the numbers of offspring with various physical morbidity outcomes and Kaplan-Meier product-limit survival estimates for all outcomes.
Table 1.
Demographic Characteristics of 3,291,773 Offspring Born in Sweden During 1973–2008, by Birth Weight
| Characteristic | Birth Year | Birth Weight Category, g |
||||||||||||||
|---|---|---|---|---|---|---|---|---|---|---|---|---|---|---|---|---|
| ≤2,500 (n = 114,580) |
2,501–3,000 (n = 366,500) |
3,001–3,500 (n = 1,075,447) |
3,501–4,000 (n = 1,152,337) |
≥4,001 (n = 583,909) |
||||||||||||
| No. | %a | Mean (SD) | No. | % | Mean (SD) | No. | % | Mean (SD) | No. | % | Mean (SD) | No. | % | Mean (SD) | ||
| Offspring (n = 3,291,773) | 1973–2008 | |||||||||||||||
| Female sex | 58,657 | 51.19 | 207,481 | 56.61 | 573,332 | 53.31 | 533,202 | 46.27 | 220,119 | 37.76 | ||||||
| Gestational age, days | 245.46 (25.53) | 271.19 (12.10) | 278.14 (9.41) | 282.14 (8.27) | 285.24 (7.77) | |||||||||||
| Mothers (n = 1,732,107) | 1924–1995 | |||||||||||||||
| Age at offspring's birth, years | 28.85 (5.67) | 28.43 (5.36) | 28.59 (5.19) | 28.96 (5.10) | 29.55 (5.06) | |||||||||||
| Swedish nationality | 54,045 | 83.77 | 169,706 | 83.00 | 491,255 | 84.77 | 518,302 | 87.12 | 254,761 | 88.68 | ||||||
| Upper secondary education (3 years) | 31,870 | 49.35 | 105,639 | 51.62 | 323,120 | 55.71 | 347,214 | 58.32 | 170,492 | 59.31 | ||||||
| Adult severe psychopathology | 1,748 | 2.71 | 4,493 | 2.20 | 10,606 | 1.83 | 9,629 | 1.62 | 4,377 | 1.52 | ||||||
| Criminality | 8,939 | 13.84 | 26,443 | 12.92 | 65,981 | 11.38 | 61,356 | 10.31 | 28,207 | 9.81 | ||||||
| Fathers (n = 1,725,359) | 1904–1993 | |||||||||||||||
| Age at offspring's birth, years | 31.75 (6.55) | 31.38 (6.28) | 31.49 (6.07) | 31.78 (5.96) | 32.28 (5.91) | |||||||||||
| Swedish nationality | 52,049 | 83.61 | 165,781 | 82.69 | 485,000 | 84.50 | 518,434 | 87.04 | 259,048 | 89.02 | ||||||
| Upper secondary education (3 years) | 27,192 | 43.63 | 90,199 | 44.92 | 274,812 | 47.82 | 294,778 | 49.44 | 145,192 | 49.84 | ||||||
| Adult severe psychopathology | 1,345 | 2.16 | 4,033 | 2.01 | 10,059 | 1.75 | 9,399 | 1.58 | 4,172 | 1.43 | ||||||
| Criminality | 25,953 | 41.64 | 81,223 | 40.45 | 219,628 | 38.22 | 216,353 | 36.28 | 101,834 | 34.96 | ||||||
Abbreviation: SD, standard deviation.
a Percentage of individuals, by birth weight group. For offspring, the total numbers of individuals are listed in the column headings; for maternal and paternal variables, the total numbers of mothers and fathers are given in the first column, and percentages are based on the number of nonmissing cases for each variable.
Table 2.
Mortality and Physical Morbidity Outcomes of Offspring Born in Sweden During 1973–2007, by Birth Weight
| Outcome | Total No. of Offspring | Birth Year | Birth Weight Category, g |
|||||||||
|---|---|---|---|---|---|---|---|---|---|---|---|---|
| ≤2,500 (n = 114,580) |
2,501–3,000 (n = 366,500) |
3,001–3,500 (n = 1,075,447) |
3,501–4,000 (n = 1,152,337) |
≥4,001 (n = 583,909) |
||||||||
| No. | KMEa,b | No. | KME | No. | KME | No. | KME | No. | KME | |||
| Mortality | ||||||||||||
| Died after first year | 3,189,312 | 1973–2007 | 832 | 0.01 | 1,630 | 0.01 | 3,712 | 0.01 | 3,704 | 0.01 | 1,892 | 0.01 |
| Cardiac-related death | 2,133,504 | 1973–1995 | 499 | 0.44 | 462 | 0.13 | 850 | 0.08 | 760 | 0.07 | 383 | 0.07 |
| Physical morbidity | ||||||||||||
| Hypertension | 1,182,992 | 1973–1995 | 438 | 0.38 | 1,015 | 0.28 | 2,350 | 0.22 | 1,992 | 0.17 | 965 | 0.17 |
| Ischemic heart disease | 1,423,777 | 1973–1995 | 63 | 0.05 | 153 | 0.04 | 264 | 0.02 | 286 | 0.02 | 132 | 0.02 |
| Pulmonary circulation problems | 200,103 | 1973–1995 | 331 | 0.29 | 457 | 0.12 | 881 | 0.08 | 802 | 0.07 | 364 | 0.06 |
| Stroke | 1,018,885 | 1973–1995 | 322 | 0.28 | 620 | 0.17 | 1,359 | 0.13 | 1,319 | 0.11 | 705 | 0.12 |
| Type 2 diabetes mellitus | 770,096 | 1973–1995 | 780 | 0.68 | 2,532 | 0.69 | 6,811 | 0.63 | 7,275 | 0.63 | 3,734 | 0.64 |
Abbreviation: KME, Kaplan-Meier estimate.
a Kaplan-Meier product-limit survival estimate at ages 25 (died after first year only) and 35 years.
b Kaplan-Meier estimates present the probability of the occurrence of an event at any point in time. They are calculated as the number of participants who have survived or the number who have not received a diagnosis divided by the number of participants still at risk (i.e., not censored). The total probability of surviving to the indicated age is then calculated by multiplying all probabilities of survival in all preceding time intervals. The survival probabilities are then multiplied by 100 to obtain a percentage.
Mortality
Model 1 utilized ordinal birth weight across the entire cohort population. Figure 1 presents baseline risk estimates (dark gray columns) with 95% Wald confidence intervals (I-shaped bars) around the hazard ratio. Point estimates for the reference category, 3,501–4,000 g, were equal to 1. There was a strong inverse association between birth weight and mortality after 1 year (LBW hazard ratio (HR) = 2.15, 95% confidence interval (CI): 1.97, 2.34), as well as cardiac-related death (LBW HR = 2.69, 95% CI: 2.05, 3.53).
Figure 1.
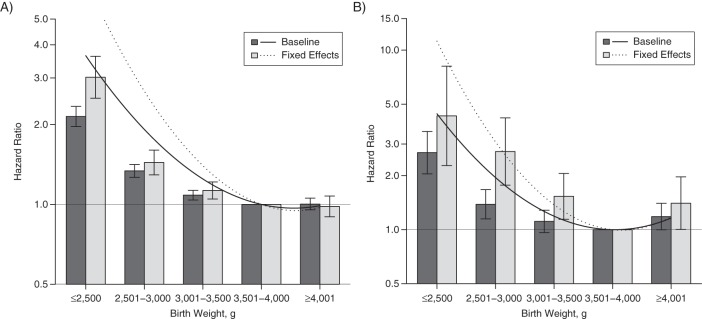
Associations derived from continuous (lines) and ordinal (columns) representations of birth weight when predicting mortality outcomes among offspring born in Sweden during 1973–2007 (death after first year; part A) and 1973–1995 (cardiac-related death; part B). Baseline, population-wide estimates are shown via the solid lines and dark gray columns. Results from sibling-comparison, fixed-effects models are shown via the dotted lines and light gray columns. I-shaped bars, 95% confidence intervals.
Model 2 used a continuous representation of birth weight. Associations with the mortality outcomes were better explained by a quadratic model of birth weight (Web Table 2). Figure 1 also presents continuously represented birth weight risk in the baseline quadratic model, model 2 (solid black line). Within the figures, note that a similar interpretation can be drawn from the ordinal columns as from the continuous parameter estimates of model 2.
The associations remained robust when adjusting for offspring- and parent-specific covariates across mortality outcomes in model 3. Thus, across outcomes, the associations were independent of offspring sex, birth order, year of birth, maternal and paternal age at childbearing, highest level of education, and history of criminal conviction. Model 3 results are not presented graphically for ease of interpretation.
Finally, model 4 was a fixed-effects sibling-comparison model, presented in Figure 1 via the dotted line (continuous) and the light gray columns (ordinal). Consistent with a causal inference, birth weight significantly predicted mortality after 1 year (LBW HR = 3.02, 95% CI: 2.52, 3.62) and cardiac-related death (LBW HR = 4.30, 95% CI: 2.27, 8.14) within differentially exposed siblings while controlling for offspring-specific covariates. Interestingly, across mortality outcomes, the magnitudes of association were larger in model 4 (fixed effects) than in population estimates for both the ordinal and continuous models. We also identified a similar (though larger in magnitude) pattern of increased risk across models when predicting infant mortality (results available upon request). Parameter estimates for baseline, adjusted, and fixed-effects models for continuously represented birth weight are shown in Web Table 3. Web Table 4 presents parameter estimates for ordinal models 1 and 4 as verification of model specification.
Physical morbidity
Figure 2 presents baseline and fixed-effects results for ordinal and continuously measured birth weight across physical morbidity outcomes in the study population. There was a strong inverse association between birth weight and hypertension (LBW HR = 1.58, 95% CI: 1.37, 1.82) that persisted after adjustment for covariates and whose magnitude was robust in fixed-effects analyses (LBW HR = 1.31, 95% CI: 0.92, 1.86). Similarly, there was an inverse association for ischemic heart disease (LBW HR = 2.52, 95% CI: 1.70, 3.73) that was robust across models and remained present in fixed-effects analyses (LBW HR = 2.18, 95% CI: 0.72, 6.13). Pulmonary circulation problems showed an analogous pattern across models (model 2: LBW HR = 1.43, 95% CI: 1.12, 1.83; model 4: LBW HR = 1.41, 95% CI: 0.79, 2.52).
Figure 2.

Associations derived from continuous (lines) and ordinal (columns) representations of birth weight when predicting hypertension (A), ischemic heart disease (B), pulmonary circulation problems (C), stroke (D), and type 2 diabetes mellitus (E) among offspring born in Sweden during 1973–1995. Baseline, population-wide estimates are shown via the solid lines and dark gray columns. Sibling-comparison, fixed-effects models are shown via the dotted lines and light gray columns. I-shaped bars, 95% confidence intervals.
We found an inverse association with stroke in the baseline model (LBW HR = 1.59, 95% CI: 1.28, 1.96) that was robust in magnitude in the adjusted and fixed-effects models (LBW HR = 1.37, 95% CI: 0.83, 2.25). The baseline model predicting type 2 diabetes also showed an inverse association, where lower birth weight was associated with increased odds (LBW HR = 1.79, 95% CI: 1.50, 2.14). This association was also robust in the adjusted model and when using fixed-effects modeling (LBW HR = 1.71, 95% CI: 1.14, 2.56).
Similar to our mortality results, the magnitudes of association were larger following fixed-effects modeling using continuously measured birth weight (model 4) as compared with magnitudes from population estimates (models 2 and 3). Parameter estimates from baseline, adjusted, and fixed-effects models for continuously represented birth weight are presented in Web Table 3, while ordinal parameter estimates (models 1 and 4) are presented in Web Table 4 for model specification verification.
Sensitivity analyses
In sensitivity analyses, we first tested whether gestational age influenced the results. In particular, we limited the cohort to full-term (≥37 weeks) births and found that results were not biased by premature birth (Web Figure 1), though the reduced number of persons at the lowest birth weights who were born full-term contributed to large confidence intervals around these estimates. In addition, although the sample has been shown to have reliable gestational ages whether measured via last menses or ultrasound (45), we examined whether the removal of extreme gestational ages (<23 weeks and ≥42 weeks and 6 days) affected the results by performing an analysis that included all persons, regardless of their gestational age. The results gave interpretations commensurate with those of the main analyses and sensitivity analyses limiting the sample to full-term births only (results available upon request). Second, we tested an assumption of the sibling-comparison design by exploring whether results from families with more than 1 offspring would generalize to offspring without siblings. The results suggested that estimates were not biased by differences between families with only 1 offspring and those with more than 1 offspring (Web Figure 2).
DISCUSSION
After rigorous, quasi-experimental testing via sibling comparisons in one of the largest population databases compiled to date, we found that risks associated with LBW influenced subsequent mortality and morbidity related to cardiovascular disease, stroke, and type 2 diabetes. Thus, these results underscore the importance of birth weight as a risk factor for subsequent mortality and morbidity, and the findings are consistent with the “developmental origins” hypothesis (1, 5, 7, 13, 22). Further, we found that the risk for studied outcomes increased continuously as birth weight decreased, even for those infants born within the normal (>2,500 g) birth-weight range.
Our findings support previous non-quasi-experimental studies showing increased risk of all-cause mortality and cardiac-related mortality (4). After controlling for similarities between siblings, the associations between birth weight and mortality outcomes were robust. In fact, the estimates of risk slightly increased in magnitude from the population estimates. Previous studies on birth weight have also found increases in magnitude after fitting a fixed-effects sibling-comparison model (17). Sensitivity analyses limiting the sample to families with only 1 offspring suggested that the increased magnitudes of association were not due to a bias of higher estimates in families with more than 1 offspring. Controlling for stable maternal characteristics when using a fixed-effects model, such as maternal body size, may have allowed the offspring-specific risk to emerge.
Similarly, our morbidity results showed inverse associations with birth weight across all outcomes, and the associations were robust in sibling-comparison designs. In particular, our results supported positive associations between birth weight and hypertension found in meta-analyses (11, 12) and previous sibling-comparison studies (15–17). We also found an inverse association between birth weight and pulmonary circulation problems. Though the younger age range in our study may have been a limitation, our findings are in agreement with previous research predicting blood pressure in children (15). Magnitudes of association were slightly elevated in sibling-comparison models, as seen with continuous representation of birth-weight figures (Figure 2). This supports previous research (15, 17) and may be indicative of controlling for stable maternal characteristics.
When predicting ischemic heart disease, our findings agree with those of several previous epidemiologic studies (5–10) suggesting that LBW is associated with increased risk of cardiovascular disease. While our results agree with those from dizygotic twin comparisons, they are in contrast with those from monozygotic twin comparisons that suggest that associations are confounded by shared genetic factors (27). Similarly, when predicting type 2 diabetes and stroke, our results agree with those of a previous meta-analysis (18), epidemiologic studies (16, 19), and dizygotic twin comparisons (27, 31, 41). Previous monozygotic twin comparisons, however, have suggested that genetic confounding may be responsible for the associations identified (27, 31, 41). Our findings also disagree with a previous sibling-comparison study on type 2 diabetes, though the authors pointed out that this finding may have been limited by a small sample size (16). Thus, our sibling-comparison results provide unique converging evidence with previous dizygotic twin comparisons and previous traditional epidemiologic studies while also offering improved generalizability and external validity when studying birth weight (31, 42). Future research utilizing different quasi-experimental designs, each with its own assumptions and limitations, will further clarify the associations (46).
Identifying the mediating mechanisms underpinning these associations is complex, since LBW may be a marker for a variety of prenatal (47) or preconception (48) insults. Epigenetic processes, including DNA methylation and histone modification, have been proposed as mechanisms underlying associations between LBW and the studied outcomes (20–22). Prenatal cues, such as imbalanced maternal nutrition or stress (20, 21, 49), induce shifts in structural and functional fetal development that may reduce birth weight, towards a phenotype best matched to the prenatal condition or the predicted postnatal environment (22). If an environmental mismatch occurs, the developmental phenotype established inside the womb may contribute to various diseases via metabolic set-point misadaptation (20, 22, 50). For example, the combination of impaired fetal growth and rapid childhood weight gain is associated with increased risk of adult cardiovascular disease (9, 20, 50, 51).
The conclusions we have drawn from the current project are bolstered by several strengths. First, our study combined features designed to minimize the influence of confounding factors shared by siblings with statistical control for measured covariates to help rule out plausible alternative hypotheses. The sibling-comparison results arguably are more generalizable to the general population than results of co-twin control studies, because of the inherent problems in using twins to study birth weight. Further, we performed a sensitivity analysis comparing outcomes between offspring with siblings and those without siblings. These analyses tested assumptions of the sibling-comparison approach, examined whether the data used in fixed-effects models were biased, and suggested that results are generalizable to families without multiple children. Second, we utilized a comprehensive, population-based data set to test associations across a broad range of mortality and physical morbidity outcomes, which provided the opportunity to find converging evidence. Additionally, our outcomes were physician-diagnosed diseases, supporting measurement validity and the external validity of our conclusions. Third, our predictor was birth weight, but all associations were adjusted for gestational age at birth. We also verified ordinally measured birth weight findings with continuously measured birth weight and were thus able to increase statistical power while examining the full continuum of birth weight. In addition, we performed a sensitivity analysis limiting the sample to full-term births only, as well as a sensitivity analysis including all gestational ages, both of which provided further evidence of the robustness of the findings.
Despite these strengths, several limitations must be considered and addressed in future research. First, sibling comparisons are not randomized controlled studies; therefore, we could not rule out all possible confounding factors, and causation cannot be shown. Our findings only support the “developmental origins” hypothesis; they do not prove it. While genetic factors that make siblings similar were addressed in the study design, offspring-specific genetic factors that influence birth weight could not be accounted for (46) and may have been driving the associations identified. Second, fixed-effects models have lower statistical power than population-based estimates, but we addressed this by utilizing continuously measured birth weight. In the future, using other quasi-experimental approaches with different assumptions and limitations may clarify associations further (40). In particular, in future sibling-comparison studies, researchers could compare the estimates in full siblings with those in maternal half-siblings to further explore the possibilities of genetic confounding (46). Unfortunately, the sample size in the current study was not large enough to make meaningful comparisons between these types of siblings. Third, replication in countries with different health-care availability and socioeconomic diversity is needed. Fourth, an examination using data with a longer follow-up period would help to determine whether risk is mainly captured by relatively early-onset outcomes. Finally, in future work, researchers should also examine the offspring's later-life risk factors and/or body composition.
Overall, the current results emphasize the importance of considering birth weight as a risk factor for mortality and cardiovascular, stroke, and type 2 diabetes outcomes. As such, the findings are consistent with the “developmental origins” hypothesis. While increasing birth weight may not be an efficient or feasible means of prevention (11, 28), the current results support the need for future research focused on elucidating the mechanisms linking birth weight with mortality and morbidity (2).
Supplementary Material
ACKNOWLEDGMENTS
Author affiliations: Clinical Science Program, Department of Psychological and Brain Sciences, College of Arts and Sciences, Indiana University, Bloomington, Indiana (Quetzal A. Class, Martin E. Rickert, Brian M. D'Onofrio); and Department of Medical Epidemiology and Biostatistics, Karolinska Institutet, Stockholm, Sweden (Paul Lichtenstein).
Q.A.C. was supported by the US National Institute of Mental Health (grant MH094011), B.M.D. was supported by the US National Institute of Child Health and Human Development (grant HD061817), and P.L. was supported by the Swedish Council for Working Life and Social Research and the Swedish Research Council (Medicine).
Conflict of interest: none declared.
REFERENCES
- 1.Barker DJP. Mothers, Babies and Health in Later Life. 2nd ed. Edinburgh, United Kingdom: Churchill Livingstone; 1998. [Google Scholar]
- 2.World Health Organization. 2008–2013 Action Plan for the Global Strategy for the Prevention and Control of Noncommunicable Diseases. Geneva, Switzerland: World Health Organization; 2008. [Google Scholar]
- 3.Murray CJL, Vos T, Lozano R, et al. Disability-adjusted life years (DALY) for 291 diseases and injuries in 21 regions, 1990–2010: a systematic analysis for Global Burden of Disease Study 2010. Lancet. 2012;380(9859):2197–2223. doi: 10.1016/S0140-6736(12)61689-4. [DOI] [PubMed] [Google Scholar]
- 4.Baker JL, Olsen LW, Sorensen TIA. Weight at birth and all-cause mortality in adulthood. Epidemiology. 2008;19(2):197–203. doi: 10.1097/EDE.0b013e31816339c6. [DOI] [PubMed] [Google Scholar]
- 5.Barker DJP, Osmond C, Law CM. The intrauterine and early postnatal origins of cardiovascular disease and chronic bronchitis. J Epidemiol Community Health. 1989;43(3):237–240. doi: 10.1136/jech.43.3.237. [DOI] [PMC free article] [PubMed] [Google Scholar]
- 6.Barker DJP, Gluckman PD, Godfrey KM, et al. Fetal undernutrition and cardiovascular disease in adult life. Lancet. 1993;341(8850):938–941. doi: 10.1016/0140-6736(93)91224-a. [DOI] [PubMed] [Google Scholar]
- 7.Barker DJP. Fetal origins of coronary heart disease. Br Med J. 1995;311(6998):171–174. doi: 10.1136/bmj.311.6998.171. [DOI] [PMC free article] [PubMed] [Google Scholar]
- 8.Osmond C, Barker DJP, Winter PD, et al. Early growth and death from cardiovascular disease in women. Br Med J. 1993;307(6918):1519–1524. doi: 10.1136/bmj.307.6918.1519. [DOI] [PMC free article] [PubMed] [Google Scholar]
- 9.Frankel S, Elwood P, Davey Smith G, et al. Birthweight, body-mass index in middle age, and incident coronary heart disease. Lancet. 1996;348(9040):1478–1480. doi: 10.1016/S0140-6736(96)03482-4. [DOI] [PubMed] [Google Scholar]
- 10.Huxley R, Owen CG, Whincup PH, et al. Is birth weight a risk factor for ischemic heart disease in later life? Am J Clin Nutr. 2007;85(5):1244–1250. doi: 10.1093/ajcn/85.5.1244. [DOI] [PubMed] [Google Scholar]
- 11.Huxley R, Neil A, Collins R. Unravelling the fetal origins hypothesis: is there really an inverse association between birthweight and subsequent blood pressure? Lancet. 2002;360(9334):659–665. doi: 10.1016/S0140-6736(02)09834-3. [DOI] [PubMed] [Google Scholar]
- 12.Mu M, Wang S, Sheng J, et al. Birth weight and subsequent blood pressure: a meta-analysis. Arch Cardiovasc Dis. 2012;105(2):99–113. doi: 10.1016/j.acvd.2011.10.006. [DOI] [PubMed] [Google Scholar]
- 13.Barker DJP, Osmond C, Golding J, et al. Growth in utero, blood pressure in childhood and adult life, and mortality from cardiovascular disease. Br Med J. 1998;298(6673):564–567. doi: 10.1136/bmj.298.6673.564. [DOI] [PMC free article] [PubMed] [Google Scholar]
- 14.Bergvall N, Iliadou AN, Johansson S, et al. Genetic and shared environmental factors do not confound the association between birth weight and hypertension. Circulation. 2007;115(23):2931–2938. doi: 10.1161/CIRCULATIONAHA.106.674812. [DOI] [PubMed] [Google Scholar]
- 15.Leon DA, Koupil I, Mann V, et al. Fetal, developmental, and parental influences on childhood systolic blood pressure in 600 sib pairs: the Uppsala Family Study. Circulation. 2005;112(22):3478–3485. doi: 10.1161/CIRCULATIONAHA.104.497610. [DOI] [PubMed] [Google Scholar]
- 16.Johnson RC, Schoeni RF. Early-life origins of adult disease: national longitudinal population-based study of the United States. Am J Public Health. 2011;101(12):2317–2324. doi: 10.2105/AJPH.2011.300252. [DOI] [PMC free article] [PubMed] [Google Scholar]
- 17.Bergvall N, Iliadou AN, Tuvemo T, et al. Birth characteristics and risk of high systolic blood pressure in early adulthood: socioeconomic factors and familial effects. Epidemiology. 2005;16(5):635–640. doi: 10.1097/01.ede.0000172134.45742.49. [DOI] [PubMed] [Google Scholar]
- 18.Whincup PH, Kaye SJ, Owen CG, et al. Birth weight and risk of type 2 diabetes: a systematic review. JAMA. 2008;300(24):2886–2897. doi: 10.1001/jama.2008.886. [DOI] [PubMed] [Google Scholar]
- 19.Rich-Edwards JW, Stampfer MJ, Manson JE, et al. Birth weight and risk of cardiovascular disease in a cohort of women followed up since 1976. Br Med J. 1997;315(7105):396–400. doi: 10.1136/bmj.315.7105.396. [DOI] [PMC free article] [PubMed] [Google Scholar]
- 20.Hanson M, Godfrey KM, Lillycrop KA, et al. Developmental plasticity and developmental origins of non-communicable disease: theoretical considerations and epigenetic mechanisms. Prog Biophys Mol Biol. 2011;106(1):272–280. doi: 10.1016/j.pbiomolbio.2010.12.008. [DOI] [PubMed] [Google Scholar]
- 21.Gluckman PD, Hanson MA, Buklijas T, et al. Epigenetic mechanisms that underpin metabolic and cardiovascular diseases. Nat Rev Endocrinol. 2009;5(7):401–408. doi: 10.1038/nrendo.2009.102. [DOI] [PubMed] [Google Scholar]
- 22.Gluckman PD, Hanson MA, Cooper C, et al. Effect of in utero and early-life conditions on adult health and disease. N Engl J Med. 2008;359(1):61–73. doi: 10.1056/NEJMra0708473. [DOI] [PMC free article] [PubMed] [Google Scholar]
- 23.Kramer MS. Invited commentary: association between restricted fetal growth and adult chronic disease: is it causal? Is it important? Am J Epidemiol. 2000;152(7):605–608. doi: 10.1093/aje/152.7.605. [DOI] [PubMed] [Google Scholar]
- 24.Saigal S, Stoskopf B, Streiner D, et al. Transition of extremely low-birth-weight infants from adolescence to young adulthood, comparison with normal birth-weight controls. JAMA. 2006;295(6):667–675. doi: 10.1001/jama.295.6.667. [DOI] [PubMed] [Google Scholar]
- 25.Hack M, Flannery D, Schluchter M, et al. Outcomes in young adulthood for very-low-birth-weight infants. N Engl J Med. 2002;346(3):149–157. doi: 10.1056/NEJMoa010856. [DOI] [PubMed] [Google Scholar]
- 26.McNeill G, Tuya C, Smith WCS. The role of genetic and environmental factors in the association between birthweight and blood pressure: evidence from meta-analysis of twin studies. Int J Epidemiol. 2004;33(5):995–1001. doi: 10.1093/ije/dyh260. [DOI] [PubMed] [Google Scholar]
- 27.Öberg S, Cnattingius S, Sandin S, et al. Birth weight predicts risk of cardiovascular disease within dizygotic but not monozygotic twin pairs: a large population-based co-twin-control study. Circulation. 2011;123(24):2792–2798. doi: 10.1161/CIRCULATIONAHA.110.987339. [DOI] [PubMed] [Google Scholar]
- 28.Huxley R, Neil HA. Does maternal nutrition in pregnancy and birth weight influence levels of CHD risk factors in adult life? Br J Nutr. 2004;91(3):459–468. doi: 10.1079/BJN20031052. [DOI] [PubMed] [Google Scholar]
- 29.Thapar A, Rutter M. Do prenatal risk factors cause psychiatric disorder? Be wary of causal claims. Br J Psychiatry. 2009;195(2):100–101. doi: 10.1192/bjp.bp.109.062828. [DOI] [PubMed] [Google Scholar]
- 30.Palinski W. It takes three to tango: genes complicate the association between birth weight and cardiovascular disease. Circulation. 2011;123(24):2773–2775. doi: 10.1161/CIRCULATIONAHA.111.037432. [DOI] [PubMed] [Google Scholar]
- 31.Bergvall N, Cnattingius S. Familial (shared environmental and genetic) factors and the foetal origins of cardiovascular diseases and type 2 diabetes: a review of the literature. J Intern Med. 2008;264(3):205–223. doi: 10.1111/j.1365-2796.2008.01974.x. [DOI] [PubMed] [Google Scholar]
- 32.Lunde A, Melve KK, Gjessing HK, et al. Genetic and environmental influences on birth weight, birth length, head circumference, and gestational age by use of population-based parent-offspring data. Am J Epidemiol. 2007;165(7):734–741. doi: 10.1093/aje/kwk107. [DOI] [PubMed] [Google Scholar]
- 33.Clausson B, Lichtenstein P, Cnattingius S. Genetic influence on birthweight and gestational length determined by studies in offspring of twins. Br J Obstet Gynaecol. 2000;107(3):375–381. doi: 10.1111/j.1471-0528.2000.tb13234.x. [DOI] [PubMed] [Google Scholar]
- 34.Magnus P, Gjessing HK, Skrondal A, et al. Paternal contribution to birth weight. J Epidemiol Community Health. 2001;55(12):873–877. doi: 10.1136/jech.55.12.873. [DOI] [PMC free article] [PubMed] [Google Scholar]
- 35.Svensson AC, Pawitan Y, Cnattingius S, et al. Familial aggregation of small-for-gestational-age births: the importance of fetal genetic effects. Am J Obstet Gynecol. 2006;194(2):475–479. doi: 10.1016/j.ajog.2005.08.019. [DOI] [PubMed] [Google Scholar]
- 36.Lindsay RS, Kobes S, Knowler WC, et al. Genome-wide linkage analysis assessing parent-of-origin effects in the inheritance of birth weight. Hum Genet. 2002;110(5):503–509. doi: 10.1007/s00439-002-0718-2. [DOI] [PubMed] [Google Scholar]
- 37.Lindsay RS, Dabelea D, Roumain J, et al. Type 2 diabetes and low birth weight: the role of paternal inheritance in the association of low birth weight and diabetes. Diabetes. 2000;49(3):445–449. doi: 10.2337/diabetes.49.3.445. [DOI] [PubMed] [Google Scholar]
- 38.Godfrey KM, Gluckman PD, Hanson MA. Developmental origins of metabolic disease: life course and intergenerational perspective. Trends Endocrinol Metab. 2010;21(4):199–205. doi: 10.1016/j.tem.2009.12.008. [DOI] [PubMed] [Google Scholar]
- 39.Academy of Medical Sciences Working Group. Identifying the Environmental Causes of Disease: How Should We Decide What to Believe and When to Take Action? London, United Kingdom: Academy of Medical Sciences; 2007. [Google Scholar]
- 40.Rutter M. Proceeding from observed correlation to causal inference: the use of natural experiments. Perspect Psychol Sci. 2007;2(4):377–395. doi: 10.1111/j.1745-6916.2007.00050.x. [DOI] [PubMed] [Google Scholar]
- 41.Johansson S, Iliadou A, Bergvall N, et al. The association between low birth weight and type 2 diabetes: contribution of genetic factors. Epidemiology. 2008;19(5):659–665. doi: 10.1097/ede.0b013e31818131b9. [DOI] [PubMed] [Google Scholar]
- 42.Loos RJ, Derom R, Vlietinck R. Determinants of birthweight and intrauterine growth in liveborn twins. Paediatr Perinat Epidemiol. 2005;19(suppl 1):15–22. doi: 10.1111/j.1365-3016.2005.00611.x. [DOI] [PubMed] [Google Scholar]
- 43.Lahey BB, D'Onofrio BM. All in the family: comparing siblings to test causal hypotheses regarding environmental influences on behavior. Curr Dir Psychol Sci. 2010;19(5):319–323. doi: 10.1177/0963721410383977. [DOI] [PMC free article] [PubMed] [Google Scholar]
- 44.Neuhaus JM, McCulloch CE. Separating between- and within-cluster covariate effects by using conditional and partitioning methods. J R Stat Soc. 2006;68(5):859–872. [Google Scholar]
- 45.Haglund B. Birthweight distributions by gestational age: comparison of LMP-based and ultrasound-based estimates of gestational age using data from the Swedish Birth Registry. Paediatr Perinat Epidemiol. 2007;21(suppl 2):72–78. doi: 10.1111/j.1365-3016.2007.00863.x. [DOI] [PubMed] [Google Scholar]
- 46.D'Onofrio BM, Lahey B, Turkheimer E, et al. Critical need for family-based, quasi-experimental designs in integrating genetic and social science research. Am J Public Health. 2013;103(suppl 1):S46–S55. doi: 10.2105/AJPH.2013.301252. [DOI] [PMC free article] [PubMed] [Google Scholar]
- 47.Class QA, Lichtenstein P, Langstrom N, et al. Timing of prenatal exposure to maternal severe life events and adverse pregnancy outcomes: a population study of 2.6 million pregnancies. Psychosom Med. 2011;73(3):234–241. doi: 10.1097/PSY.0b013e31820a62ce. [DOI] [PMC free article] [PubMed] [Google Scholar]
- 48.Class QA, Khashan AS, Lichtenstein P, et al. Maternal stress and infant mortality: the importance of the preconception period. Psychol Sci. 2013;24(7):1309–1316. doi: 10.1177/0956797612468010. [DOI] [PMC free article] [PubMed] [Google Scholar]
- 49.Nuyt AM, Alexander BT. Developmental programming and hypertension. Curr Opin Nephrol Hypertens. 2009;18(2):144–152. doi: 10.1097/MNH.0b013e328326092c. [DOI] [PMC free article] [PubMed] [Google Scholar]
- 50.Godfrey KM, Lillycrop KA, Burdge GC, et al. Epigenetic mechanisms and the mismatch concept of the developmental origins of health and disease. Pediatr Res. 2007;61(5 suppl):5R–10R. doi: 10.1203/pdr.0b013e318045bedb. [DOI] [PubMed] [Google Scholar]
- 51.Eriksson JG, Forsen T, Tuomilehto J, et al. Catch-up growth in childhood and death from coronary heart disease: longitudinal study. Br Med J. 1999;318(7181):427–431. doi: 10.1136/bmj.318.7181.427. [DOI] [PMC free article] [PubMed] [Google Scholar]
Associated Data
This section collects any data citations, data availability statements, or supplementary materials included in this article.