

SUMMARY
Channel gating and proton conductance of the influenza A virus M2 channel result from complex pH-dependent interactions involving the pore-lining residues His37, Trp41, and Asp44. Protons diffusing from the outside of the virus protonate His37, which opens the Trp41 gate and allows one or more protons to move into the virus interior. The Trp41 gate gives rise to a strong asymmetry in the conductance, favoring rapid proton flux only when the outside is at acid pH. Here, we show that the proton currents recorded for mutants of Asp44, including D44N found in the A/FPV/Rostock/34 strain, lose this asymmetry. Moreover, NMR and MD simulations show that the mutations induce a conformational change similar to that induced by protonation of His37 at low pH, and decrease the structural stability of the hydrophobic seal associated with the Trp41 gate. Thus, Asp44 is able to determine two important properties of the M2 proton channel.
INTRODUCTION
The M2 proton channel of influenza A virus is an essential protein that is the target of the anti-influenza drugs amantadine and rimantadine (Hong and DeGrado, 2012; Pinto and Lamb, 2006). The proton channel activity of M2 plays distinct and essential roles at different stages in the life cycle of the virus; during the entry phase, M2 is important for allowing acidification of the interior of endosomally encapsulated influenza virus. Also, some influenza A viruses, such as the A/FPV/Rostock/34 strain, have particularly acid-labile hemagglutinin proteins; in this variant a more conductive variant of M2 protects its hemagglutinin from a premature conformational change by equilibrating the acidic pH of the lumen of the trans-Golgi network with the cytoplasm (Betakova et al., 2005; Grambas et al., 1992). The enhanced conductance of M2 in Rostock has been correlated with a mutation of Asp44 to Asn.
M2 conducts protons more rapidly when the pH is low on the outside of the virus (as is the case in an acidifying endosome) than when the situation is reversed (Mould et al., 2000b; Tang et al., 2002). This asymmetric conductance requires the presence of Trp41, which serves as a gate that slows proton conduction in the reverse direction. Protonation of His37 by protons from the outside of the virus is required to open the Trp41 gate, thereby allowing entry of protons into the interior of the channel. Mutation of Trp41 allows access of protons to His37 from inside of the virus, disrupting the strong asymmetry of conduction (Tang et al., 2002). Early studies suggest that Asp44 is also essential for the asymmetric proton conduction of M2, suggesting that it might work in concert with Trp41 to stabilize the gating process (Chizhmakov et al., 2003).
Recent high-resolution nuclear magnetic resonance (NMR) and crystal structures of the M2 channel (Hong and DeGrado, 2012) suggest a plausible mechanism for proton conduction through M2. The highest-resolution crystal structure shows that the outer half of the channel is lined by loosely ordered water molecules that facilitate diffusion of protons to the critical His37, Trp41, and Asp44 residues that line the lower half of the channel. These residues are interspersed with well-ordered clusters of water molecules in an arrangement that is well suited to stabilizing protons as they diffuse through the channel. We refer to this conformation of the channel as the Cclosed conformation, as the side chains near the inward-facing C terminus of the protein are relatively tightly packed. The backbone arrangement of the crystallographic Cclosed conformation is in excellent agreement (within 1.3 Å root-mean-square-deviaton [rmsd]) with (1) an earlier model based on Cys-scanning mutagenesis of the full-length protein (Pinto et al., 1997), (2) SSNMR structures in phospholipid vesicles in the presence (Cady et al., 2010) and absence of amantadine (Sharma et al., 2010), and (3) a solution NMR structure of M2tm-cyto from DHPC micelles (Schnell and Chou, 2008). The His37 conformation is also the same in each structure, with the exception of one model based on SSNMR (Sharma et al., 2010), which suggests that the His37 residues interact directly in a low-barrier hydrogen bond rather than via intervening water molecules. In each structure, the side chain of Trp41 fully or partially shields the His37 residues from protons diffusing from the interior of the virus.
The first two protonations of the His37 tetrad occur with a relatively high pKa; recently proposed models of proton conduction indicate that the Cclosed conformation is stable up to a protonation state of approximately 2+ and that formation of the +3 or +4 state destabilizes this arrangement (Acharya et al., 2010; Hong and DeGrado, 2012; Hu et al., 2006, 2010; Pielak and Chou, 2010; Sharma et al., 2010). At lower pH, where the His37 tetrad reaches the +3 to +4 state, EPR studies indicate that the C-terminal ends of the helices move apart (Nguyen et al., 2008; Thomaston et al., 2013), and SSNMR shows that the His37 residues become more hydrated (Hong and DeGrado, 2012). These results are also consistent with a second crystal form, which has a wider pore near the C terminus. Straightening of a helical kink near Gly34 in the Cclosed structure causes C-terminal dilation in the Copen state (Stouffer et al., 2008). Variable degrees of dilation have been seen in different structures (Acharya et al., 2010; Cady et al., 2010; Stouffer et al., 2008), so the degree to which the helices move is not clear. Nevertheless, even small shifts of the main chain (1) increase the degree of hydration of the pore, (2) decrease electrostatic repulsion between multiply charged His37 side chains, and (3) open the Trp41 gate. Unfortunately, whereas there has been an abundance of NMR structures of the Cclosed conformation of M2 solved near neutral to high pH (Cady et al., 2010; Schnell and Chou, 2008; Sharma et al., 2010), there are no oriented SSNMR or solution NMR structures at low pH to compare to the Copen state seen crystallographically. As the pH is lowered, the peaks of M2tm and M2tm-cyto broaden and overlap, indicative of a dynamically exchanging ensemble of conformations (Hu et al., 2007; Schnell and Chou, 2008). This finding suggests that the different Copen states seen in crystal structures might represent a snapshot of a dynamic ensemble of states formed at low pH.
Whereas some details of the precise structures of the protein at different protonation states remain under debate, all current mechanisms share the common prediction that the proton conduction cycle is primed when the channel achieves a certain protonation state, most probably +2. Protonation to the +3 state destabilizes the tight interactions between His37 residues and increases the dynamics and/or hydration of the pore to allow the proton to penetrate past Trp41 into the virus interior. These predictions are also generally supported by MD simulations (Khurana et al., 2009; Zhou, 2011). Asp44 appears to play a critical role in stabilizing the Cclosed form of the channel by forming direct or water-mediated hydrogen bonds to the indole NH of Trp41 (Acharya et al., 2010; Schnell and Chou, 2008). Asp44 also forms a weaker hydrogen-bond to Arg45 of a neighboring helix, although this interaction appears to be somewhat geometrically variable in crystal and solution NMR structures of the protein. We hypothesize that this interaction network is weakened in Asp44 mutants, increasing the relative population of the Copen structure. A secondary effect is also a destabilization of the packing of Trp41, required for asymmetric proton conduction.
Whereas this is an attractive hypothesis, so far detailed spectroscopic and molecular dynamics (MD) studies of variants of Asp44 have been lacking. Here, we performed an in-depth electrophysiological examination of the conductance properties of M2 from the A/Udorn/72 and A/FPV/Weybridge/27 strains of the virus, which contain Asp44, with the channel from A/FPV/Rostock/34, which has the D44N mutation. Unexpectedly, we found that all three forms of the channel have conductances that are associated with two distinct protonation states of the channel. Whereas only one of these contributes greatly in the pH range of 7–5 encountered in an endosome, the presence of the second conduction state needed to be considered to allow an accurate evaluation of the physiologically relevant apparent pKa of the channel. We next confirmed that Asp44, but not Arg45, was essential for the asymmetric proton conduction. Finally, we used solution NMR and MD simulations to examine the relative stability of the Cclosed versus Copen state of the channel for wild-type (WT) (Asp44) versus D44N variant of the Udorn protein. Together, the results indicate that Asp44 serves to stabilize Trp41 gate in a closed position.
RESULTS AND DISCUSSION
Asp44 Regulates the pH Dependence of the Proton Current of M2 Expressed in Xenopus Oocytes
When Asp44 in Udorn M2 was mutated to other residues, i.e., Ala, Asn, Gly, and Thr, the channel conductance was significantly enhanced in the pH range pH 8.5–5 (Balannik et al., 2010; Betakova et al., 2005). In our previous studies we found that the Udorn M2 inward current does not reach saturation (Balannik et al., 2010) over the range of pH 8 to 5. In contrast, Chizhmakov et al. (2003) showed that A/FPV/Rostock M2 proton current reaches a maximum when pHout is lowered to 3.5. We therefore examined the pH dependence of conduction for Udorn, Weybridge, and Rostock M2 in the pH range of 8 to 3.0 (Figure 2). The conductance was measured shortly after acidification of the solution bathing the oocyte, before the inner pH had significantly decreased. This was important to minimize the possibility that Asp44 on the inner end of the pore would change its protonation state at low pHout. To allow comparison of the shape of the pH-flux curves for the different proteins, we normalized the current for each protein to its conductance at pH 5.0. The Rostock protein approached saturation near pH 3, but analysis of the curve using a single apparent pKdiss resulted in a rather poor fit. By contrast, a two-proton scheme gave an excellent fit to the data and indicated the presence of two protonation events with apparent pKa’s of 6.0 and 4.3. Similarly, whereas a single-site scheme failed to fit the data well for Udorn and Weybridge, the two-proton scheme provided an excellent fit to their curves. Previous data suggest that the His37 tetrad is doubly protonated at pH 7, which suggests that these two apparent pKa values reflect conduction through the formation of the +3 and +4 states of the protein, respectively. However, because the pH curves of M2 vary with the lipid composition, we take the conservative approach of referring to the two conduction states as state 1 and 2, respectively. Also, because these are kinetic, rather than thermodynamic, measurements, emphasizing that they reflect apparent, rather than true, pKa values is important. Figures 2E and 2F show the relative contributions of the two states to the conduction of the channel as a function of pH. Whereas the first conductance state is responsible for the great majority of the conductance at the endosomal pH encountered by the virus prior to fusion (app. 6.0 to 5.4; Grambas et al., 1992), accounting for the second conduction state was necessary to allow accurate determination of the first apparent pKa.
Figure 2. pH Dependence Profiles of Various Influenza M2 Ion Channels.

(A–D) Two-state scheme shows that the data significantly fits better than a one-state scheme (A). Activities between WT Udorn M2, Rostock M2, and Weybridge M2 are compared (B). Differences demonstrated between Udorn and its mutants (C), and Weybridge and its D44N mutant (D), respectively.
(E and F) Computed current carried by each states as a function of pH from the two states for Udorn M2 and Rostock M2 (WT), respectively, calculated from the parameters listed in Table 1. In (E) and (F), solid lines are for the activity over a range from pH 5 to 8. In the inset of (E), the section is zoomed in to clearly illustrate the contribution from each state between pH 5 and 8.
A two-proton conduction scheme fits the data well for each protein, and the first pKdiss values for the three proteins are quite similar (5.82 ± 0.13). However, there were very significant differences in both the pKa for the second protonation state as well as the extrapolated conductances of the two states (relative to the rate at pH 5.0). The relative conduction of Rostock M2 at low pH extrapolates to approximately 2.5-fold greater than the rate at measured at pH 5 (Table 1); the corresponding values for Udorn and Weybridge are 12- and 6-fold greater than at pH 5, respectively. However, the fact that the Udorn M2 is intrinsically 3- to 4-fold less conductive than is Rostock M2 in the range of pH 6–5 should be appreciated (see Figure 2 [Balannik et al., 2010] for specific activities of M2 proteins with various porelining residues). Thus, Rostock M2 is less conductive than is Udorn near pH 5 but is approximately as conductive near pH 3, where the intrinsic conductance of the second state becomes dominant (Figures 2C and 2D). This behavior is consistent with a stabilizing interaction between Asp44 and the Trp41 gate, in which this stabilization limits the proton flux of the first conduction state of Weybridge and Udorn protein. If this Asp44–Trp41 interaction is truly stabilizing, we expect the pKa to be depressed (although less than a decrease in pH required for opening) for entering the second conduction state of Weybridge and Udorn relative to Rostock. Indeed, the extrapolated pKdiss values were significantly depressed (Table 1) by 0.8 and 0.5 units for Udorn and Weybridge, respectively, as compared to Rostock.
Table 1.
The Maximal Conduction and the Associated pKa Values of the Two States for Various A/M2 Variants
| A/M2 | Udorn | Rostock | Weybridge | Weybridge D44N | Udorn D44A | Udorn D44N | Udorn V27I/V28I |
|---|---|---|---|---|---|---|---|
| r1a | 86.8 ± 9.3 | 86.0 ± 7.1 | 92.0 ± 5.0 | 81.8 ± 17.3 | 110.8 ± 10.3 | 79.4 ± 5.0 | 150.0 ± 26.2 |
| pK1a | 5.73 ± 0.13 | 5.99 ± 0.08 | 5.76 ± 0.06 | 5.88 ± 0.18 | 5.61 ± 0.09 | 6.07 ± 0.07 | 5.30 ± 0.17 |
| r2a | 1,282.0 ± 15.7 | 252.9 ± 3.0 | 662.1 ± 4.5 | 247.2 ± 4.4 | 250b | 286.8 ± 3.2 | 1,300b |
| pK2a | 3.47 ± 0.02 | 4.28 ± 0.06 | 3.71 ± 0.01 | 4.41 ± 0.11 | 4.02 ± 0.07 | 4.18 ± 0.04 | 3.32 ± 0.02 |
Fixed in the fitting.
Only a few residues differ in the TM domains of the Udorn and Rostock proteins (Figure 1). When we mutated Asp44 in Udorn M2 to Asn (the corresponding residue of Rostock M2), the pH dependence profile was changed dramatically to resemble that of Rostock (Figure 2C). Mutation of Asp44 of Udorn to Ala had a similar effect (Figure 2C). On the other hand, when Val27 and Val28 in Udorn M2 were mutated to the corresponding residues in Rostock M2 (Ile), there was no detectable alteration in the pH profile. Moreover, when we mutated Asp44 in Weybridge M2 to Asn, the pH profile of the resulting mutant was nearly identical to Rostock M2 (Figure 2D). These findings further support the importance of Asp44 for stabilizing the Trp41 gate.
Figure 1. Sequence and Structure of the M2 Ion Channel.

(A) Sequence alignment of A/Udorn/72 (U), A/FPV/Rostock/34 (R), and A/FPV/Weybridge/27 (W) M2 channels. The box indicates the TM domain. Note the TM sequences differ only at positions 27, 28, 38, and 44.
(B) The crystal structure (3LBW) of the TM domain of Udorn M2 is shown. One helix has been removed for clarity in (B), and pore-lining residues and well-ordered water molecules are shown in sticks and spheres, respectively.
(C) An orthogonal view of the channel highlighting the water network connecting Trp41 to Asp44 is shown.
Asp44 Is Required for Asymmetric Proton Conduction
We assessed the role of Asp44 in stabilizing the Trp41 gate by measuring the presence of outward currents after deliberately inducing a high proton concentration inside the cell. Oocytes expressing the M2 protein were bathed in acidic media (pH 5.5) for 4 min, resulting in an inward current (downward deflection) and acidification. The decreased flux with time seen in Figure 3 is related to a decreased gradient as the interior pH is lowered. Upon returning to alkaline solution (pHout = 8.5), the oocytes expressing the M2 W41F, D44N, D44C, and D44A mutant channels conducted outward currents (arrow), but those expressing the Udorn WT M2 channel did not (Figure 3). Indeed, the Asp44 mutants behaved quite similar to the W41F mutant in which the Trp44 gate has been incapacitated by mutation to Phe (Tang et al., 2002). To confirm the outward proton flux seen in the mutants, we measured I/V curves before acidification and after acidification of the interior of the oocyte (noted as A and B in Figure 3) in 2 s voltage ramps ranging from −60 to +80 mV. The difference in current-voltage curves before versus after acidification varied widely among the Udorn M2 variants. A quantitative interpretation of the data is not easy, because the curves represent the difference between two I/V curves and also because the precise degree of interior acidification was not measured. Nevertheless, the outward current amplitude was clearly dramatically increased above that observed for Udorn M2 WT when the interior was acidified (Figure 4). In fact, the outward current was nearly as great for the Asp44 variants as for the W41F mutant. We also examined the mutant R45C, because this residue forms a salt bridge with Asp44 (Figure 1). However, it did not have as marked effect on conduction as was the case for Asp44 mutants.
Figure 3. Outward (Reverse) Proton Current through M2.

The channel of Udorn M2-D44N, M2-D44C, M2-D44A, and W41F, but not WT Udorn M2 and R45C, is open when pHin is low and pHout is high. In order to achieve significant acidification, only oocytes with initial maximum inward current between 2.0 to 2.5 μA were chosen. During the time course of recording, membrane potential was clamped to a constant value (−20 mV), except during two 2 s voltage ramps (noted as A and B) used to determine the current-voltage relationships shown in Figure 4.
Figure 4. Outward (Reverse) Proton Current through Udorn M2.

The difference in currents indicated by “A” and “B” in Figure 3 is plotted as a function of applied voltage. Current-voltage relationships were measured with 2 s long ramps (from −60 to + 80 mV; A, 30 s before acidification; B, 10 s after acidification). Note that the larger outward currents seen in the current-voltage relationships of these Udorn M2 mutants agree with the presence of outward current in Figure 3.
In summary, these data indicate that Asp44 stabilizes the Trp41 gate and that Arg45 plays only a secondary role that is not readily apparent in these measurements.
NMR Shows the Cclosed Conformation Is Destabilized by the D44N Mutation
To determine the effect of the D44N mutation on the stability of the Cclosed conformation, we examined the NMR spectrum of its TM domain at pH 6.0 in C14-betaine micelles, using a fragment, M219–49, that includes the channel-forming domain and a portion of the cytoplasmic helix. Under these conditions, the channel is primarily in the Cclosed state for the wild-type, as determined by several diagnostic peaks. Figure 5 shows the amide region of the 15N-HSQC and the aromatic region of the 13C-HSQC spectra, with assignments of Trp41 and His37 with and without underlines for the Cclosed and Copen states, respectively. The highly downfield-shifted indole NH peak near 11 ppm (proton dimension) in the wild-type 15N-HSQC spectrum is a signature of strong ring-current shifts from other Trp41 in the Cclosed state, and the His37 Hε1 is even more shifted from 7.8 ppm to approximately 5 ppm, indicating that the side chain of Trp 41 in the Cclosed state is well packed. At the same pH, the diagnostic downfield-shifted indole NH peak from Trp41 is entirely missing in the D44N spectrum, indicating that the Cclosed state has been destabilized relative to the Copen state. Moreover, many of the Trp 41 resonances are broadened beyond detection. The unusual upfield-shifted His37 Hε1 also disappears, as expected by rearrangements of the His-box/Trp interaction in a Copen conformation.
Figure 5. Aromatic 13C-HSQC on the Top and 15N-HSQC at the Bottom at pH 6.0 for WT, D44N, and D44N in Absence and Presence of 15 eq AMT.

(A) and (D) spectra are for WT; (B) and (E) are for D44N; and (C) and (F) are for D44N in presence of 15 eq AMT. The spectra were recorded in 100 mM C14-betaine and 50 mM sodium phosphate at 313 K in 10% D2O for 2 mM (monomer for WT and D44N) on a Varian or Bruker 600 MHz spectrometer or 0.8 mM (for D44N in presence of 15 AMT molecules per tetramer) on a Bruker 900 MHz spectrometer. Assignments with and without underline are for the Cclosed and Copen, respectively. The assignments were obtained by referencing to the spectra of WT in presence of M2WJ10 or S31N in presence of M2WJ332 (Pinto and Lamb, 2006). Peaks in the dashed frame are from the residues F47 and F48. # means no assignment, and * is labeled for the folded peak from 73.4 ppm.
If the changes in the spectrum seen for D44N are a result of changes in the relative energetics of the Cclosed versus the Copen states, tipping the energetic balance toward the Cclosed state should be possible by adding drug that stabilizes the Cclosed state. In presence of 15 AMT molecules per tetramer, new peaks appear with wider chemical shift dispersion in the 15N-HSQC spectrum and distribute in similar positions as in the wild-type spectrum, indicating that the backbone of the Cclosed state can be stabilized by AMT but with a much higher AMT ratio (15 eq). However, the Trp41 Hε1 and His37 Hδ2 and Hε1 peaks still have negligible chemical shift changes, indicating that the correlation of backbone movements and Trp indole ring conformation become weaker, and the same is true for the correlation between rings between Trp41 and His37. Taken together, the interaction between Trp41 and Asp44 (presumably through water networks) is important for backbone structure/dynamics and vital to stabilize the Trp gate.
Molecular Dynamics Simulations
We performed three simulations of the transmembrane domain of M2 (M2TM) embedded in a 80 × 80 Å2 hydrated palmitoyloleoyl-phosphatidylcholine (POPC) bilayer, applying the mutations D44A, D44C, and D44N. We initialized two of the four His37 side chains in the cationic state, with the neutral ones in the epsilon-tautomeric state (Hu et al., 2010). We modeled the initial conformation on the basis of the X-ray crystallographic structure of M2TM (1.65 Å), which is at the highest resolution obtained so far for this tetramer (Acharya et al., 2010), and performed a room temperature simulation of about 100 ns for each mutant. Because the structure was resolved for the G34A mutant (Acharya et al., 2010), we also performed a simulation of WT-M2TM under the same conditions as a control. We compared these results with the previously published simulations (Acharya et al., 2010) of G34A-M2TM at charge states +1, +3, and +4. This was done for two reasons: first, to compare the mutation-induced conformational transitions to the ones triggered by a change in pH, and second, to compare the results of our simulations of WT-M2 with those of the previous work done with mutations at residue 34.
All of the Asp44 mutants exhibit strong deviations from the X-ray structure of G34A-M2TM, similar to those observed in simulations of the +3 and +4 charge states of WT (Acharya et al., 2010; Khurana et al., 2009). In Figure 6, we compare the rmsds of the four structures (WT, D44A, D44C, and D44N) from the X-ray structure (Acharya et al., 2010), as a function of the simulated time. The WT structure remains stable over the period of the simulation: the rmsd remains within 1.5 Å, considering only the backbone atoms, and within 2 Å when all atoms are considered. In contrast, the structures of the three mutants all follow a divergent trajectory: the rmsd of all atoms increases to about 3 Å for D44A and D44C and to 4 Å for D44N (Figure 6).
Figure 6. RMSDs of M2TM from the Initial X-Ray Structure.

Rmsds are plotted as a function of time and computed for different subset of atoms: all heavy atoms, except for the mutated side chain at position 44 (blue), all backbone atoms (black), all heavy atoms of the His37 (orange), and Trp41 side chains (purple) (Acharya et al., 2010).
The conformational changes induced by the mutations resemble those already observed between the high pH (Schnell and Chou, 2008; Sharma et al., 2010) and low pH structures (Acharya et al., 2010; Khurana et al., 2009; Stouffer et al., 2008). In each of the three mutants, the structure of the M2TM bundle opens at the C-terminal end (Figure 7). The distance between the Cα atoms of the amino acid 44 from two neighboring monomers (approximately 12 Å in the X-ray structure; Acharya et al., 2010) increases to about 16 ± 3 Å in D44A, 18 ± 4 Å in D44C, and 20 ± 3 Å in D44N. In contrast, these distances settle to around 13 ± 2 Å for WT-M2TM in the 2+ charge state and 22 ± 3 Å in the 4+ state. Therefore, all the three mutations induce a partial conformational change similar to that occurring upon acidification of WT-M2, as seen in the low pH structure (Acharya et al., 2010; Stouffer et al., 2008).
Figure 7. Structural Models of the D44A, D44C, and D44N Mutants of M2TM Are Compared to the Structures of WT-M2TM.
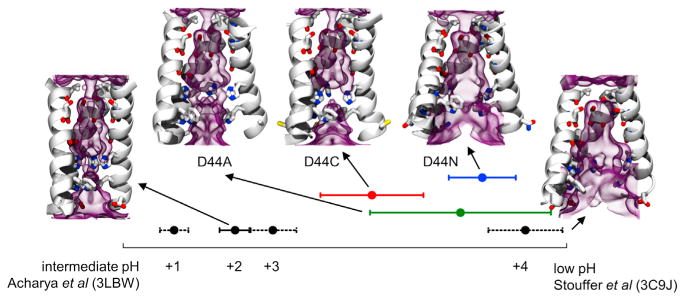
Structural models of the mutants, showed in the upper part of the graph, compared to the intermediate pH (Acharya et al., 2010) and low pH structures (Stouffer et al., 2008) of WT-M2TM, shown at left and right sides. The protein backbone is drawn as ribbons, whereas the pore-lining side chains (residues 27, 31, 34, 37, 41, and 44) and the carbonyl groups interacting with water molecules are represented as sticks. The density of water, averaged over each MD trajectory, is shown as a purple transparent diagram. Points indicate average simulated values of the principal component p in the direction between the two experimental structures; error bars indicate standard deviations. Water densities drawn within the two WT-M2TM structures were calculated at the +2 and +4 charge states, respectively. All simulations were initialized at the intermediate pH structure (Acharya et al., 2010).
To quantify the magnitude of the backbone conformational change throughout the entire chain, we computed difference vectors between the coordinates of the backbone of each mutant of M2TM and those of the backbone of the high-resolution X-ray structure at intermediate pH (Acharya et al., 2010). Then we computed the scalar product of this vector with the difference vector between the intermediate pH (Acharya et al., 2010) and the low pH structures (Stouffer et al., 2008). This quantity, p, can be interpreted as a principal component, and when normalized, it equals zero for the intermediate pH (Acharya et al., 2010) and one at the low pH structure (Stouffer et al., 2008). Therefore, p indicates the fraction of low pH structure versus intermediate pH structure in each simulation.
In WT-M2TM at the +2 state, p spans values from 0.15 from 0.25, suggesting that small movements toward the low pH structure occur at room temperature (Figure 7). In the D44A- and D44C-M2TM simulations, p settles at around 0.45, and p settles at around 0.7 in the D44N-M2TM simulation. For comparison, in the WT-M2TM simulation in the +4 state, p stabilizes around 0.9. All these simulations were initialized at the intermediate pH structure (p = 0). This suggests that Asp44 mutations induce a conformational change equivalent to the one induced by low pH. However, the magnitude of this conformational change in D44A-M2 and D44C-M2 is about 50% of the one induced by low pH and that in D44N-M2TM is about 70% of that.
There are two functional consequences resulting from the mutation of Asp44. The first consequence of the Asp44 mutation is to induce proton current reverse flow at the condition of low pHin as in W41F mutant channel. In our simulations, the amino acid at position 44 does not appear to interact with the HxxxW motif simply by tuning the bundle structure but rather via interactions mediated by pore waters. These pore-bound water molecules participate in regulating gating and conductance (Mould et al., 2000a, 2000b; Tang et al., 2002). The results of Asp44 mutations depend largely on the charge state of M2TM and thus on the pH value.
The second consequence of Asp44 mutation is an altered pHout-dependent proton current profile. Our study suggests that, above pH 5, the structure of the Asp44 mutants is remarkably similar to that of the WT M2 at low pH, i.e., open at the inward-facing end. As a result, the release of protons to the virion interior, which is the rate-limiting step in conduction through M2 (Hu et al., 2006), is facilitated by mutations of Asp44.
At pH under pH 5, all four His37 side chains are protonated, according to the current estimates of the pKa, and all mutants of M2TM feature a similar structure, which is closed at the outward-facing end of the channel. In this situation, proton uptake may become the rate-limiting step, as a conformational transition toward the intermediate pH structure (Acharya et al., 2010) is required for protons to diffuse to the His37 residues. Based on our analysis, WT-M2TM may retain a higher fraction of intermediate pH structure than does its Asp44 mutants for values of pH below which proton conduction occurs. This could account for the saturation of the synthetic mutants at about pH 5. This saturation is also seen in naturally occurring strains bearing the D44N mutation. Thus, two important properties of the minimalistic M2 proton channel are in part determined by a single residue at position 44. The identity of this residue varies naturally among the presently circulating strains of the virus. Perhaps this variation will be of use in understanding interactions of the M2 protein with other viral proteins or host proteins, and this variation must be kept in mind when designing antiviral inhibitors of the channel.
EXPERIMENTAL PROCEDURES
Plasmids and mRNA Synthesis
All cDNA constructs were cloned into pGEM3 vector. Point mutations in this study were introduced via the QuikChange site-directed mutagenesis method. The nucleotide sequences of all plasmid inserts were verified. For the expression in oocytes, plasmids were linearized with HindIII; the mRNA was synthesized in vitro using T7 RNA polymerase (mMessage mMachine, Ambion).
Microinjection of Oocytes and Two-Electrode Voltage Clamp Analysis
Stages V–VI Xenopus laevis oocytes were prepared as described previously (Cady et al., 2009). Oocytes of good size and color were injected with 50 nl of mRNA (~1.0 μg/μl) and assayed 2–3 days later. Electrophysiological Two electrode voltage clamp (TEVC) recordings were carried out using TEV-200 (Dagan) connected to DIGIDATA 1440A and pCLAMP10 (Molecular Devices). For the studies of pH dependence of A/M2 channel current, individual oocytes were held at a voltage of 20 mV and bathed in normal Barth’s solution (88.0 mM NaCl, 1.0 mM KCl, 2.4 mM NaHCO3, 0.3 mM NaNO3, 0.71 mM CaCl2, 0.82 mM MgSO4, and 15 mM HEPES [for pH 8.5–7.0], or 15 mM Mes [for pH 6.5–5.5], 15 mM tartaric acid [for pH 5.0–4.0], or 15 mM glycine [for pH 3.5 –3.0]). For the reverse current studies, only oocytes with initial maximum inward current between 2.0 to 2.5 μA were chosen. During the time course of recording, membrane potential was clamped to a constant value (−20 mV), except during two 2 s voltage ramps (noted as A and B), ranging from −60 to 80 mV used to determine the current-voltage relationships shown in Figure 4.
NMR Spectroscopy
All spectra were recorded at 313 K on Varian 600 MHz for WT or 900 MHz spectrometer for D44N, both equipped with a cryogenic probe. The two-dimensional 13C- or 15N-HSQC spectra were recorded with standard pulse sequences (Sattler et al., 1999) with 16 scans, t2,max = 142 ms and t1,max = 9 ms for 13C-HSQC or t1,max = 80 ms for 15N-HSQC.1H chemical shifts were referenced with respect to residual water peak at 4.63 ppm, and 13C and 15N chemical shifts were referenced indirectly via gyromagnetic ratios. All spectra were processed and analyzed using the programs nmrPipe (Delaglio et al., 1995). The first third time domain data of 13C and 15N dimensions were used to extend time domain data points by linear prediction. Prior to Fourier transform (FT), time domain data were multiplied by sine square bell window functions shifted by 90° and zero-filled once.
Molecular Dynamics Simulations
Classical molecular dynamics (MD) simulations were performed using a tetramer of the transmembrane helix region of A/M2 (M2TM - residues 25–46). Simulations were performed for four different protonation states of the WT (+1, +2, +3, +4) and three mutants in the 2+ state: D44A, D44C, and D44N. All the structural models were initialized using the 1.65 Å resolution X-ray structure of the M2TM (Acharya et al., 2010). In all the structural models, neutral histidine residues were set in the epsilon-tautomeric state; in the 2+ state, the system was initialized with two charged histidines from nonadjacent chains. Coordinates for the mutated side chains were generated with the Mutator plugin of visual molecular dynamics (VMD) (Humphrey et al., 1996). M2TM mutants were embedded into a pre-equilibrated bilayer composed by 171 1-palmytoyl-2-oleoyl-sn-glycero-3-phosphatidylcholine (POPC) molecules in a box containing 10,031 water molecules. Chloride and potassium ions were added to ensure charge neutrality and to provide a solution buffer with ionic concentration of ~0.15 M. Water molecules were described using the TIP3P model (Jorgensen et al., 1983); the peptide chains, the lipids, and the ions were modeled using the CHARMM force field (MacKerell et al., 2000). The simulations were performed by applying periodic boundary conditions, and the electrostatic interactions were calculated using the particle mesh Ewald (PME) method (Essmann et al., 1995), with a real space spherical cutoff of 12 Å and an accuracy threshold of 10−6. Lennard-Jones interactions were cut off at 12 Å The equations of motion were solved with the velocity Verlet integrator using a time step of 2.0 fs. The lengths of the bonds involving hydrogen atoms were constrained with the SHAKE method (Ryckaert et al., 1977). Equilibration MD runs of ~6 ns were performed for each system by applying harmonic restraining potentials on the position of the nonhydrogen atoms of the peptide backbone (force constant k = 1.0 kcal mol−1 Å−2). Subsequent production runs were performed after releasing all the harmonic restraints at 310.0 K and 1.013 bar using Langevin temperature and Langevin piston pressure coupling schemes, allowing only the dimension of the box perpendicular to the membrane to vary. A trajectory of 100 ns was sampled for each system. All the MD simulations were performed with NAMD (Phillips et al., 2005) and analyzed with VMD (Humphrey et al., 1996).
Acknowledgments
This research was supported by research grants from the National Institutes of Health (AI-R01-20101 to R.A.L. and AI-U01-074571 to W.F.D.) and the Department of Health of the Commonwealth of Pennsylvania (to M.L.K.). Computer time for MD simulations was provided by XSEDE allocation TG-MCA93S020.
References
- Acharya R, Carnevale V, Fiorin G, Levine BG, Polishchuk AL, Balannik V, Samish I, Lamb RA, Pinto LH, DeGrado WF, Klein ML. Structure and mechanism of proton transport through the transmembrane tetrameric M2 protein bundle of the influenza A virus. Proc Natl Acad Sci USA. 2010;107:15075–15080. doi: 10.1073/pnas.1007071107. [DOI] [PMC free article] [PubMed] [Google Scholar]
- Balannik V, Carnevale V, Fiorin G, Levine BG, Lamb RA, Klein ML, Degrado WF, Pinto LH. Functional studies and modeling of pore-lining residue mutants of the influenza a virus M2 ion channel. Biochemistry. 2010;49:696–708. doi: 10.1021/bi901799k. [DOI] [PMC free article] [PubMed] [Google Scholar]
- Betakova T, Ciampor F, Hay AJ. Influence of residue 44 on the activity of the M2 proton channel of influenza A virus. J Gen Virol. 2005;86:181–184. doi: 10.1099/vir.0.80358-0. [DOI] [PubMed] [Google Scholar]
- Cady SD, Mishanina TV, Hong M. Structure of amantadine-bound M2 transmembrane peptide of influenza A in lipid bilayers from magic-angle-spinning solid-state NMR: the role of Ser31 in amantadine binding. J Mol Biol. 2009;385:1127–1141. doi: 10.1016/j.jmb.2008.11.022. [DOI] [PMC free article] [PubMed] [Google Scholar]
- Cady SD, Schmidt-Rohr K, Wang J, Soto CS, Degrado WF, Hong M. Structure of the amantadine binding site of influenza M2 proton channels in lipid bilayers. Nature. 2010;463:689–692. doi: 10.1038/nature08722. [DOI] [PMC free article] [PubMed] [Google Scholar]
- Chizhmakov IV, Ogden DC, Geraghty FM, Hayhurst A, Skinner A, Betakova T, Hay AJ. Differences in conductance of M2 proton channels of two influenza viruses at low and high pH. J Physiol. 2003;546:427–438. doi: 10.1113/jphysiol.2002.028910. [DOI] [PMC free article] [PubMed] [Google Scholar]
- Delaglio F, Grzesiek S, Vuister GW, Zhu G, Pfeifer J, Bax A. NMRPipe: a multidimensional spectral processing system based on UNIX pipes. J Biomol NMR. 1995;6:277–293. doi: 10.1007/BF00197809. [DOI] [PubMed] [Google Scholar]
- Essmann U, Perera L, Berkowitz ML, Darden T, Lee H, Pedersen LG. A smooth particle mesh ewald method. J Chem Phys. 1995;103:8577–8593. [Google Scholar]
- Grambas S, Bennett MS, Hay AJ. Influence of amantadine resistance mutations on the pH regulatory function of the M2 protein of influenza A viruses. Virology. 1992;191:541–549. doi: 10.1016/0042-6822(92)90229-i. [DOI] [PubMed] [Google Scholar]
- Hong M, DeGrado WF. Structural basis for proton conduction and inhibition by the influenza M2 protein. Protein Sci. 2012;21:1620–1633. doi: 10.1002/pro.2158. [DOI] [PMC free article] [PubMed] [Google Scholar]
- Hu F, Luo W, Hong M. Mechanisms of proton conduction and gating in influenza M2 proton channels from solid-state NMR. Science. 2010;330:505–508. doi: 10.1126/science.1191714. [DOI] [PMC free article] [PubMed] [Google Scholar]
- Hu J, Fu R, Nishimura K, Zhang L, Zhou HX, Busath DD, Vijayvergiya V, Cross TA. Histidines, heart of the hydrogen ion channel from influenza A virus: toward an understanding of conductance and proton selectivity. Proc Natl Acad Sci USA. 2006;103:6865–6870. doi: 10.1073/pnas.0601944103. [DOI] [PMC free article] [PubMed] [Google Scholar]
- Hu J, Asbury T, Achuthan S, Li C, Bertram R, Quine JR, Fu R, Cross TA. Backbone structure of the amantadine-blocked transmembrane domain M2 proton channel from Influenza A virus. Biophys J. 2007;92:4335–4343. doi: 10.1529/biophysj.106.090183. [DOI] [PMC free article] [PubMed] [Google Scholar]
- Humphrey W, Dalke A, Schulten K. VMD: visual molecular dynamics. J Mol Graph. 1996;14:33–38. 27–38. doi: 10.1016/0263-7855(96)00018-5. [DOI] [PubMed] [Google Scholar]
- Jorgensen WL, Chandrasekhar J, Madura JD, Impey RW, Klein ML. Comparison of simple potential functions for simulating liquid water. J Chem Phys. 1983;79:926–935. [Google Scholar]
- Khurana E, Dal Peraro M, DeVane R, Vemparala S, DeGrado WF, Klein ML. Molecular dynamics calculations suggest a conduction mechanism for the M2 proton channel from influenza A virus. Proc Natl Acad Sci USA. 2009;106:1069–1074. doi: 10.1073/pnas.0811720106. [DOI] [PMC free article] [PubMed] [Google Scholar]
- MacKerell AD, Jr, Banavali N, Foloppe N. Development and current status of the CHARMM force field for nucleic acids. Biopolymers. 2000;56:257–265. doi: 10.1002/1097-0282(2000)56:4<257::AID-BIP10029>3.0.CO;2-W. [DOI] [PubMed] [Google Scholar]
- Mould JA, Drury JE, Frings SM, Kaupp UB, Pekosz A, Lamb RA, Pinto LH. Permeation and activation of the M2 ion channel of influenza A virus. J Biol Chem. 2000a;275:31038–31050. doi: 10.1074/jbc.M003663200. [DOI] [PubMed] [Google Scholar]
- Mould JA, Li HC, Dudlak CS, Lear JD, Pekosz A, Lamb RA, Pinto LH. Mechanism for proton conduction of the M(2) ion channel of influenza A virus. J Biol Chem. 2000b;275:8592–8599. doi: 10.1074/jbc.275.12.8592. [DOI] [PubMed] [Google Scholar]
- Nguyen PA, Soto CS, Polishchuk A, Caputo GA, Tatko CD, Ma C, Ohigashi Y, Pinto LH, DeGrado WF, Howard KP. pH-induced conformational change of the influenza M2 protein C-terminal domain. Biochemistry. 2008;47:9934–9936. doi: 10.1021/bi801315m. [DOI] [PMC free article] [PubMed] [Google Scholar]
- Phillips JC, Braun R, Wang W, Gumbart J, Tajkhorshid E, Villa E, Chipot C, Skeel RD, Kalé L, Schulten K. Scalable molecular dynamics with NAMD. J Comput Chem. 2005;26:1781–1802. doi: 10.1002/jcc.20289. [DOI] [PMC free article] [PubMed] [Google Scholar]
- Pielak RM, Chou JJ. Kinetic analysis of the M2 proton conduction of the influenza virus. J Am Chem Soc. 2010;132:17695–17697. doi: 10.1021/ja108458u. [DOI] [PMC free article] [PubMed] [Google Scholar]
- Pinto LH, Lamb RA. Influenza virus proton channels. Photochem Photobiol Sci. 2006;5:629–632. doi: 10.1039/b517734k. [DOI] [PubMed] [Google Scholar]
- Pinto LH, Dieckmann GR, Gandhi CS, Papworth CG, Braman J, Shaughnessy MA, Lear JD, Lamb RA, DeGrado WF. A functionally defined model for the M2 proton channel of influenza A virus suggests a mechanism for its ion selectivity. Proc Natl Acad Sci USA. 1997;94:11301–11306. doi: 10.1073/pnas.94.21.11301. [DOI] [PMC free article] [PubMed] [Google Scholar]
- Ryckaert JP, Ciccotti G, Berendsen HJC. Numerical integration of the cartesian equations of motion of a system with constraints: molecular dynamics of n-alkanes. J Comput Phys. 1977;23:327–341. [Google Scholar]
- Sattler M, Schleucher J, Griesinger C. Heteronuclear multidimensional NMR experiments for the structure determination of proteins in solution employing pulsed field gradients. Prog Nucl Mag Res Sp. 1999;34:93–158. [Google Scholar]
- Schnell JR, Chou JJ. Structure and mechanism of the M2 proton channel of influenza A virus. Nature. 2008;451:591–595. doi: 10.1038/nature06531. [DOI] [PMC free article] [PubMed] [Google Scholar]
- Sharma M, Yi M, Dong H, Qin H, Peterson E, Busath DD, Zhou HX, Cross TA. Insight into the mechanism of the influenza A proton channel from a structure in a lipid bilayer. Science. 2010;330:509–512. doi: 10.1126/science.1191750. [DOI] [PMC free article] [PubMed] [Google Scholar]
- Stouffer AL, Acharya R, Salom D, Levine AS, Di Costanzo L, Soto CS, Tereshko V, Nanda V, Stayrook S, DeGrado WF. Structural basis for the function and inhibition of an influenza virus proton channel. Nature. 2008;451:596–599. doi: 10.1038/nature06528. [DOI] [PMC free article] [PubMed] [Google Scholar]
- Tang Y, Zaitseva F, Lamb RA, Pinto LH. The gate of the influenza virus M2 proton channel is formed by a single tryptophan residue. J Biol Chem. 2002;277:39880–39886. doi: 10.1074/jbc.M206582200. [DOI] [PubMed] [Google Scholar]
- Thomaston JL, Nguyen PA, Brown EC, Upshur MA, Wang J, DeGrado WF, Howard KP. Detection of drug-induced conformational change of a transmembrane protein in lipid bilayers using site-directed spin labeling. Protein Sci. 2013;22:65–73. doi: 10.1002/pro.2186. [DOI] [PMC free article] [PubMed] [Google Scholar]
- Zhou HX. A theory for the proton transport of the influenza virus M2 protein: extensive test against conductance data. Biophys J. 2011;100:912–921. doi: 10.1016/j.bpj.2011.01.002. [DOI] [PMC free article] [PubMed] [Google Scholar]