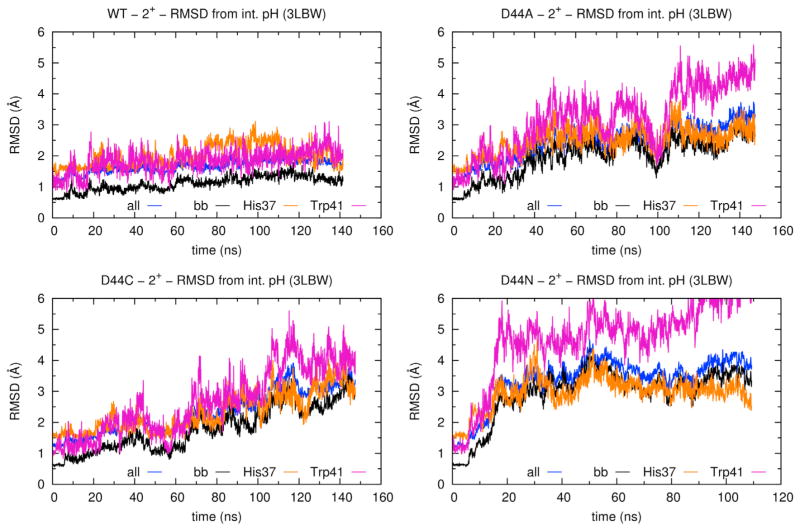
Figure 6. RMSDs of M2TM from the Initial X-Ray Structure.
Rmsds are plotted as a function of time and computed for different subset of atoms: all heavy atoms, except for the mutated side chain at position 44 (blue), all backbone atoms (black), all heavy atoms of the His37 (orange), and Trp41 side chains (purple) (Acharya et al., 2010).

