

Abstract
Purpose
To compare the diagnostic accuracy of the Moorfields Regression Analysis (MRA), parameters, and Glaucoma Probability Score (GPS) from Heidelberg Retinal Tomograph HRT-3 with MRA and parameters from HRT-II in discriminating glaucomatous and healthy eyes in subjects of African (AA) and European ancestry (EA).
Design
case-control, institutional setting.
Methods
78 glaucoma patients (AA=44, EA=34) and 89 age-matched controls (AA=46, EA=33), defined by visual fields and self-reported race were included. Imaging was obtained with HRT-II and data were exported to a computer with the HRT-3 software using the same contour line. Area under Receiver-operating Characteristic [ROC] curves [AUC], sensitivity and specificity were evaluated for whole group, AA and EA separately. Mean disc area was compared between correctly and incorrectly diagnosed eyes by each technique.
Results
Disc, cup and rim areas from HRT3 were lower than HRT-II (P<0.0001). AUC (sensitivity at 95%-specificity) was 0.85 (54%) for vertical cup-to-disc ratio (VCDR) HRT3, 0.84 (45%) for VCDR HRT-II, and 0.81 (44%) for GPS score at temporal sector. MRA-HRT3 showed greater sensitivity but lower specificity than HRT-II for whole group, AA and EA. GPS classification had lowest specificity. Glaucomatous eyes incorrectly classified by GPS had smaller mean disc area (P=0.0002); controls eyes incorrectly classified had greater mean disc area (P=0.015).
Conclusions
VCDR from HRT-3 showed higher sensitivity than HRT-II and GPS for the whole group, and AA and EA separately. Sensitivity of MRA improved in HRT-3 with some tradeoff in specificity compared to MRA of HRT-II. GPS yielded erroneous classification associated to optic disc size.
Introduction
The confocal scanning laser ophthalmoscope (HRT, Heidelberg Engineering, Heidelberg, Germany) obtains topographical imaging of the optic disc and peripapillary retina with high degree of discrimination between healthy and glaucomatous eyes. 1–7 The Moorfields Regression Analysis (MRA) was developed to improve the diagnostic accuracy of the HRT by taking into consideration that neuroretinal rim area is affected by disc area and age, and that the glaucomatous process frequently involves thinning of some sectors of the neuroretinal rim in greater extent than others. Thus, MRA utilizes estimates from global and 6 sectors of the neuroretinal rim area adjusted for optic disc size and age in an effort to improve specificity and it has shown to discriminate glaucomatous and non-glaucomatous eyes with high degree of sensitivity and specificity. 3, 4, 8 A disadvantage of MRA in HRT II is that the normative database used to define the range of normal limits contains only subjects with European ancestry with a limited range of disc area. 3 Previously, we have shown that eyes with larger optic disc area were associated with incorrect diagnosis by MRA, suggesting that subjects with large optic discs and in particular those with African ancestry may be diagnosed incorrectly. 9 Another disadvantage, though of lesser degree, is the need for a trained operator to identify and delineate the border of the optic disc. This introduces some subjectivity to the analysis of topographical measurements. These disadvantages were recently amended in the newer version of the HRT software (HRT 3), which includes an expanded normative database including subjects with European, African and Indian ancestry (Sinai MJ, et al. IOVS 2006; 47: ARVO E-Abstract 4350). HRT 3 also includes an automated, operator-independent classifying procedure of the optic disc (Glaucoma Probability Score [GPS] classification). 10 Recent studies have shown similar to improved discriminatory ability of HRT 3 than HRT II. 11–14 Zelesfky et al. found increased sensitivity in subjects with European and African ancestry using HRT 3. 11 These studies, however, were done with groups of glaucoma patients older than controls, the effect of age was not included, and racial comparisons were not performed. The aims of the study are to compare the diagnostic accuracy of MRA and GPS classifications from HRT 3 with MRA from HRT II, and to compare the diagnostic accuracy of stereometric parameters and GPS scores from HRT 3 with stereometric parameters from HRT II, in glaucoma patients with European and African ancestry and respective age-matched controls.
Methods
Data were obtained from the UAB Optic Nerve Imaging Center database, which consists of functional and imaging data from glaucoma patients and controls subjects enrolled in clinical studies from January 2000 to December 2004. Glaucoma patients were recruited from the UAB Glaucoma Service by chart review and referrals. Controls subjects were university employees and subjects recruited from the general population through advertisement. From 207 glaucoma patients and 167 controls enrolled, 78 glaucoma patients (44 of African ancestry, 34 of European ancestry) were selected on the basis of inclusion criteria (described below). Eighty-nine controls (51 of African ancestry, 38 of European ancestry) were selected, matched by age (±1 year) to glaucoma patients. The Institutional Review Board at the University of Alabama at Birmingham approved all protocols, and all methodology adhered to the tenets of the Declaration of Helsinki and HIPAA regulations.
Each participant underwent a comprehensive ophthalmic examination, including review of medical history, best corrected visual acuity (BCVA), slit-lamp biomicroscopy, Goldmann applanation tonometry, gonioscopy, dilated fundus examination, simultaneous stereoscopic optic disc photography (Nidek 3 Dx Fundus camera, Nidek technology America, Inc., Greensboro, NC, USA), standard automated perimetry (SAP) using SITA 24-2 strategy (Humphrey Field Analyzer II, Carl Zeiss Meditec, Dublin, CA), and CSLO imaging (HRT II). All tests and imaging were obtained within 4 to 6 weeks. Racial groups were defined by self-description. One eye was randomly selected for inclusion in the study.
Participants were required to have an open angle, BCVA of 20/40 or better, spherical refraction within ±5.0 diopters and cylinder correction within ±3.0 diopters. Subjects were excluded if they had a history of intraocular surgery (except uncomplicated cataract surgery), visually significant cataracts, problems affecting color vision other than glaucoma, use of medication known to affect visual sensitivity at the time of visual field testing, and co-morbid condition affecting visual function. Control subjects were required to have intraocular pressure (IOP) less than 22 mmHg, no past history of increased IOP, no family history of glaucoma, confirmed normal bilateral SAP-SITA, and a bilateral normal eye examination. Glaucoma patients were required to have a reliable glaucomatous SAP-SITA, defined as either Glaucoma Hemifield Test (GHT) outside of the 99% normal limits or a Pattern Standard Deviation (PSD) outside of the 95% normal limits, and at least one cluster of three or more test points outside 95% confidence interval (CI) in the pattern deviation probability plot, without crossing the horizontal hemifield. One fellowship-trained glaucoma specialist (CAG, JDL-O, BEM) verified that visual field defects were consistent with glaucoma and visual fields were confirmed twice. A reliable SAP-SITA was defined as an exam with less than 33% of fixation losses, false positive and false negative responses.
Details of the CSLO (HRT II) have been described previously. 15, 16 While pupil dilation is often not required, all subjects were imaged after full dilation. Any of the following were exclusion criteria for HRT II images: if acquisition sensitivity was greater than 89%, a standard deviation greater than 39 in the computed topography, the optic nerve head was not centered, excessive eye movement occurred during the acquisition movie, floaters were present over or adjacent to the disc, or if poor clarity or framing were present. Images from 31 subjects were excluded for inadequate quality.
An experienced operator (JDL-O, SNA) evaluated the image quality and outlined the disc margin while viewing stereophotographs of the optic disc, masked to the patient diagnosis. Five subjects were excluded because of poor quality in the stereophotograph. The operating software of HRT II provided several biometric parameters and the results of the MRA HRT II. After obtaining HRT II results, we exported all HRT II scans with theirs respective contour lines to a personal computer with the HRT 3 software. After selecting the appropriate racial database for each participant, HRT 3 software analysis was performed and stereometric parameters and MRA results were obtained (MRA HRT 3). In addition, HRT 3 provided the following automated, operator-independent test results: 1) a global and sectorial glaucoma probability score (continuous variable) and 2) GPS classification (nominal variable). Details of GPS have been described before. 13 The software automatically builds a 3-D model of the optic disc and peripapillary RNFL and analyzes it using a neural network technique.
The MRA compares rim and disc area globally and for each one of six predetermined sector with a normal database, corrected for global and sectorial disc area. 3 The results from MRA are “within normal limits” if the rim area from the subject’s eye is larger than or equal to the 95% prediction interval based on a distribution found in a group of normal subjects, “borderline” if the rim area is between the 95% and the 99.9% prediction interval, and “outside normal limits” if the rim area is less than the 99.9% prediction limit. Similarly to the MRA classification, GPS classification results can be “within normal limits”, “borderline”, or “outside normal limits” compared to a normative database. In the present study, MRA-Result and GPS-Result of “borderline” or “outside normal limits” were considered abnormal.17
Two-tailed t-tests were used to compare glaucomatous eyes and normal eyes, and racial groups with respect to continuous variables with normal distribution on the basis of histograms. Nonparametric (Wilcoxson) tests were used otherwise. Similar group comparisons were conducted for categorical variables using chi-square tests. Paired t-tests were used to compare stereometric parameters between HRT II and HRT 3. Receiver-Operating Characteristic (ROC) plots were constructed for stereometric parameter from each technique (HRT II, HRT 3, and GPS) and areas under ROC curves (AUC) using the best performing parameter were compared as suggested by DeLong et al. 18, 19 Furthermore, sensitivity and specificity were calculated for the MRA HRT II, MRA HRT 3, and GPS classifications, and sensitivity at 95% of specificity was compared among these techniques using the McNemar test. Simple kappa statistic was used to evaluate agreement between HRT classification techniques with SAP-SITA. The strength of agreement with kappa values were interpreted as follows: 0.0 = no agreement, < 0.40 = fair agreement, 0.40 to 0.59 = moderate agreement, 0.60 to 0.75 = good agreement, >0.75 to 0.99 = excellent agreement, 1.0 = perfect agreement. ANOVA was used to compare disc areas between eyes correctly and incorrectly diagnosed by each classification technique. Alpha level was set to 0.05. Statistical analyses were done using JMP v 5.0.1(SAS Institute Inc, Cary, NC) and MedCalc v 9.0 (MedCalc Software, Belgium).
Results
Demographics and ocular characteristics of the study sample are shown in Table 1. A total of 167 subjects were included in the analysis (78 subjects with glaucoma and 89 controls). The range of SAP-SITA mean deviation was 1.5 to −13.8 decibels (median −2.9, central 90% between −0.2 to −9.8). Differences were found between HRT II and HRT 3 stereometric parameters, specifically for global disc, cup and rim areas. Values were significantly lower with HRT 3 than HRT II for the whole group (Table 2). Similar results were obtained when data was stratified by race, that is, lower parameter values of disc, cup and disc area obtained with HRT 3 than HRT II for the African ancestry and European ancestry groups separately (data not shown). No differences between techniques were found for ratios (cup-to-disc area, vertical and horizontal cup-to-disc ratios). Bland-Altman plot shows proportional bias between two methods (Fig. 1).
Table 1.
Demographic and ocular characteristics of study sample.
| Glaucoma (n = 78)
|
Controls (n = 89)
|
P value*
|
|||||
|---|---|---|---|---|---|---|---|
| African ancestry | European ancestry | P value | African ancestry | European ancestry | P value | ||
|
|
|||||||
| Eyes, number | 44 | 34 | NA | 51 | 38 | NA | NA |
| Age, years | 49.5 (9.8) | 49.4 (7.2) | 0.942† | 47.3 (9.5) | 47.5 (8.8) | 0.927† | 0.139† |
| Gender, number (% female) | 33 (75%) | 18 (53%) | 0.056‡ | 37 (73%) | 22 (58%) | 0.177‡ | 0.613‡ |
| IOP, mmHg | 17.1 (3.8) | 17.9 (5.5) | 0.457† | 15.9 (2.7) | 15.1 (2.5) | 0.130† | 0.002 |
| MD, decibels | −3.6 (3.6) | −3.3 (3.2) | 0.702§ | 0.2 (1.1) | 0.5 (1.0) | 0.125§ | <0.0001§ |
| MD range | 1.5 to −13.6 | 1.7 to −13.8 | NA | 2.6 to −3.5 | 2.5 to −1.9 | NA | NA |
| PSD | 4.3 (3.1) | 4.1 (3.1) | 0.727§ | 1.6 (0.5) | 1.4 (0.5) | 0.156§ | <0.0001§ |
| Disk area, mm2 (HRT3) | 2.37 (0.4) | 2.09 (0.5) | 0.007 | 2.2 (0.4) | 1.9 (0.4) | 0.044 | 0.030 |
Continuous variables are expressed as mean (1 standard deviation in parenthesis).
Categorical variables are expressed as percentage.
NA = not applicable
P values are from comparisons between glaucoma patients with controls subjects. Significant P values in bold.
t-test.
Chi-Square test.
Wilcoxon test.
IOP = intraocular pressure
MD = mean defect
PSD = Pattern Standard Deviation
Table 2.
Stereometric parameters of 167 participants determined by HRT II and HRT3 software on the same CSLO scans using the same contour lines.
| HRT II | HRT 3 | P value* | |
|---|---|---|---|
| Disc area, mm2 | 2.25 (0.5) | 2.16 (0.5) | <0.0001 |
| Cup area, mm2 | 0.71 (0.5) | 0.68 (0.4) | <0.0001 |
| Rim area, mm2 | 1.54 (0.4) | 1.48 (0.4) | <0.0001 |
| Cup-to-disc area ratio | 0.30 (0.2) | 0.30 (0.2) | 0.457 |
| Vertical cup-to-disc ratio | 0.43 (0.2) | 0.43 (0.2) | 0.230 |
| Horizontal cup-to-disc ratio | 0.53 (0.2) | 0.53 (0.2) | 0.782 |
CSLO – confocal scanning laser ophthalmoscope.
Continuous variables are expressed as mean (1standard deviation)
Paired t-test.
Figure 1.

Average of disc area measured with HRT II and HRT 3 plotted against difference in disc area measured by these two techniques (Bland-Altman plot).
GPS failed in analyzing the optic disc in 20 subjects because of incompatibilities with modeling the optic disc shape. Complete incompatibility was found in 14 subjects (excluded from the present study); partial incompatibility was seen in 6 subjects in whom only global GPS score and global classification were reported. The distribution of these 6 eyes based on diagnostic and racial group was a follows: 2 eyes with glaucoma and AA ancestry, 1 eye with glaucoma and European ancestry, 1 control eye with African ancestry, and 2 controls eyes with European ancestry. As global GPS results were obtained, these eyes were included in the analysis.
The best discriminating parameter based on ROC curves and area under these curves (AUC) was vertical cup-to-disc ratio for HRT II and HRT 3, and the score at the temporal sector for GPS. For the whole group, vertical cup-to-disc ratio from HRT 3 showed borderline greater AUC and significantly greater sensitivity at 95%-specificity than HRT II (P = 0.061, P = 0.013 for AUC and sensitivity comparisons, respectively, Fig. 2). Vertical cup-to-disc ratio from HRT 3 showed borderline greater AUC and sensitivity than GPS score at the temporal sector (P = 0.059, P = 0.064 for AUC and sensitivity comparisons, respectively). No differences were found between HRT II and GPS (P = 0.15, P = 1.0 for AUC and sensitivity comparisons, respectively). The African ancestry cohort showed higher AUC and sensitivity than the European ancestry for HRT II and HRT 3. Sensitivity of GPS score was comparable across race cohorts, but lower than for vertical cup-to-disc ratios. Additionally, AUC for GPS was lower for the European ancestry cohort than the African ancestry. For the African ancestry cohort, HRT 3 vertical cup-to-disc ratio showed higher sensitivity than GPS score (P = 0.016); no differences in sensitivity at 95% specificity were found between vertical cup-to-disc ratio from HRT II and HRT 3, and between HRT II and GPS score. For the European ancestry cohort, vertical cup-to-disc ratio form HRT 3 showed greater AUC than HRT II and GPS (P = 0.003 and P = 0.035, for HRT II vs. HRT 3 and HRT 3 vs. GPS, respectively). No differences were found in sensitivities between these three techniques (P = 0.63, P = 1.0, and P = 0.6 for HRT II vs. HRT 3, HRT II vs. GPS, and HRT 3 vs. GPS, respectively).
Figure 2.
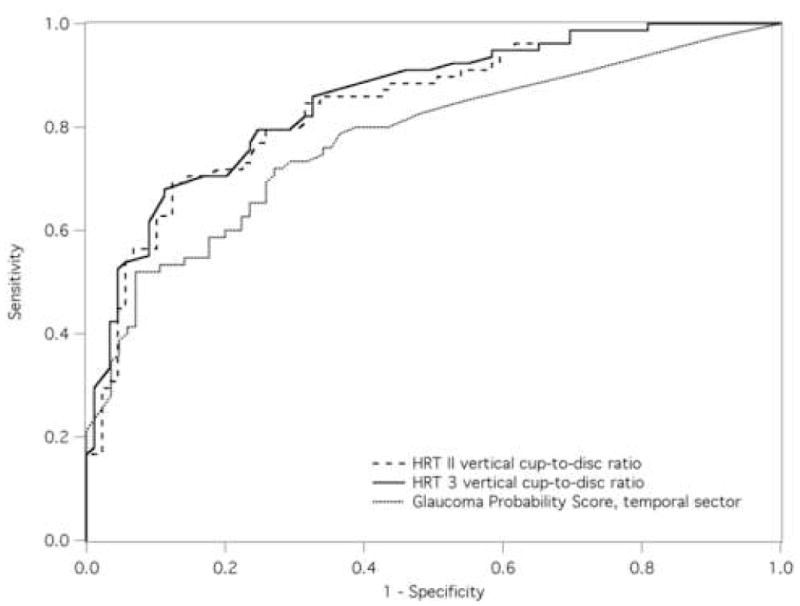
Receiver-operator characteristic (ROC) plots were constructed for stereometric parameters from HRT II and HRT 3, and for GPS scores. On the basis of area under ROC curves (AUC), the best discriminating parameter was selected from each technique and comparisons of AUC between parameter were investigated.
Higher sensitivity was observed for MRA classification from HRT 3 than HRT-II, with some reduction in specificity (Table 4) for the whole group, and for the African and European ancestry cohorts. European ancestry showed the greatest increase in sensitivity with greatest decline in specificity. In contrast, specificity of GPS classification was consistently lower than any MRA classification, for the whole group and for race-specific groups.
Table 4.
Sensitivity, specificity, and agreement with visual field results Moorfields Classification (MRA-HRT II and MRA-HRT 3), and Glaucoma Probability Score classification (GPS) for the total study group (78 glaucoma and 89 control), and separately, for African and European descent subjects.
| Sensitivity
|
Specificity
|
Agreement with VF result
|
|||
|---|---|---|---|---|---|
| Percentage | 95% CI | Percentage | 95% CI | Kappa (SE) | |
| Whole Study Group (N = 157) | |||||
| MRA-HRTII Result 95% CI | 62% | 50 to 72 | 92% | 85 to 97 | 0.55 (0.1) |
| MRA-HRT3 Result 95% CI | 77% | 66 to 86 | 83% | 74 to 90 | 0.61 (0.1) |
| GPS 95% CI | 71% | 60 to 81 | 73% | 63 to 82 | 0.44 (0.1) |
| African Ancestry (N = 95) | |||||
| MRA-HRTII Result 95% CI | 64% | 48 to 77 | 94% | 84 to 99 | 0.60 (0.1) |
| MRA-HRT3 Result 95% CI | 75% | 60 to 87 | 88% | 76 to 96 | 0.64 (0.1) |
| GPS 95% CI | 70% | 54 to 83 | 84% | 71 to 93 | 0.55 (0.1) |
| European Ancestry (N = 72) | |||||
| MRA-HRTII Result 95% CI | 59% | 41 to 75 | 90% | 75 to 97 | 0.49 (0.1) |
| MRA-HRT3 Result 95% CI | 79% | 62 to 91 | 76% | 60 to 88 | 0.56 (0.1) |
| GPS 95% CI | 74% | 56 to 87 | 58% | 40 to 73 | 0.31 (0.1) |
MRA Result = abnormal if any regional parameter falls outside of the confidence limits 95% CI = results using the 95% confidence interval (CI) cutoff; SE = standard error.
Agreement between MRA and SAP-SITA was consistently greater for MRA from HRT 3 than HRT II, and agreements were greater with any MRA classifications than with GPS classification (Table 4). While HRT 3 showed good agreement and HRT II showed moderate agreement, GPS classification showed fair agreement with SAP-SITA. Furthermore, most of the glaucomatous eyes were identified by any of the three techniques (MRA from HRT II and HRT 3, and GPS); a greater number of control eyes were misclassified by GPS than the MRA from HRT II and HRT 3 (Fig. 3). Furthermore, no technique correctly identified all eyes, as 12 glaucomatous eyes were classified as non-glaucomatous by all three techniques, and 5 controls eyes were classified as glaucomatous.
Figure 3.

Venn diagrams depicting agreement between the three different HRT techniques in correctly classifying glaucomatous (Top) and non-glaucomatous eyes (Bottom). Note that none of the three techniques correctly classified all eyes, as 12 glaucomatous eyes (*) were classified as non-glaucomatous and 5 controls eyes (+) were classified as glaucoma. Additionally, the greatest proportion of misclassifications occurred in the control group by GPS; which classified 15 controls eyes as glaucomatous.
Mean disc area was compared between subjects correctly and incorrectly diagnosed by MRA (HRT II and HRT 3) and by GPS classification in the glaucoma and control group separately. No differences were found in disc area between correctly and incorrectly diagnosed by MRA (HRT II and HRT 3, Table 5), except for greater disc area in eyes incorrectly classified by MRA for HRT II in the African ancestry control group (P = 0.045). Eyes that were incorrectly diagnosed by GPS in the glaucoma group had smaller disc area; eyes that were incorrectly diagnosed in the control group had greater disc area. Analysis by racial groups yielded similar results (Table 5).
Table 5.
Disk area measured by HRT 3 software of the 78 glaucomatous and 89 normal control eyes correctly and incorrectly diagnosed by HRT II Moorfields Regression Analysis Classification using 95% CI cutoff (MRA-HRT II 95%), HRT3 Moorfields Classification using 95% CI cutoff (MRA-HRT3 95%), and HRT 3 GPS using 95% CI cutoff (GPS 95%).
| Disc Area (mm2) in the Glaucoma Group (N = 78) | Disc Area (mm2) in the Control Group (N = 89) | |||||
|---|---|---|---|---|---|---|
|
| ||||||
| Correctly diagnosed | Incorrectly diagnosed | P value* | Correctly diagnosed | Incorrectly diagnosed | P value* | |
| WHOLE GROUP | ||||||
| MRA-HRTII 95% | 2.29 (0.4) | 2.16 (0.5) | 0.231 | 2.08 (0.4) | 2.37 (0.8) | 0.084 |
| MRA-HRT3 95% | 2.24 (0.5) | 2.27 (0.5) | 0.811 | 2.10 (0.4) | 2.13 (0.6) | 0.818 |
| GPS 95% | 2.37 (0.4) | 1.95 (0.5) | 0.0002 | 2.03 (0.4) | 2.29 (0.5) | 0.015 |
| AFRICAN ANCESTRY | ||||||
| MRA-HRTII 95% | 2.40 (0.4) | 2.30 (0.5) | 0.468 | 2.15 (0.4) | 2.65 (0.8) | 0.045 |
| MRA-HRT3 95% | 2.35 (0.4) | 2.4 (0.5) | 0.729 | 2.17 (0.4) | 2.25 (0.9) | 0.678 |
| GPS 95% | 2.48 (0.4) | 2.13 (0.4) | 0.027 | 2.12 (0.4) | 2.49 (0.5) | 0.024 |
| EUROPEAN ANCESTRY | ||||||
| MRA-HRTII 95% | 2.14 (0.4) | 2.00 (0.5) | 0.405 | 1.97 (0.4) | 2.17 (0.5) | 0.413 |
| MRA-HRT3 95% | 2.09 (0.4) | 2.05 (0.6) | 0.822 | 1.98 (0.4) | 2.04 (0.5) | 0.708 |
| GPS 95% | 2.23 (0.4) | 1.68 (0.4) | 0.002 | 1.86 (0.4) | 2.18 (0.4) | 0.020 |
Analysis of Variance (significant P value in bold)
Shown data are mean (1 standard deviation)
Discussion
Modifications in HRT 3 software had an effect on stereometric parameters and MRA. The optic disc area was significantly smaller with HRT 3 software than HRT II, despite using the same contour line. This is due to a change in the horizontal scaling implemented in the HRT 3 software (Sinai MJ, Heidelberg Engineering, personal communication, June 2006). Consequently, rim and cup area values were also smaller with the HRT 3. Increased sensitivity was observed for the best stereometric parameter (vertical cup-to-disc ratio) with HRT 3 than HRT II (53.9 % and 44.9%, respectively); and this sensitivity was greater than that reported in a prior data (45%) at the same level of 95% specificity.6
For the overall group, the MRA classification of the HRT 3 showed improved sensitivity, although with loss of some specificity compared with HRT II. Additionally, MRA from HRT 3 showed greater agreement with SAP-SITA than HRT II and GPS. These findings are similar with prior reports. 11, 12 Zelefsky et al. found no differences between HRT II and HRT 3 MRA in African and European ancestry groups. However, the authors found greater variation in sensitivity and specificity for subjects of African ancestry. 11 Our results differed from those of Zelefsky et al. in that greater variation of sensitivity/specificity was found in European ancestry group in the present cohort. 11
MRA discriminating performance for the overall group showed similar sensitivity and specificity to the study of Ford et al. (78% and 81%, respectively), which used similar cutoff criteria as in the present study (MRA-result outside 95% CI considered test positive). 20 Comparisons of our results with other studies of MRA diagnostic performance by Wollstein et al. and Miglior et al. are difficult because of differences in cutoff criteria between the present study and these prior studies.3, 8 In the present study, sensitivity of MRA HRT 3 (at 95% CI) was similar and specificity was lower than MRA HRT II reported by Miglior et al. at 99% CI (74%, 94%, for sensitivity and specificity, respectively).8 In contrast, our results of sensitivity and specificity of MRA HRT 3 were lower than those reported by Wollstein et al. at 99% CI (84%, 96%, respectively), but these higher sensitivity/specificity values in the latter study may be due to the inclusion of controls that also made up the normative data used to develop the MRA.3
The GPS automated classification (nominal) showed similar sensitivity but considerable lower specificity than MRA (HRT 3) for the whole group and for each racial group. The best GPS score (continuous) on the basis of AUC showed comparable sensitivity than vertical cup-to-disc ratio of HRT II at the same level of specificity (95%), but was lower than HRT 3 vertical cup-to-disc ratio. GPS classification also had the lowest agreement with visual field. Furthermore, GPS produced no classifying results in 14 subjects out of 338 because GPS model was not compatible with the shape of the optic disc in these subjects, which could not be included in the present study. Meanwhile, 6 additional eyes had poor compatibility reporting only global results because the GPS model was only partially compatible with the shape of the optic disc in these 6 subjects. We observed that most of the non-glaucomatous eyes with poor compatibility had a small optic disc, and most of the glaucomatous eyes had a large, shallow optic disc cup configuration. Thus, disc size and shape had an effect on the usefulness of GPS automated classification, which is in agreement with previous data. 13 Eyes with glaucoma with a smaller optic disc were misclassified with the GPS, while in eyes without glaucoma misclassification was associated with a larger optic disc, occurring more frequently in eyes of African ancestry.
In conclusion, improvement was found in the diagnostic ability of MRA-result using HRT 3 software compared to its predecessor. In addition, the GPS automated classification showed similar sensitivity but a considerable lower specificity than MRA. The diagnostic efficacy of the GPS was associated with variations in disc area. Developing modeling techniques specifically trained for large and small optic disc may improve the proportion of eyes correctly diagnosed and reliable modeled by GPS technique.
Table 3.
Area under Receiver-Operating Characteristic curve and sensitivity at fixed specificity (95%) for the best performing parameter with the HRT II, HRT3, and GPS for African ancestry, European ancestry, and Whole study groups.
| African ancestry (n = 95)
|
European ancestry (n = 72)
|
Whole Group (n = 167)
|
|||||||
|---|---|---|---|---|---|---|---|---|---|
| AUC (95% CI) | SE | Sensitivity at 95% specificity | AUC (95% CI) | SE | Sensitivity at 95% specificity | AUC (95% CI) | SE | Sensitivity at 95% specificity | |
| HRT II VCDR | 0.861 (0.775 to 0.924) | 0.04 | 59.1% | 0.818 (0.709 to 0.899) | 0.05 | 47.1% | 0.843 (0.780 to 0.902) | 0.03 | 44.9% |
| HRT3 VCDR | 0.860 (0.774 to 0.923) | 0.04 | 56.8% | 0.847 (0.742 to 0.921) | 0.04 | 50.0% | 0.854 (0.797 to 0.913) | 0.03 | 53.9% |
| HRT3 GPS Temporal | 0.833 (0.740 to 0.903) | 0.04 | 47.6% | 0.741 (0.621 to 0.839) | 0.06 | 45.5% | 0.813 (0.731 to 0.868) | 0.04 | 44.0% |
AUC = area under ROC curve
VCDR = vertical cup-to-disc ratio
GPS = glaucoma probability score
Acknowledgments
Funding/Support: Eyesight Foundation of Alabama (Julio De León-Ortega, MD, PhD and Christopher A. Girkin, MD MSPH), National Eye Institute K23-EY 13959-0 and U10-EY 14267 (Christopher A. Girkin, MD MSPH), National Eye Institute R21-EY14071 (Gerald McGwin), and Lisandro M Sakata (none), Blythe E. Monheit (none), and Stella N. Arthur (none).
Biography

Julio E. De León Ortega, MD, PhD joined faculty at the Department of Ophthalmology as clinical instructor, University of Alabama at Birmingham (UAB). He obtained his medical degree from the School of Medicine at the Francisco Marroquín University in Guatemala, and completed his ophthalmology residency at The Hospital Juárez of México, a program accredited by The National Autonomous University of México. He completed a fellowship in glaucoma at Department of Ophthalmology and a Ph.D. degree from the Vision Sciences program, both at UAB. Dr. De León Ortega’s research interests focus on developing and testing diagnostic methods of function and structure of the central field to better quantify the extent glaucomatous damage in patients with advanced disease, and to develop population-based studies of glaucoma in Guatemala.
Footnotes
Presented in part at the annual meeting of the Association for Research in Vision and Ophthalmology, Fort Lauderdale, Florida, May 2006
Disclosure
Financial Disclosure: Christopher A. Girkin is consultant for Carl Zeiss Meditec. The rest of the authors had no commercial interest.
Contribution of authors: design and conduct of the study (CAG, JDL-O, LMS); collection of data (JDL-O, SNA, LMS, BEM), management, analysis, and interpretation of data (JDL-O, CAG), preparation and review of manuscript (LMS, JDL-O, CAG, BEM); and approval of manuscript (JDO-L, CAG).
Statement about conformity with Author Information: The Institutional Review Board at the University of Alabama at Birmingham approved all protocols, and all methodology adhered to the tenets of the Declaration of Helsinki and HIPAA regulations.
Publisher's Disclaimer: This is a PDF file of an unedited manuscript that has been accepted for publication. As a service to our customers we are providing this early version of the manuscript. The manuscript will undergo copyediting, typesetting, and review of the resulting proof before it is published in its final citable form. Please note that during the production process errors may be discovered which could affect the content, and all legal disclaimers that apply to the journal pertain.
References
- 1.Caprioli J, Park HJ, Ugurlu S, Hoffman D. Slope of the peripapillary nerve fiber layer surface in glaucoma. Invest Ophthalmol Vis Sci. 1998;39:2321–8. [PubMed] [Google Scholar]
- 2.Miglior S, Casula M, Guareschi M, Marchetti I, Iester M, Orzalesi N. Clinical ability of Heidelberg retinal tomograph examination to detect glaucomatous visual field changes. Ophthalmology. 2001;108:1621–7. doi: 10.1016/s0161-6420(01)00676-5. [DOI] [PubMed] [Google Scholar]
- 3.Wollstein G, Garway-Heath DF, Hitchings RA. Identification of early glaucoma cases with the scanning laser ophthalmoscope. Ophthalmology. 1998;105:1557–63. doi: 10.1016/S0161-6420(98)98047-2. [DOI] [PubMed] [Google Scholar]
- 4.Wollstein G, Garway-Heath DF, Fontana L, Hitchings RA. Identifying early glaucomatous changes. Comparison between expert clinical assessment of optic disc photographs and confocal scanning ophthalmoscopy. Ophthalmology. 2000;107:2272–7. doi: 10.1016/s0161-6420(00)00363-8. [DOI] [PubMed] [Google Scholar]
- 5.Zangwill LM, Bowd C, Berry CC, et al. Discriminating between normal and glaucomatous eyes using the Heidelberg Retina Tomograph, GDx Nerve Fiber Analyzer, and Optical Coherence Tomograph. Arch Ophthalmol. 2001;119:985–93. doi: 10.1001/archopht.119.7.985. [DOI] [PubMed] [Google Scholar]
- 6.Medeiros FA, Zangwill LM, Bowd C, Weinreb RN. Comparison of the GDx VCC scanning laser polarimeter, HRT II confocal scanning laser ophthalmoscope, and stratus OCT optical coherence tomograph for the detection of glaucoma. Arch Ophthalmol. 2004;122:827–37. doi: 10.1001/archopht.122.6.827. [DOI] [PubMed] [Google Scholar]
- 7.De Leon-Ortega JE, Arthur SN, McGwin G, Jr, Xie A, Monheit BE, Girkin CA. Discrimination between glaucomatous and nonglaucomatous eyes using quantitative imaging devices and subjective optic nerve head assessment. Invest Ophthalmol Vis Sci. 2006;47:3374–80. doi: 10.1167/iovs.05-1239. [DOI] [PMC free article] [PubMed] [Google Scholar]
- 8.Miglior S, Guareschi M, Albe E, Gomarasca S, Vavassori M, Orzalesi N. Detection of glaucomatous visual field changes using the Moorfields regression analysis of the Heidelberg retina tomograph. Am J Ophthalmol. 2003;136:26–33. doi: 10.1016/s0002-9394(03)00084-9. [DOI] [PubMed] [Google Scholar]
- 9.Girkin CA, DeLeon-Ortega JE, Xie A, McGwin G, Arthur SN, Monheit BE. Comparison of the Moorfields classification using confocal scanning laser ophthalmoscopy and subjective optic disc classification in detecting glaucoma in blacks and whites. Ophthalmology. 2006;113:2144–9. doi: 10.1016/j.ophtha.2006.06.035. [DOI] [PubMed] [Google Scholar]
- 10.Swindale NV, Stjepanovic G, Chin A, Mikelberg FS. Automated analysis of normal and glaucomatous optic nerve head topography images. Invest Ophthalmol Vis Sci. 2000;41:1730–42. [PubMed] [Google Scholar]
- 11.Zelefsky JR, Harizman N, Mora R, et al. Assessment of a race-specific normative HRT-III database to differentiate glaucomatous from normal eyes. J Glaucoma. 2006;15:548–51. doi: 10.1097/01.ijg.0000212289.00917.a8. [DOI] [PubMed] [Google Scholar]
- 12.Harizman N, Zelefsky JR, Ilitchev E, Tello C, Ritch R, Liebmann JM. Detection of glaucoma using operator-dependent versus operator-independent classification in the Heidelberg retinal tomograph-III. Br J Ophthalmol. 2006;90:1390–2. doi: 10.1136/bjo.2006.098111. [DOI] [PMC free article] [PubMed] [Google Scholar]
- 13.Coops A, Henson DB, Kwartz AJ, Artes PH. Automated analysis of heidelberg retina tomograph optic disc images by glaucoma probability score. Invest Ophthalmol Vis Sci. 2006;47:5348–55. doi: 10.1167/iovs.06-0579. [DOI] [PubMed] [Google Scholar]
- 14.Burgansky-Eliash Z, Wollstein G, Bilonick RA, Ishikawa H, Kagemann L, Schuman JS. Glaucoma Detection with the Heidelberg Retina Tomograph 3. Ophthalmology. 2007;114:466–471. doi: 10.1016/j.ophtha.2006.08.022. [DOI] [PMC free article] [PubMed] [Google Scholar]
- 15.Chauhan BC, Blanchard JW, Hamilton DC, LeBlanc RP. Technique for detecting serial topographic changes in the optic disc and peripapillary retina using scanning laser tomography. Invest Ophthalmol Vis Sci. 2000;41:775–82. [PubMed] [Google Scholar]
- 16.Stein DM, Wollstein G, Schuman JS. Imaging in glaucoma. Ophthalmol Clin North Am. 2004;17:33–52. doi: 10.1016/S0896-1549(03)00102-0. [DOI] [PMC free article] [PubMed] [Google Scholar]
- 17.Stamper RL. Glaucoma screening. J Glaucoma. 1998;7:149–50. [PubMed] [Google Scholar]
- 18.DeLong ER, DeLong DM, Clarke-Pearson DL. Comparing the areas under two or more correlated receiver operating characteristic curves: a nonparametric approach. Biometrics. 1988;44:837–45. [PubMed] [Google Scholar]
- 19.Zweig MH, Campbell G. Receiver-operating characteristic (ROC) plots: a fundamental evaluation tool in clinical medicine. Clin Chem. 1993;39:561–77. [PubMed] [Google Scholar]
- 20.Ford BA, Artes PH, McCormick TA, Nicolela MT, LeBlanc RP, Chauhan BC. Comparison of data analysis tools for detection of glaucoma with the Heidelberg Retina Tomograph. Ophthalmology. 2003;110:1145–50. doi: 10.1016/S0161-6420(03)00230-6. [DOI] [PubMed] [Google Scholar]