Abstract
We present a multiplex method, based on microscopic programmable magnetic traps in zigzag wires patterned on a platform, to simultaneously apply directed forces on multiple fluid-borne cells or biologically inert magnetic micro-/nano-particles. The gentle tunable forces do not produce damage and retain cell viability. The technique is demonstrated with T-lymphocyte cells remotely manipulated (a la joystick) along desired trajectories on a silicon surface with average speeds up to 20 μm/s.
Precise manipulation to probe, sort or assemble individual cells or bio-molecules is of great fundamental and practical interest [1-4]. While methods such as those based on atomic force microscopy [5-8], optical- [9-12] and magnetic-tweezers [13, 14] can manipulate single biological entities with remarkable accuracy, these methods have generally not demonstrated sufficient flexibility and throughput required for widespread adoption. A multiplex approach that would maximize efficiency by applying forces only on targeted individual fluid borne biological entities will have many advantages. In addition to providing more accurate information than data averaging a population of cells, such rapid manipulation techniques could also be developed for “on-chip” platforms with small volumes of cell samples at low cost [15]. Dynamic control over picoNewton (pN) scale forces also extends to manipulating inert micro- and nano-particles providing, for example, a template to promote large scale self-assembly [16].
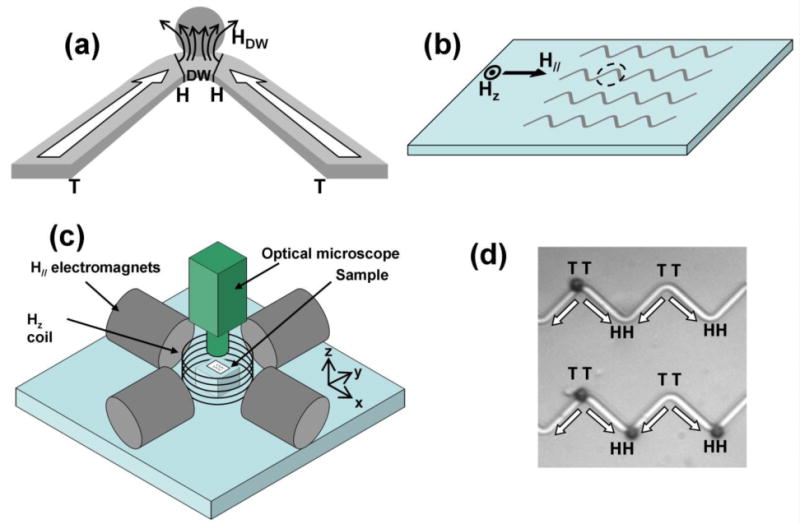
In this study we utilize highly localized, permanent magnetic field gradients at the vertices of ferromagnetic zigzag wires patterned on a surface (Fig. 1a) to assemble labeled cells or microspheres onto designed arrays. By combining this platform with externally controlled weak (∼60 Oe) fields, programmable directed forces that are gentle enough to not produce damage transport cells across surfaces.
Figure 1.

(a) Schematic of a rectangular zigzag wire with a head-to-head (HH) domain wall (DW) at the vertex, associated field HDW, and a trapped magnetic particle (gray circle). (b) Array of zigzag wires patterned on platform with perpendicular (Hz) and in-plane (H//) magnetic fields. Sketch in (a) is an enlarged view of the dotted circle around a vertex. (c) Schematic of electromagnets and coil to create H// and Hz. Cell movement observed by optical microscope (Reichert) with 20× objective lens and high speed camera. (d) Image of superparamagnetic spheres (2.8 μm diameter, dark circles) selectively attracted from solution and trapped only at HH and TT (tail-to-tail) domain walls under no external fields. The FeCo wires patterned on Si are 2 μm wide, 40 nm thick with 16 μm between adjacent vertices.
Central aspects of this study are demonstrated by remotely manipulating (joystick) individual or multiple T-lymphocyte cells on a silicon surface. The two dimensionality of the platform eases lithographic creation of wire arrays, scale-up to prototypes, and real-time observation with a standard microscope. With symmetries and architecture determined by present nanoscale fabrication techniques, trap arrays with large areal density can be created and integrated into microfluidic devices. The versatility of this approach is further evident when the position of the local magnetic energy minimum is maneuvered away from the wires, and magnetic forces suppress Brownian motion associated with fluid-borne objects.
Fig. 1 illustrates key aspects of the platform: a set of zigzag Fe0.5Co0.5 wires with stationary domain walls (DW) [17] located at wire turns (Fig. 1a and 1b); the externally applied tuning magnetic fields (Fig. 1c); and magnetic microspheres selectively trapped at the DWs (Fig. 1d). Wires of rectangular cross-section were patterned by standard electron-beam writing on a Si substrate followed by sputter deposition of a Fe0.5Co0.5 film and liftoff. Head-to-head (HH) and tail-to-tail (TT) domain walls (Fig. 1a) are created at neighboring vertices by a momentary in-plane external field (∼1 kOe) [18]. The localized trapping fields at the wire vertices are evident upon dispensing a solution of Dynabeads M-280 magnetic microspheres (from Invitrogen) on the platform. As shown in Fig. 1d the spheres are attracted to and trapped only at the HH and TT domain walls.
To estimate the strength and tunability of the traps we consider a wire of rectangular cross section with width w = 1 μm and thickness t = 40 nm supporting a HH wall. For this model we consider the DW to have an associated “magnetic charge” of 2wtMS [19], where MS is the saturation magnetization of Fe0.5Co0.5. The magnetic charge is considered to be concentrated at a point yielding an associated magnetic field HDW(x) [19]. Stray fields from other configurations as Bloch walls [20] or domain tips [21] on garnet films have been used for magnetic particle manipulation. Microcoils [22] and permanent magnets [23] have also provided trapping fields. The force F = (x02207)(m·B), where m is the magnetic dipole moment of a single superparamagnetic bead in a magnetic field B. As discussed below, programmable forces relevant to single cell manipulation in the 10-1 pN ≤ |F| ≤ 103 pN ranges are realized. The net field in the presence of external in-plane (H//) and perpendicular (Hz) magnetic fields (Fig. 1b) is given by H = HDW + H// + Hz. For the low values of H// and Hz in this study, the domain walls remain immobile.
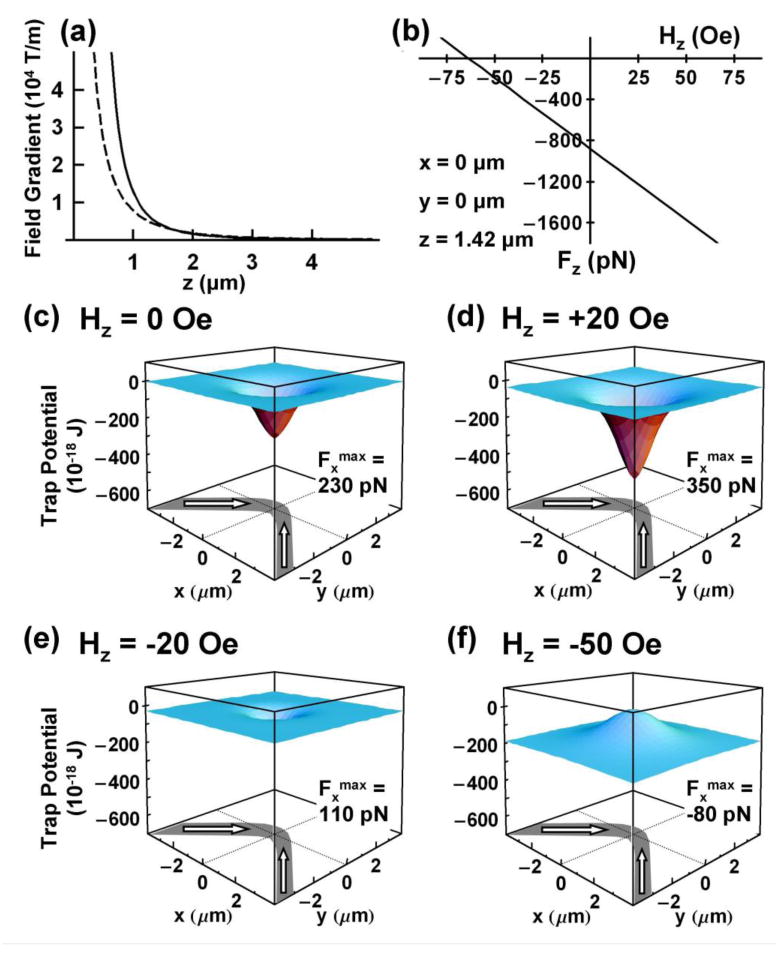
Fig. 2 reveals noteworthy characteristics of an individual trap and its response to external fields. (i) The z-component of the field gradient above the DW rapidly increases beyond 104 T/m in magnitude as the wire surface is approached from above (Fig. 2a). Such high, spatially confined gradients offer a means to manipulate, despite their low volume magnetization, ferromagnetic nanoparticles ranging in size from a few nanometers to 30 nm with pN size forces. Moreover, simulations based on object-oriented micromagnetic framework (OOMMF) program [24] yield a vortex domain wall structure, resulting in field gradients similar to those based on the point charge model. As shown in Fig. 2a, the two models yield very similar results at 1.4 μm (radius microsphere) above the wall, showing our results are essentially independent of the wall model at such heights. (ii) A weak perpendicular external field Hz (∼50 Oe) can augment or diminish the fields near HH and TT walls and thereby tune traps attractive or repulsive - thus targeted objects can be manipulated at tunable distances from the wall (Figs. 2b-2f). (iii) The magnitude of Fz is tunable to hundreds of picoNewtons (Fig. 2b), larger than the ∼20 pN limit for 2.8 μm diameter particles widely used in magnetic tweezers [25]. (iv) In the absence of H// and Hz, HDW localizes individual particles at wire vertices (Fig. 2c).
Figure 2.

Calculated field gradient, force and energy profiles from a 1000 nm wide domain wall localized on a 40 nm thick, 1 μm wide FeCo wire. (a) Magnetic field gradients above the wire based on “point charge” (solid line) model and OOMMF simulations (dashed line) increase rapidly above 104 T/m as distance z to the domain wall decreases. (b) Variation of axial force Fz determined from “point charge' model on a magnetic bead (χ = 0.85) lying 1.42 μm above domain wall with external field Hz. (c)–(f) potential energy profiles transform from attractive (c, d, e) to repulsive (f) by changing Hz further negative. Calculated maximum force Fxmax along length of wire shows its tunability with Hz. Note for distances z >1300 nm relevant to this study, the magnetic energies are not sensitive to the precise magnetization profiles within the domain wall.
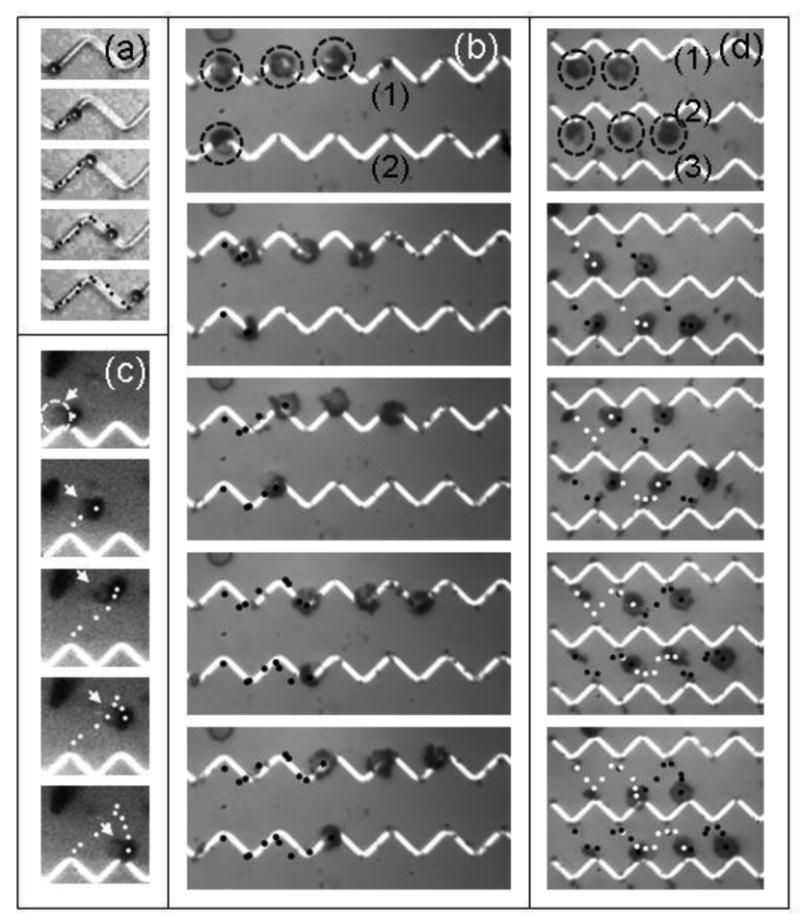
Fig. 3 and videos in [26] show several transporting examples: either microspheres or T-lymphocyte cells, where previously separated T cells (CD3 positive) from human blood cells [27] were labeled with 1 μm anti-CD3 spheres. Figs. 3a and 3b show the movement of a microsphere and several T-lymphocyte cells, respectively, above the wire by a sequence of alternating 60 Oe H// and Hz fields. Guided by the wire, the remotely directed forces move these objects with an average speed of 20 μm/sec from one vertex to the next and beyond by a set of steps as detailed in Fig. 4. The trajectory can be reversed by reordering the sequence of the H// and Hz fields. Fig. 3c illustrates a T-lymphocyte cell transported away from the wires and returned further down the same wire. Depending on the domain wall (HH or TT), the route and directional forces are regulated by orienting H// (60 Oe) parallel or anti-parallel to the desired planar direction of movement on the platform. Moreover, although the influence of HDW diminishes from the wires and Brownian motion of the microspheres becomes clearly noticeable, the fluid-borne microsphere or cell can be held suspended away from the vertex for tens of minutes. Recording <r2> = <x2 + y2> of the particle using tracking software provides a direct measure of the trap stiffness (∼2kBT<r2>-1) at temperature T. For example, the average rms fluctuation, <r2>½ , of a 2.8μm sphere over two minutes was reduced from 2.25 μm when the sphere is far from the trap to 0.54 μm at a distance of 5μm from the vertex for Hz = H// = 20 Oe. This reduction confirms that the experimentally determined 2.8×10⁻² pN/μm stiffness of a trap located 5 μm from the wire vertex has an observable effect in suppressing Brownian fluctuations through non-contact confinement of fluid-borne microparticles.
Figure 3.

(a) Sequential applications of planar (H//) and perpendicular (HZ) fields transport (indicated by dots) a microsphere on a Si platform along a zigzag wire. (b) Transport of several T-lymphocyte cells along the wires. The cells (dashed circles in top panel) are conjugated to 1 μm magnetic spheres. (c) Trajectory (white dots) of a single T-lymphocyte cell away from the wires and its controlled return to a neighboring vertex on the same wire. The arrows (and dashed circle in first panel) identify the cell. (d) Simultaneous back and forth transport of five fluid borne T-cells between zigzag wire (1) (2) and (3). Dots identify trajectory of five cells.
Figure 4.

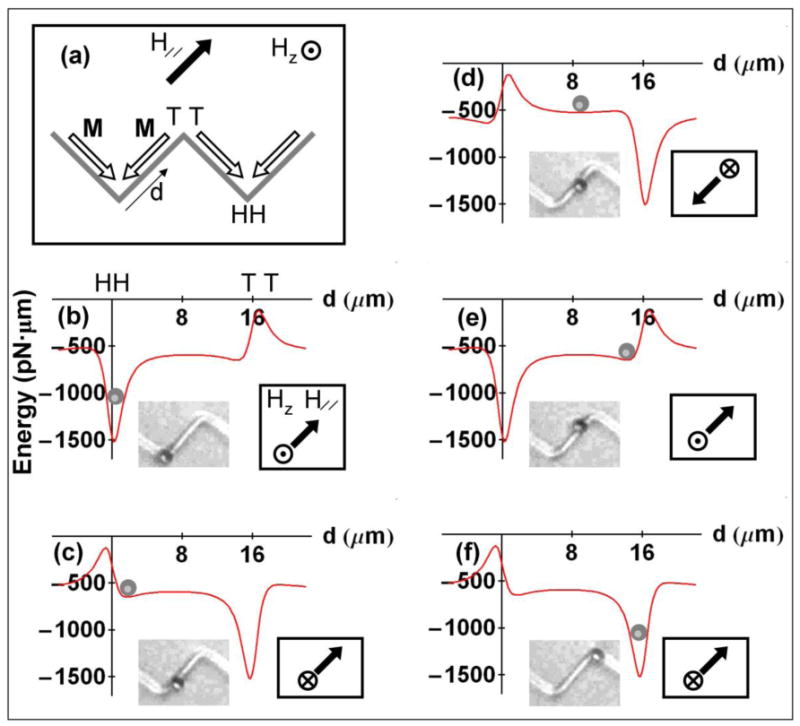
(a) Orientation of a zigzag wire, magnetization M (open arrows), and external H//, HZ fields. (b) – (f) Variation of magnetic potential energy within “point charge” model with distance d from the HH vertex along the wire. Orientations of H// and Hz are indicated. Inset photographs show close correlation between locations of a microsphere with a diameter of 2.8 μm on the wire and the calculated local energy minimum position.
Fig. 3d illustrates the correlated motion of five T-lymphocyte cells from adjacent vertices on one wire to those on the neighboring wire and their return to the first, each shifted one vertex. Reversing Hz transforms an attractive HH wall on one wire repulsive while the cells are transported to an attractive TT trap on the neighboring wire. With in-plane trajectories controlled by H//, multiple cells or particles are maneuvered in unison between vertices on separated wires at an average speed of ∼ 10 μm/sec.
Fig. 4 underpins the forward motion illustrated in Figs. 3a and 3b by showing how inverting the energy landscape along the wire assists it. The applicable structure and field geometries are shown in Fig. 4a. Figs. 4b–4f are calculated magnetic energy profiles for a 2.8 μm diameter bead in the presence of HDW, Hz, H//. In Fig. 4b the energy minimum is centered above the HH vertex. Upon reversing Hz (while H// remains unchanged), the HH trap at the origin transforms to a repulsive site while moving the energy minimum towards the neighboring TT vertex. The local energy minimum is guided, as shown in Fig. 4d, towards the TT site by reversing H//. Upon alternating the sequence of Hz and H// fields, the cell reaches the TT trap at an average speed of 20 μm/sec. Insets in Fig. 4b - 4f show photographs of the microsphere and their direct correspondence to the mobile energy minimum.
The two dimensionality of the trap platform (Fig. 1) enables: (i) single focal plane for real-time optical observation of single/multiple biological or inert particles trapped and moved on surfaces, (ii) standard lithography of patterned magnetic wires, and (iii) easy manipulation by a joystick or programmed routines via remotely controlled H// and Hz produced by miniature electromagnets. Traditional magnetic tweezers operate in a mode where the motion is perpendicular to the viewing plane, requiring dynamic refocusing or out-of-focus calibrations [13, 14]. Further, standard nanoscale lithography allows carefully positioned, ultrahigh field gradients (>104 T/m, Fig. 2a) to be applied to nanometer sized magnetic particles which have only limited interference with cell activity. The resulting forces thus offer promising intracellular directed force probe applications [28, 29]. For instance, forces greater than one picoNewton on 25 nm to 50 nm sized iron oxide particles lying within 1 μm above the wires will enable the non-contact planar manipulation of these ultra small particles within a cell.
There is also potential for single cell measurements to investigate statistical distributions that would otherwise be obscured by ensemble measurements. Simulations using data with few cells (Fig. 3) supports the scale up to simultaneously perform the experiment on thousands of identical samples. A typical experiment would be to monitor in real time the response of a large number of samples (e.g. ∼105 cells on a 1 cm × 1 cm platform) to the same stimulus, for example, to measure the consequence of time-resolved optical illumination using a charge-coupled device. Subsequent analysis would produce statistically valid data not only for the average response but also its individual fluctuation spectrum.
Another application of the high array density is their incorporation into microfluidic analytic devices [30, 31] to detect small concentration of one species in the midst of other species. An embedded zigzag wire trap array in one microfluid channel can pick off the magnetically labeled species in the sample flowing in a channel perpendicular to the array channel. Subsequently a transfer method such as that shown in Fig. 3b can move the conjugated species to a separate cross channel where it can be chemically detached and detected. This basic idea can be integrated into existing microfluidic technology as the basis for a new family of on-chip analytic tools.
In conclusion, remotely controlled directed forces from patterned magnetic wires enable the transport of fluid-borne individual or multiple T-lymphocyte cells and microspheres at speeds of several microns per second on a silicon platform. Central to this study are the simple methods to create, with nanoscale precision, highly confined domain wall field gradients. In addition to the convenience of optical microscope observation and advantage of suppressing randomizing thermal fluctuations of fluid-borne cells, development of such mobile magnetic traps will provide real-time analysis of living cells through direct manipulation that offers much more accurate selection than data-averaging over a population of cells.
Acknowledgments
Support from National Science Foundation (EEC-0425626), Army Research Office (W911NF-08-1-0455) and National Cancer Institute (R01 CA97391-01A1) is acknowledged.
References
- 1.Neuman KC, Nagy A. Nature Methods. 2008;5:491–505. doi: 10.1038/nmeth.1218. [DOI] [PMC free article] [PubMed] [Google Scholar]
- 2.Neuman KC, Lionnet T, Allemand JF. Annu Rev Mater Res. 2007;37:33–67. [Google Scholar]
- 3.Strick T, Allemand JF, Croquette V, Bensimon D. Physics Today. 2001;54:46–51. [Google Scholar]
- 4.Safarik I, Safarikova M. J Chromatogr B. 1999;722:33–53. [PubMed] [Google Scholar]
- 5.Zlatanova J, Lindsay SM, Leuba SH. Prog Biophys Mol Biol. 2000;74:37–61. doi: 10.1016/s0079-6107(00)00014-6. [DOI] [PubMed] [Google Scholar]
- 6.Shao Z, Yang J, andd J, Somlyo AP. Annu Rev Cell Dev Biol. 1995;11:241–265. doi: 10.1146/annurev.cb.11.110195.001325. [DOI] [PubMed] [Google Scholar]
- 7.Lee CK, Wang YM, Huang LS, Lin S. Micron. 2007;38:446–461. doi: 10.1016/j.micron.2006.06.014. [DOI] [PubMed] [Google Scholar]
- 8.Bustamante C, Rivetti C, Keller DJ. Curr Opin Strut Biol. 1997;7:709–716. doi: 10.1016/s0959-440x(97)80082-6. [DOI] [PubMed] [Google Scholar]
- 9.Ashkin A, Dziedzic JM, Bjorkholm JE, Chu S. Opt Lett. 1986;11:288–290. doi: 10.1364/ol.11.000288. [DOI] [PubMed] [Google Scholar]
- 10.Ashkin A, Dziedzic JM. Science. 1987;235:1517–1520. doi: 10.1126/science.3547653. [DOI] [PubMed] [Google Scholar]
- 11.Neuman KC, Block SM. Rev of Sci Instr. 2004;75:2787–2809. doi: 10.1063/1.1785844. [DOI] [PMC free article] [PubMed] [Google Scholar]
- 12.Sacconi L, Tolic-Nørrelykke IM, Stringari C, Antolini R, Pavone FS. Appl Opt. 2005;44:2001–2007. doi: 10.1364/ao.44.002001. [DOI] [PubMed] [Google Scholar]
- 13.Smith SB, Finzi L, Bustamante C. Science. 1992;258:1122–1126. doi: 10.1126/science.1439819. [DOI] [PubMed] [Google Scholar]
- 14.Tanase M, Biais N, Sheetz M. Methods in Cell Biol. 2007;83:473–493. doi: 10.1016/S0091-679X(07)83020-2. [DOI] [PubMed] [Google Scholar]
- 15.Lee H, Purdon AM, Westervelt RM. Appl Phys Lett. 2004;85 [Google Scholar]
- 16.Whitesides GM, Grzybowski B. Science. 2002;295:2418. doi: 10.1126/science.1070821. [DOI] [PubMed] [Google Scholar]
- 17.Huber A, Schafer R. Magnetic Domains. Springer; Berlin: 2000. Aharoni, A.H Introduction to the Theory of Ferromagnetism (Clarendon, Oxford, 1996. [Google Scholar]
- 18.Taniyama T, Nakatani I, Namikawa T, Yamazaki Y. Y Phys Rev Lett. 1999;82:2780. [Google Scholar]
- 19.Jackson JD. Classical Electrodynamics. 3rd. John Wiley; New York: 1999. [Google Scholar]
- 20.Helseth LE, Fischer TM, Johansen TH. Phys Rev E. 2003;67:042401. doi: 10.1103/PhysRevE.67.042401. [DOI] [PubMed] [Google Scholar]
- 21.Helseth LE, Fischer TM, Johansen TH. Phys Rev Lett. 2003;91:208302. doi: 10.1103/PhysRevLett.91.208302. [DOI] [PubMed] [Google Scholar]
- 22.Ramadan Q, Yu C, Samper V, Poenar DP. Appl Phys Lett. 2006;88:032501. [Google Scholar]
- 23.Watson JHP, Beharrell PA. J Appl Phys. 1997;81:4260. [Google Scholar]
- 24. http://math.nist.gov/oommf/
- 25.Strick TR, Allemand JF, Bensimon D, Bensimon A, Croquette V. Science. 1996;271:1835–1837. doi: 10.1126/science.271.5257.1835. [DOI] [PubMed] [Google Scholar]
- 26.See EPAPS Document No. [inserted by publisher] for cell manipulation videos.
- 27.Tong X, Xiong Y, Zborowski M, Farag SS, Chalmers JJ. Experimental Hematology. 2007;35:1613–1622. doi: 10.1016/j.exphem.2007.06.015. [DOI] [PMC free article] [PubMed] [Google Scholar]
- 28.Valberg PA, Feldman HA. Biophys J. 1987;52:551–561. doi: 10.1016/S0006-3495(87)83244-7. [DOI] [PMC free article] [PubMed] [Google Scholar]
- 29.Bausch A, Moller W, Sackmann E. Biophys J. 1999;76:573–579. doi: 10.1016/S0006-3495(99)77225-5. [DOI] [PMC free article] [PubMed] [Google Scholar]
- 30.Andersson H, van den Berg A. Sensors and Actuators B: Chemical. 2003;92:315–325. [Google Scholar]
- 31.Pamme N. Lab Chip. 2006;6:24–38. doi: 10.1039/b513005k. and references therein. [DOI] [PubMed] [Google Scholar]


