

T cells activate latent TGF-β by an LSKL peptide-sensitive mechanism, suggesting a role for thrombospondin-1 in T cell differentiation after kidney transplantation.
Keywords: renal tubulitis, CD103, thrombospondin-1
Abstract
Activated T cells infiltrate a renal allograft during rejection and can respond to TGF-β within the tubules, causing local differentiation and expression of the αE(CD103)β7 integrin. This study was performed to examine the expression of latent TGF-β within renal allograft tissues and to define a mechanism by which T cells can activate and respond to this latent factor. Rejecting renal allograft biopsy tissues showed increased expression of the latent TGF-β complex, which was localized around the tubules by a mechanism that might involve interaction with heparan sulfate in the basement membrane. A cultured renal TEC line also expressed the latent complex, but these cells did not respond to this form of TGF-β by pSmad 3. However, coculture of these cells with activated T cells induced the expression of CD103, suggesting that T cells can activate and respond to the latent TGF-β associated with TEC. Although activated T cells expressed little cell-surface TSP-1, this was increased by culture with fibronectin or fibronectin-expressing renal TEC. Blockade of TSP-1 using LSKL peptides reduced the potential of activated T cells to differentiate in response to latent TGF-β. This study suggests that penetration of renal tubules by activated T cells leads to increased expression of T cell-surface TSP-1, allowing activation of latent TGF-β sequestered on heparan sulfate within the microenvironment. This mechanism may be important for localized phenotypic maturation of T cells that have infiltrated the kidney during allograft rejection.
Introduction
TGF-β plays multiple roles during the pathogenesis of renal allograft failure, affecting kidney cells and graft-infiltrating leukocytes. The involvement of TGF-β in kidney rejection can be inferred from the presence of increased TGF-β mRNA [1] and protein [2] in urine samples from affected allograft recipients. More direct evidence is provided by observations of elevated TGF-β mRNA [3] and protein [4] within failing renal allograft tissues. However, perhaps the most persuasive demonstration of a cellular response to biologically active TGF-β within these allograft tissues is provided by the detection of pSmad 2 and/or pSmad 3 within the nuclei of TEC and graft-infiltrating leukocytes [5]. These transcription factors are activated by phosphorylation following stimulation of the cell-surface TGF-βR complex [6].
TGF-β is normally maintained as a latent complex consisting of dimeric 12.5 kDa TGF-β and two LAPs, which are cleaved from the N-terminus of the 55-kDa TGF-β proproteins during maturation [7]. This small latent complex is covalently associated with one of the 125- to 160-kDa LTBPs 1, 3, or 4, to form the LLC. The predominant form of LTBP in the kidney is LTBP-1 [8]. The expression of TGF-β and LTBP-1 is coregulated, and latent TGF-β is only secreted efficiently in the form of the LLC [8, 9]. After secretion, the LLC is rapidly immobilized by a mechanism that may include initial interaction with anionic GAGs, such as HS [10, 11].
Latent TGF-β is activated by separate mechanisms within different tissue compartments. TSP-1 [12] and NRP-1 [13] can activate latent TGF-β following hydropathic peptide interaction with a LSKL sequence motif on LAPs with the activated TGF-β remaining LAP-associated. This mechanism has been used to explain TGF-β1 presentation by some Tregs [13, 14]; indeed, NRP-1 has been used as a marker of Tregs [15]. By contrast, activated epithelium can express the αvβ6 integrin that binds an arginine-glycine-aspartic acid peptide motif in the LAP sequence. This cytoskeleton-coupled integrin can then retract, physically exposing active TGF-β within the immobilized LLC [16].
Although the mechanisms by which TGF-β is activated in specific renal allograft tissues have not been defined, the consequences of such activation for T cell biology are becoming clearer. For example, contact with murine renal epithelium can stimulate some activated T cells to express the αE(CD103)β7 integrin by a TGF-β-dependent mechanism [17]. This may account for the expression of CD103 by intratubular T cells during kidney rejection [4]. These E-cadherin-binding T cells have been implicated in mediating direct cytolytic damage of TEC during acute rejection [18]. Stimulation of activated CD4+ T cells with TGF-β1 can also enhance expression of the transcription factor FOXP3, a characteristic of Tregs [19]. A local response to active TGF-β within the tubular basement membrane might account for the focal “T reg tubulitis” [20], observed during kidney rejection. Finally, stimulation of activated CD4+ T cells by TGF-β in the presence of additional cytokines, such as IL-6, IL-1β, and IL-23, can induce the generation of Th17 cells by a Smad 2-dependent process [21]. Cells expressing this proinflammatory phenotype are also a feature of renal allograft rejection [22].
This study was designed to examine expression of the large latent TGF-β complex after kidney transplantation and to determine how this complex is sequestered within renal tissues during allograft rejection. A series of experiments was then performed to define a mechanism by which activated T cells can process the latent TGF-β complex, leading to phenotypic differentiation.
MATERIALS AND METHODS
Reagents
TGF-β1 and LAP-complexed, latent TGF-β1 (LAP-TGF-β1) were from R&D Systems (Abingdon, UK). Unlike active TGF-β1, the LAP-TGF-β1 complex did not stimulate the TGF-β-responsive MFB-F11 reporter cell line [23] at concentrations up to 25 ng/ml (data not shown). The TSP-1 inhibitory peptide (LSKL) and a nonblocking scrambled peptide sequence control (SLLK) were from AnaSpec (Cambridge, UK) [12].
Immunohistochemistry
Paraffin-embedded normal human kidney tissue (n=5), renal allograft biopsies showing normal histology (n=7), and allograft nephrectomy specimens with features of rejection (n=6) were obtained from the archives of Newcastle Hospitals National Health Service Foundation Trust in accordance with Newcastle and North Tyneside Local Research Ethics Committee approval. Where present, rejection was graded using Banff diagnostic criteria [24]. The patients showing rejection were aged between 24 and 65; three cases were female and three male. Five cases were graded as severe for T cell-mediated rejection and IF/TA; the remaining case was graded as mild in all three categories. This cohort of patients was maintained with standard triple drug immunosuppression consisting of a calcineurin inhibitor, azathioprine, and prednisolone.
Sections were labeled with a mAb specific for LTBP-1 (R&D Systems). Bound antibody was detected with biotin-conjugated goat anti-mouse Ig (Vector Laboratories, Peterborough, UK), followed by the addition of avidin-biotin-peroxidase (Vector Laboratories). Color development was performed using DAB (brown) and Mayer's hematoxylin as a counterstain. Heparan sulfate was detected with a VSV-G-tagged phage-display antibody specific for an N-, 6O-, and 2O-sulfated epitope (HS3A8; kindly provided by Dr. Toin H. van Kuppevelt, University of Nijmegen, The Netherlands) [25] and visualized with rabbit anti-VSV-G antibodies and TRITC-conjugated swine anti-rabbit (both from Sigma, Poole, UK). Immunofluorescence was detected by laser-scanning confocal microscopy (Leica, Milton Keynes, UK), and relative quantification was performed using Leica Confocal Software (LCS), after exclusion of unstained tubular lumens, in accordance with methodology described previously [4].
TEC lines
Immortalized human renal TEC (HK-2; CRL-2190; American Type Culture Collection, Manassas, VA, USA) were cultured in DMEM/Ham's F12 medium, supplemented with 10% FBS, insulin-transferrin-selenite (ITS-X; Life Technologies, Paisley, UK), and penicillin/streptomycin (all Lonza, Slough, UK) to maintain a resting epithelial phenotype [26].
Construction and application of the LTBP-1 probe
Complementary DNA was generated using RNA isolated from cultured TEC. A 567-bp sequence containing the “hinge” region of the short isoform of LTBP-1 [10] (aa 299–487 in the N-terminal region) was then amplified by PCR, verified by sequencing, and ligated into the pET32a plasmid vector (Novagen, Merck, Darmstadt, Germany). The soluble His-tagged LTBP-1 probe was expressed using the Origami(DE3) strain of Escherichia coli (Novagen, Merck), as the peptide sequence contains five potential disulfide bonds.
After purification on a nickel column, the 188-aa probe was validated by Western blotting with an antibody specific for the His-tag. The probe was then used in a series of column-elution [27] and solid-phase [28] binding experiments to measure the potential of LTBP-1 to bind GAGs (Iduron, Manchester, UK), found in the tubular basement membrane; nonspecific binding to anionic MonoS resin (Sigma) was measured for control. In all assays, the probe was quantified by immunochemical detection of the His-tag epitope.
T cell isolation and activation
Peripheral T cells were isolated from heparinized whole blood from healthy volunteer donors (both sexes; age range 24–52) by the addition of RosetteSep human T cell enrichment cocktail (Stemcell Technologies, Grenoble, France), followed by density gradient centrifugation at 1200 g for 10 min. Enriched T cells were recovered, washed, and resuspended in RPMI-1640 culture medium at 1 × 10⁶ cells/ml. T cell purity was always >98%.
T cells were activated with anti-CD3/CD28 antibody-conjugated beads (Human T-Activator Dynabeads; Invitrogen, Paisley, UK) at an optimal T cell:bead ratio of 2:1 or by mixed leukocyte culture using a γ-irradiated (25 Gy), allogeneic, EBV-transformed B cell line at an optimal ratio of 1:1 with T cells [29]. Cell-surface expression of CD103, β6 integrin, TSP-1, and NRP-1 by CD3+ cells was assessed by flow cytometry for up to 11 days (FACSCanto; BD Biosciences, Oxford, UK); TSP-1 expression was also measured after 1 h coculture with TEC or plate-bound fibronectin (Sigma). Intracellular TSP-1 was examined after permeabilization of the cells with 0.1% saponin (Sigma) prior to immunofluorescence labeling. Some T cell cultures were supplemented after 72 h with 5 ng/ml TGF-β1 or an equimolar concentration of LAP-TGF-β1 together with the LSKL peptide inhibitor or a control peptide sequence (both at an optimal 50 μM). Cells were recovered after 6 h to prepare RNA or up to 7 days later for flow cytometric analysis.
pSmad 3 Western blot
Immortalized TEC were grown in 25 cm2 flasks until 80–100% confluent, before being rested for 24 h in serum-free DMEM/F-12 medium. Cells were then treated for 30 min at 37°C with 2.5 ng/ml active TGF-β1 or were not stimulated. The cells were then lysed in buffer containing protease and phosphatase inhibitors, sonicated, and centrifuged at 15,000 g for 10 min. Equal quantities of protein were boiled in sample buffer and loaded for SDS-PAGE. After transfer, the membrane was copper-stained to demonstrate equal protein loading and sequentially labeled with anti-pSmad 3 (Abcam, Cambridge, UK; 1:2000 in 5% BSA) and a HRP-conjugated secondary antibody (Abcam) before ECL development (Amersham, GE Healthcare, Little Chalfont, UK).
Immunofluorescent staining of immortalized TEC on chamber slides
Immortalized TEC were seeded into eight-well chamber slides at a density of 50,000 cells/ml and incubated for 7 days at 37°C. Medium was aspirated, and cells were washed in PBS before fixation in 4% PFA. After further washing, cells were permeabilized using 0.5% Triton X-100 and washed again, and nonspecific binding sites were blocked using 3% BSA in PBS. A mouse anti-human LTBP-1 mAb (R&D Systems) and a rabbit anti-human fibronectin polyclonal antibody (Abcam) were diluted to 1:100 in blocking buffer and added to the appropriate wells. After overnight incubation, the cells were washed in PBS and secondary goat anti-rabbit FITC (Sigma) and rabbit anti-mouse FITC (Dako, Ely, UK) antibodies were both added at a 1:150 dilution in blocking buffer and incubated at room temperature for 2 h in the dark. Slides were then washed in PBS, and nuclei were stained with DAPI before laser-scanning confocal microscopy using a 63× oil immersion lens (Leica).
Coculture of TEC and activated T cells
Resting or TGF-β-activated, immortalized TEC were plated in six-well plates in complete growth medium and incubated overnight, and T cells, previously activated by stimulation with CD3/CD28 beads for 72 h, were added. Cells were cocultured for a further 48 h, and the proportion of recovered CD3+ T cells expressing CD103 was measured by two-color flow cytometry using PE-conjugated CD3 antibody and FITC-conjugated anti-CD103 antibody (BD Biosciences). Some cocultures were supplemented with the TGF-β type I receptor (ALK5) inhibitor SB-505124 (Sigma) at an optimal concentration of 1 μM, as described previously [22].
qPCR
RNA was isolated from cultured T cells using Trizol reagent (Sigma) and transcribed to cDNA using Superscript II (Invitrogen). Changes in expression of FOXP3, αE integrin and TGF-β1 genes (Assays-on-Demand; Applied Biosystems, Life Technologies, Warrington, UK) were measured by qPCR (ABI Prism 7700; Applied Biosystems, Life Technologies) using 18S RNA for normalization [30]; results were compared using Relative Expression Software Tool (REST) 2008 (Corbett Life Science, Qiagen, The Netherlands) [31].
Statistical analysis
Differences between groups of experimental data were examined as appropriate by unpaired Student's t-test or one-way repeated measures ANOVA with Tukey's post-test; results were considered significant at P ≤ 0.05. Mean results are presented ± sem; IC50 values are shown with 95% confidence limits. Except for qPCR results (above), all data were analyzed using GraphPad Prism v3 software (La Jolla, CA, USA).
RESULTS
Immunohistochemical localization of LTBP-1 and HS in biopsy sections
Normal human kidney (Fig. 1A) and renal allograft tissue showing normal histology (Fig. 1B) expressed low levels of LTBP-1. However, an increased level of LTBP-1 was observed around most tubules and within the interstitium of sections showing T cell infiltration and IF/TA (Fig. 1C). The basement membrane of the tubules in normal kidney (Fig. 1D) and renal allografts with no or borderline rejection (Fig. 1E) expressed a low level of N-, 6O-, and 2O-sulfated HS. This was increased greatly in the thickened tubular basement membrane of remnant tubules and the interstitium in tissue with features of cellular infiltration (Fig. 1F). Figure 1G shows quantified expression of the HS3A8 epitope in kidney sections and indicates a significant increase (P<0.0001) in the expression of heavily sulfated HS in transplant sections showing cellular infiltration.
Figure 1. Immunohistochemical localization of LTBP-1 and heavily sulfated heparan sulfate in human kidney.

Representative sections showing low-level, tubule-associated LTBP-1 expression (stained brown with a blue Mayer's hematoxylin nuclear counterstain) in sections from normal kidney (A) and transplanted kidney (B) with no apparent rejection; this was greatly increased in transplanted kidneys with chronic inflammation and IF/TA (C). Heavily sulfated HS expressing the HS3A8 epitope (red TRITC immunofluorescence with a blue DAPI nuclear counterstain) was restricted to the narrow tubular basement membrane in normal kidney (D) and nonrejecting renal allograft tissue (E); this expression was increased and included the expanded interstitium in sections showing features of T cell infiltration with IF/TA (F). Relative quantification of the HS3A8 epitope in normal and chronic rejection transplant biopsy sections (G), showing increased expression associated with T cell infiltration and IF/TA (P<0.0001); the bars show mean values ± sem.
LTBP-1 binding to HS
Messenger RNA encoding LTBP-1 was isolated from resting, immortalized human TEC, suggesting a level of constitutive expression of this gene. The purity of a cloned 188-aa LTBP-1 probe containing a putative HS-binding domain was verified by demonstration of a single band by Western blotting for the integral His-tag (Fig. 2A). This probe bound within a heparin-sepharose column and was eluted maximally with 0.68 M NaCl. Anionic MonoS did not bind the probe, indicating the sequence specificity of the interaction between LTBP-1 and heparin (Fig. 2B). Figure 2C shows results from a competition-binding experiment, in which soluble heparin was used to displace the LTBP-1 probe from a complex formed with immobilized heparin on a 96-well plate. The IC50 value for soluble heparin was 0.23 μg/ml (95% confidence interval: 0.14–0.30 μg/ml). The less-heavily sulfated molecule HS had a lower affinity for the LTBP-1 probe (Fig. 2D), with an IC50 of 33.22 μg/ml (95% confidence limit: 18.17–60.12 μg/ml). HS, desulfated at the N- or O-positions, did not bind LTBP-1 (not shown); the structurally unrelated GAG chondroitin sulfate was also unable to bind LTBP-1 (not shown).
Figure 2. Examination of LTBP-1 binding to heparan sulfate.

(A) A Western blot indicating the homogeneity of the His-tagged LTBP-1 probe. (B) An elution profile of the probe sequence from a heparin column (■), with maximal elution produced by 0.67 M NaCl; anionic MonoS resin (●) did not bind the probe. Competitive displacement of the LTBP-1 probe from plate-bound heparin by (C) soluble heparin (IC50=0.23 μg/ml) or (D) soluble HS (IC50=3.22 μg/ml).
Activated T cells respond to latent TGF-β presented by immortalized TEC
Resting, immortalized TEC cultures expressed LTBP-1 within the matrix between confluent cells (Fig. 3A), indicating secretion of the large latent form of TGF-β. These cells did not express the αvβ6 integrin (Fig. 3B) and were unable to activate endogenously produced, latent TGF-β, as indicated by the absence of a constitutive intracellular pSmad 3 signal on Western blotting (Fig. 3C, lane i). A positive control demonstrated that these epithelial cells could phosphorylate Smad 3 when active TGF-β was delivered exogenously (Fig. 3C, lane ii). Flow cytometric analysis of activated T cells cultured in the absence of renal cells showed that only 5.4 ± 2.2% (mean±sem; n=3) of these cells expressed CD103 in the absence of exogenous TGF-β (representative result shown in Fig. 3D). However, coculture with immortalized TEC for 48 h induced significantly increased CD103 expression (P<0.01) on 26.8 ± 3.7% of these T cells (representative result shown in Fig. 3E). Coculture performed in the presence of TGF-βR (ALK5) blockade reduced the induction of CD103 expression to a background level of 2.8 ± 1.4%; this was not significantly different from CD103 expression by T cells cultured in the absence of TEC (P>0.05). For comparison, a coculture was established between T cells and γ-irradiated, allogeneic, EBV-transformed B cells, which do not produce TGF-β. In this system, the T cells failed to show elevated expression of CD103 unless exogenous TGF-β1 was added on Day 3 (Fig. 3F).
Figure 3. The response of activated T cells to latent TGF-β.

(A) A representative image showing extracellular LTBP-1 expression (FITC, green) by resting, immortalized TEC (DAPI-stained nuclei, blue). (B) Immunofluorescence flow cytometry of resting, immortalized TEC showing no basal expression of the β6 integrin. The shaded histogram shows fluorescence produced by labeling with an isotype-matched control antibody, and the open histogram shows experimental labeling; the analysis region was set at 3% for isotype-control labeled cells. (C) Representative Western blot showing no constitutive pSmad 3 signaling in resting, immortalized TEC cells (lane i) and pSmad 3 following stimulation with active TGF-β1 for 30 min (lane ii); the background protein staining demonstrates equal protein loading in both lanes. (D) A flow cytometric dot plot showing that few (<3%) activated T cells express CD103 in the absence of exogenous TGF-β1. However, CD103 expression was induced on 25% of the cells by coculture with TEC for 2 days (E). (F) An allogeneic mixed leukocyte culture only produced elevated expression of CD103 by responding T cells when exogenous TGF-β1 was added on Day 3 (□, no TGF-β1; ■, TGF-β1 added).
Activation of latent TGF-β by T cells
Activated human T cells did not express cell-surface β6 integrin (Fig. 4A), and neither TSP-1 nor NRP-1 was expressed by resting T cells (not shown). However, a small proportion of T cells did express cell-surface NRP-1 after activation for 48 h (17.3±2.3%; n=8 T cell donors; mean±sem; representative result shown in Fig. 4B) and TSP-1 after 72 h (15.9±1.3%; n=19 T cell donors; representative result shown in Fig. 4C); the majority of activated T cells expressed intracellular TSP-1 (not shown). The proportion of activated T cells expressing cell-surface TSP-1 was increased significantly by 1 h coculture with resting TEC (P<0.05; n=3 separate T cell donors; Fig. 4D); culture with TGF-β-pretreated epithelial cells further increased cell-surface TSP-1 expression (P<0.005; Fig. 4D). Immunofluorescence analysis of cultured TEC demonstrated deposition of fibronectin between the cells (Fig. 4E). Treatment of activated T cells with plate-bound fibronectin (Fig. 4F) increased the proportion expressing cell-surface TSP-1 within a 1-h culture period (P<0.001 for all tested concentrations of fibronectin); an increase in TSP-1 expression (P<0.05) was observed between T cells treated with 5 μg/ml and 10 μg/ml fibronectin, suggesting a dose-dependent response.
Figure 4. Examination of T cell expression of the β 6 integrin, NRP-1, and TSP-1.
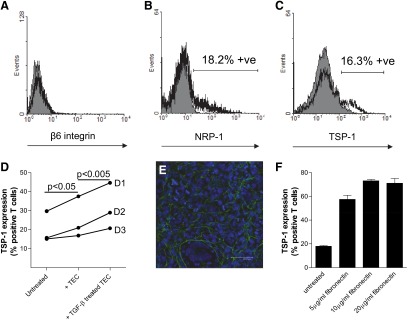
Immunofluorescence flow cytometry of activated T cells showing no significant cell surface of expression of the β6 integrin (A). Subpopulations of activated T cells expressed cell-surface NRP-1 (B) and TSP-1 (C). Each shaded histogram shows the result of labeling with isotype-matched control antibodies; the open histograms show experimental labeling. (D) The mean expression of cell-surface TSP-1 by duplicate samples of activated T cells from three different volunteer blood donors (D1, D2, D3) was increased by coculture with TEC for 1 h prior to flow cytometry (P<0.05); pretreatment of the TEC with TGF-β1 further increased the expression of TSP-1 (P<0.005). (E) Representative immunofluorescence showing extracellular expression of fibronectin (FITC, green) by resting, immortalized TEC (DAPI-stained nuclei, blue). (F) T cells show markedly increased cell-surface expression of TSP-1 after addition to plate-bound fibronectin for 1 h. The bars show mean results ± sem; two separate experiments.
Figure 5 shows the results of qPCR analysis of mRNA encoding the αE integrin, FOXP3, and TGF-β1 in activated T cells following stimulation for 6 h with LAP-TGF-β1 in the presence of no peptide, the LSKL inhibitory peptide, or the scrambled control sequence. All results were normalized to activated T cells, which were not stimulated with LAP-TGF-β1. The induction of each of these TGF-β-responsive genes was reduced significantly in the presence of the peptide inhibitor.
Figure 5. The activation of latent TGF-β1 by T cells.

Changes in gene expression between activated T cells stimulated with LAP-TGF-β1 alone (solid bars) or LAP-TGF-β1 with the TSP-1-blocking peptide (shaded bars) or control peptide (open bars). These summary results are normalized to activated T cells, which have not been stimulated with LAP-TGF-β1, and are from three experiments using T cells from different donors. The error bars show mean values ± sem.
DISCUSSION
LTBP-1 was constitutively expressed at a low level around the tubules of normal human kidney and transplanted kidney, which showed no features of rejection. However, the expression of LTBP-1 was increased greatly within the tubular basement membrane and the expanded interstitium of transplant sections showing features of T cell infiltration with IF/TA. As LTBP-1 is a component of the large latent TGF-β complex [8], these results are consistent with previous demonstrations of constitutive expression of TGF-β by normal renal tubules [32] and the increase in expression reported during chronic renal rejection [3, 4, 32].
A domain within the N-terminal region of LTBP-1 contains multiple basic amino acids (HRRRPIHHHVGK), with a theoretical isoelectric point of 12.3 (ExPASy Bioinformatics Resource Portal; expasy.org). This region of LTBP-1 was cloned from mRNA prepared from resting human TEC and expressed as a 188-aa peptide. This peptide bound heparin (a heavily sulfated analog of HS) with a similar affinity to that measured previously for the heparin-binding chemokine CCL5 [33]. The distribution of CCL5 during renal allograft rejection [34] is similar to that observed for LTBP-1, suggesting a common mechanism for sequestration by HS within kidney tissues. The interaction between LTBP-1 and heavily sulfated HS provides a potential mechanism for localizing latent TGF-β in proximity to TEC and infiltrating T cells during renal allograft rejection.
Expression of the αvβ6 integrin by human TEC provides a potential route to mechanical activation of the LLC form of latent TGF-β [35]. However, resting TEC in culture expressed neither this integrin nor pSmad 3, demonstrating the absence of active TGF-β generated by processing latent TGF-β in the culture system. Despite this failure of TGF-β activation by cultured TEC, addition of activated T cells to these cultures was followed by the induction of CD103 expression. A similar observation has been reported previously for coculture of murine CD8+ T cells and TEC [17].
The mechanism for induction of αE integrin gene expression in activated T cells is still poorly defined [36]. However, TGF-β signaling is implicated, as the proximal promoter of the αE integrin is known to contain Smad-binding CAGA box motifs [37]. Previous studies have also suggested that the expression of this integrin by activated T cells is an efficient marker of the presence of active TGF-β, in vitro [29] and in vivo [38]. The observed failure of CD103 induction on activated T cells in a non-TGF-β1-supplemented mixed leukocyte culture is consistent with a report showing that none of 37 EBV-transformed human B cell lines released detectable TGF-β [39]. The crucial role played by TGF-β in the induction of CD103 during human T cell coculture with TEC was also demonstrated in this study by pharmacological inhibition of the TGF-βR. This finding is consistent with a previous study of murine cells that used a TGF-β-neutralizing antibody to inhibit CD103 induction [17]. The current study suggests that T cells can activate the latent TGF-β associated with TEC by a mechanism that is independent of the αvβ6 integrin.
Candidate molecules that might allow T cells to activate latent TGF-β within the tubular basement membrane include cell-surface TSP-1 and NRP-1 [13, 14]. An initial experiment demonstrated that activated T cells did not express the β6 integrin, but TSP-1 and NRP-1 were expressed by subpopulations of the activated T cells. Brief coculture of activated T cells with fibronectin-expressing TEC increased the cell-surface expression of TSP-1. This increase was more pronounced following culture with TEC, which had been pretreated with TGF-β1. This treatment is known to increase fibronectin expression [40]. Stimulation of activated T cells with fibronectin alone was also sufficient to increase the expression of TSP-1. These observations are consistent with a previous report showing that TSP-1 is rapidly exported to the T cell surface following contact with matrix proteins, such as fibronectin [41], which is a normal component of the tubular basement membrane [42] but shows increased expression in kidney allografts with IF/TA [43].
The potential of T cells to activate latent TGF-β1 was verified by quantitative analysis of mRNA sequences encoding FOXP3, TGF-β1, and the αE integrin. The expression of each of these TGF-β-responsive genes [36, 44, 45] was increased rapidly by treatment with LAP-TGF-β1. However, in each case, the response to LAP-TGF-β1 was inhibited specifically by the LSKL peptide, suggesting a role for TSP-1 and/or NRP-1 in the activation of latent TGF-β by T cells in these cultures.
In summary, this study suggests that expression of the LLC form of latent TGF-β is increased during renal allograft rejection. This latent factor is bound by heavily N- and O-sulfated HS within the expanded interstitium and basement membrane surrounding atrophic tubules. Cultured renal TEC lines also expressed LTBP-1 but showed no intracellular signaling response to endogenously generated, latent TGF-β. However, activated T cells did respond to this latent TGF-β during coculture with renal TEC. A proportion of activated T cells was shown to express TSP-1 and NRP-1 in vitro, and the expression of TSP-1 was increased by brief contact with fibronectin-expressing renal TEC. Specific blockade of TSP-1 and NRP-1 reduced the response of activated T cells to stimulation with latent TGF-β. These data suggest that T cells in contact with the tubules in a rejecting renal allograft can directly activate sequestered, latent TGF-β, resulting in localized T cell differentiation.
ACKNOWLEDGMENTS
This work was supported by grants from Kidney Research UK, The Roche Organ Transplantation Research Foundation, and the Newcastle upon Tyne Biomedical Research Centre for Ageing and Age-Related Disease. J.S. is supported by an EU FP6 Marie Curie Early Stage Research Training (EST) Fellowship [Regulation of Organ Survival After Transplantation (ROSAT) project]. J.D.P.W. is supported by a British Transplantation Society studentship.
SEE CORRESPONDING EDITORIAL ON PAGE 459
- ALK5
- activin-like kinase 5
- FOXP3
- forkhead box P3
- GAG
- glycosaminoglycan
- HS
- heparan sulfate
- IF/TA
- interstitial fibrosis/tubular atrophy
- LAP
- latency-associated peptide
- LLC
- large latent complex
- LSKL
- TSP-1 inhibitory peptide
- LTBP
- latent TGF-β-binding protein
- NRP-1
- neuropilin-1
- pSmad
- phosphorylated Smad
- qPCR
- quantitative real-time PCR
- TEC
- tubular epithelial cell(s)
- Treg
- regulatory T cell
- TSP-1
- thrombospondin-1
- VSV-G
- VSV-glycoprotein
AUTHORSHIP
The study design was done by S.A. and J.A.K. J.D.P.W., W.P., S.E.J., A.A.A., J.S., J.G.B., and H.R. performed the experimental work. Data analysis was performed by J.D.P.W., W.P., K.W., S.E.J., J.S., J.G.B., H.R., and J.A.K. J.D.P.W. and J.A.K. wrote the manuscript.
REFERENCES
- 1. Mas V. R., Mas L. A., Archer K. J., Yanek K., King A. L., Gibney E. M., Cotterell A., Fisher R. A., Posner M., Maluf D. G. (2007) Evaluation of gene panel mRNAs in urine samples of kidney transplant recipients as a non-invasive tool of graft function. Mol. Med. 13, 315–324 [DOI] [PMC free article] [PubMed] [Google Scholar]
- 2. Teppo A. M., Honkanen E., Finne P., Tornroth T., Gronhagen-Riska C. (2004) Increased urinary excretion of α1-microglobulin at 6 months after transplantation is associated with urinary excretion of transforming growth factor-β1 and indicates poor long-term renal outcome. Transplantation 78, 719–724 [DOI] [PubMed] [Google Scholar]
- 3. Gaciong Z., Koziak K., Religa P., Lisiecka A., Morzycka-Michalik M., Rell K., Kozlowska-Boszko B., Lao M. (1995) Increased expression of growth factors during chronic rejection of human kidney allograft. Transplant. Proc. 27, 928–929 [PubMed] [Google Scholar]
- 4. Robertson H., Wong W. K., Talbot D., Burt A. D., Kirby J. A. (2001) Tubulitis after renal transplantation: demonstration of an association between CD103+ T cells, transforming growth factor β1 expression and rejection grade. Transplantation 71, 306–313 [DOI] [PubMed] [Google Scholar]
- 5. Tyler J. R., Robertson H., Booth T. A., Burt A. D., Kirby J. A. (2006) Chronic allograft nephropathy: intraepithelial signals generated by transforming growth factor-β and bone morphogenetic protein-7. Am. J. Transplant. 6, 1367–1376 [DOI] [PubMed] [Google Scholar]
- 6. Shi Y., Massague J. (2003) Mechanisms of TGF-β signaling from cell membrane to the nucleus. Cell 113, 685–700 [DOI] [PubMed] [Google Scholar]
- 7. Annes J. P., Munger J. S., Rifkin D. B. (2003) Making sense of latent TGFβ activation. J. Cell Sci. 116, 217–224 [DOI] [PubMed] [Google Scholar]
- 8. Hyytiainen M., Penttinen C., Keski-Oja J. (2004) Latent TGF-β binding proteins: extracellular matrix association and roles in TGF-β activation. Crit. Rev. Clin. Lab. Sci. 41, 233–264 [DOI] [PubMed] [Google Scholar]
- 9. Miyazono K., Olofsson A., Colosetti P., Heldin C. H. (1991) A role of the latent TGF-β 1-binding protein in the assembly and secretion of TGF-β 1. EMBO J. 10, 1091–1101 [DOI] [PMC free article] [PubMed] [Google Scholar]
- 10. Chen Q., Sivakumar P., Barley C., Peters D. M., Gomes R. R., Farach-Carson M. C., Dallas S. L. (2007) Potential role for heparan sulfate proteoglycans in regulation of transforming growth factor-β (TGF-β) by modulating assembly of latent TGF-β-binding protein-1. J. Biol. Chem. 282, 26418–26430 [DOI] [PubMed] [Google Scholar]
- 11. Oklu R., Metcalfe J. C., Hesketh T. R., Kemp P. R. (1998) Loss of a consensus heparin binding site by alternative splicing of latent transforming growth factor-β binding protein-1. FEBS Lett. 425, 281–285 [DOI] [PubMed] [Google Scholar]
- 12. Ribeiro S. M., Poczatek M., Schultz-Cherry S., Villain M., Murphy-Ullrich J. E. (1999) The activation sequence of thrombospondin-1 interacts with the latency-associated peptide to regulate activation of latent transforming growth factor-β. J. Biol. Chem. 274, 13586–13593 [DOI] [PubMed] [Google Scholar]
- 13. Glinka Y., Prud'homme G. J. (2008) Neuropilin-1 is a receptor for transforming growth factor β-1, activates its latent form, and promotes regulatory T cell activity. J. Leukoc. Biol. 84, 302–310 [DOI] [PMC free article] [PubMed] [Google Scholar]
- 14. Oida T., Zhang X., Goto M., Hachimura S., Totsuka M., Kaminogawa S., Weiner H. L. (2003) CD4+CD25− T cells that express latency-associated peptide on the surface suppress CD4+CD45RBhigh-induced colitis by a TGF-β-dependent mechanism. J. Immunol. 170, 2516–2522 [DOI] [PubMed] [Google Scholar]
- 15. Bruder D., Probst-Kepper M., Westendorf A. M., Geffers R., Beissert S., Loser K., von Boehmer H., Buer J., Hansen W. (2004) Neuropilin-1: a surface marker of regulatory T cells. Eur. J. Immunol. 34, 623–630 [DOI] [PubMed] [Google Scholar]
- 16. Jenkins R. G., Su X., Su G., Scotton C. J., Camerer E., Laurent G. J., Davis G. E., Chambers R. C., Matthay M. A., Sheppard D. (2006) Ligation of protease-activated receptor 1 enhances α(v)β6 integrin-dependent TGF-β activation and promotes acute lung injury. J. Clin. Invest. 116, 1606–1614 [DOI] [PMC free article] [PubMed] [Google Scholar]
- 17. Hadley G. A., Bartlett S. T., Via C. S., Rostapshova E. A., Moainie S. (1997) The epithelial cell-specific integrin, CD103 (α E integrin), defines a novel subset of alloreactive CD8+ CTL. J. Immunol. 159, 3748–3756 [PubMed] [Google Scholar]
- 18. Hadley G. A., Rostapshova E. A., Gomolka D. M., Taylor B. M., Bartlett S. T., Drachenberg C. I., Weir M. R. (1999) Regulation of the epithelial cell-specific integrin, CD103, by human CD8+ cytolytic T lymphocytes. Transplantation 67, 1418–1425 [DOI] [PubMed] [Google Scholar]
- 19. Feuerer M., Hill J. A., Mathis D., Benoist C. (2009) Foxp3+ regulatory T cells: differentiation, specification, subphenotypes. Nat. Immunol. 10, 689–695 [DOI] [PubMed] [Google Scholar]
- 20. Veronese F., Rotman S., Smith R. N., Pelle T. D., Farrell M. L., Kawai T., Benedict Cosimi A., Colvin R. B. (2007) Pathological and clinical correlates of FOXP3+ cells in renal allografts during acute rejection. Am. J. Transplant. 7, 914–922 [DOI] [PubMed] [Google Scholar]
- 21. Martinez G. J., Zhang Z., Reynolds J. M., Tanaka S., Chung Y., Liu T., Robertson E., Lin X., Feng X. H., Dong C. (2010) Smad2 positively regulates the generation of Th17 cells. J. Biol. Chem. 285, 29039–29043 [DOI] [PMC free article] [PubMed] [Google Scholar]
- 22. Pekalski M., Jenkinson S. E., Willet J. D., Poyner E. F., Alhamidi A. H., Robertson H., Ali S., Kirby J. A. (2012) Renal allograft rejection: examination of delayed differentiation of Treg and Th17 effector T cells. Immunobiology [Epub ahead of print] [DOI] [PubMed] [Google Scholar]
- 23. Tesseur I., Zou K., Berber E., Zhang H., Wyss-Coray T. (2006) Highly sensitive and specific bioassay for measuring bioactive TGF-β. BMC Cell Biol. 7, 15. [DOI] [PMC free article] [PubMed] [Google Scholar]
- 24. Solez K., Colvin R. B., Racusen L. C., Haas M., Sis B., Mengel M., Halloran P. F., Baldwin W., Banfi G., Collins A. B., Cosio F., David D. S., Drachenberg C., Einecke G., Fogo A. B., Gibson I. W., Glotz D., Iskandar S. S., Kraus E., Lerut E., Mannon R. B., Mihatsch M., Nankivell B. J., Nickeleit V., Papadimitriou J. C., Randhawa P., Regele H., Renaudin K., Roberts I., Seron D., Smith R. N., Valente M. (2008) Banff 07 classification of renal allograft pathology: updates and future directions. Am. J. Transplant. 8, 753–760 [DOI] [PubMed] [Google Scholar]
- 25. Rops A. L., van den Hoven M. J., Baselmans M. M., Lensen J. F., Wijnhoven T. J., van den Heuvel L. P., van Kuppevelt T. H., Berden J. H., van der Vlag J. (2008) Heparan sulfate domains on cultured activated glomerular endothelial cells mediate leukocyte trafficking. Kidney Int. 73, 52–62 [DOI] [PubMed] [Google Scholar]
- 26. Tian Y. C., Phillips A. O. (2003) TGF-β1-mediated inhibition of HK-2 cell migration. J. Am. Soc. Nephrol. 14, 631–640 [DOI] [PubMed] [Google Scholar]
- 27. Ali S., Robertson H., Wain J. H., Isaacs J. D., Malik G., Kirby J. A. (2005) A non-glycosaminoglycan-binding variant of CC chemokine ligand 7 (monocyte chemoattractant protein-3) antagonizes chemokine-mediated inflammation. J. Immunol. 175, 1257–1266 [DOI] [PubMed] [Google Scholar]
- 28. Mellor P., Harvey J. R., Murphy K. J., Pye D., O'Boyle G., Lennard T. W., Kirby J. A., Ali S. (2007) Modulatory effects of heparin and short-length oligosaccharides of heparin on the metastasis and growth of LMD MDA-MB 231 breast cancer cells in vivo. Br. J. Cancer 97, 761–768 [DOI] [PMC free article] [PubMed] [Google Scholar]
- 29. Wong W. K., Robertson H., Carroll H. P., Ali S., Kirby J. A. (2003) Tubulitis in renal allograft rejection: role of transforming growth factor-β and interleukin-15 in development and maintenance of CD103+ intraepithelial T cells. Transplantation 75, 505–514 [DOI] [PubMed] [Google Scholar]
- 30. Bas A., Forsberg G., Hammarstrom S., Hammarstrom M. L. (2004) Utility of the housekeeping genes 18S rRNA, β-actin and glyceraldehyde-3-phosphate-dehydrogenase for normalization in real-time quantitative reverse transcriptase-polymerase chain reaction analysis of gene expression in human T lymphocytes. Scand. J. Immunol. 59, 566–573 [DOI] [PubMed] [Google Scholar]
- 31. Pfaffl M. W., Horgan G. W., Dempfle L. (2002) Relative expression software tool (REST) for group-wise comparison and statistical analysis of relative expression results in real-time PCR. Nucleic Acids Res. 30, e36. [DOI] [PMC free article] [PubMed] [Google Scholar]
- 32. Horvath L. Z., Friess H., Schilling M., Borisch B., Deflorin J., Gold L. I., Korc M., Buchler M. W. (1996) Altered expression of transforming growth factor-β S in chronic renal rejection. Kidney Int. 50, 489–498 [DOI] [PubMed] [Google Scholar]
- 33. Proudfoot A. E., Fritchley S., Borlat F., Shaw J. P., Vilbois F., Zwahlen C., Trkola A., Marchant D., Clapham P. R., Wells T. N. (2001) The BBXB motif of RANTES is the principal site for heparin binding and controls receptor selectivity. J. Biol. Chem. 276, 10620–10626 [DOI] [PubMed] [Google Scholar]
- 34. Robertson H., Wheeler J., Morley A. R., Booth T. A., Talbot D., Kirby J. A. (1998) β-Chemokine expression and distribution in paraffin-embedded transplant renal biopsy sections: analysis by scanning laser confocal microscopy. Histochem. Cell Biol. 110, 207–213 [DOI] [PubMed] [Google Scholar]
- 35. Annes J. P., Chen Y., Munger J. S., Rifkin D. B. (2004) Integrin αVβ6-mediated activation of latent TGF-β requires the latent TGF-β binding protein-1. J. Cell Biol. 165, 723–734 [DOI] [PMC free article] [PubMed] [Google Scholar]
- 36. Robinson P. W., Green S. J., Carter C., Coadwell J., Kilshaw P. J. (2001) Studies on transcriptional regulation of the mucosal T-cell integrin αEβ7 (CD103). Immunology 103, 146–154 [DOI] [PMC free article] [PubMed] [Google Scholar]
- 37. Kilshaw P. J. (1999) Alpha E beta 7. Mol. Pathol. 52, 203–207 [DOI] [PMC free article] [PubMed] [Google Scholar]
- 38. Wang D., Yuan R., Feng Y., El-Asady R., Farber D. L., Gress R. E., Lucas P. J., Hadley G. A. (2004) Regulation of CD103 expression by CD8+ T cells responding to renal allografts. J. Immunol. 172, 214–221 [DOI] [PubMed] [Google Scholar]
- 39. Wroblewski J. M., Copple A., Batson L. P., Landers C. D., Yannelli J. R. (2002) Cell surface phenotyping and cytokine production of Epstein-Barr virus (EBV)-transformed lymphoblastoid cell lines (LCLs). J. Immunol. Methods 264, 19–28 [DOI] [PubMed] [Google Scholar]
- 40. Qi W., Chen X., Holian J., Mreich E., Twigg S., Gilbert R. E., Pollock C. A. (2006) Transforming growth factor-β1 differentially mediates fibronectin and inflammatory cytokine expression in kidney tubular cells. Am. J. Physiol. Renal Physiol. 291, F1070–F1077 [DOI] [PubMed] [Google Scholar]
- 41. Li S. S., Ivanoff A., Bergstrom S. E., Sandstrom A., Christensson B., van Nerven J., Holgersson J., Hauzenberger D., Arencibia I., Sundqvist K. G. (2002) T lymphocyte expression of thrombospondin-1 and adhesion to extracellular matrix components. Eur. J. Immunol. 32, 1069–1079 [DOI] [PubMed] [Google Scholar]
- 42. Abrahamson D. R., Leardkamolkarn V. (1991) Development of kidney tubular basement membranes. Kidney Int. 39, 382–393 [DOI] [PubMed] [Google Scholar]
- 43. Bedi S., Vidyasagar A., Djamali A. (2008) Epithelial-to-mesenchymal transition and chronic allograft tubulointerstitial fibrosis. Transplant. Rev. (Orlando) 22, 1–5 [DOI] [PMC free article] [PubMed] [Google Scholar]
- 44. Oida T., Weiner H. L. (2010) TGF-β induces surface LAP expression on murine CD4 T cells independent of Foxp3 induction. PLoS One 24, e15523. [DOI] [PMC free article] [PubMed] [Google Scholar]
- 45. Tone Y., Furuuchi K., Kojima Y., Tykocinski M. L., Greene M. I., Tone M. (2008) Smad3 and NFAT cooperate to induce Foxp3 expression through its enhancer. Nat. Immunol. 9, 194–202 [DOI] [PubMed] [Google Scholar]