

Abstract
We describe a serial optical coherence scanner (SOCS) for high resolution imaging of ex-vivo brain. SOCS integrates a multi-contrast optical coherence tomography and a vibratome slicer to establish comprehensive brain anatomy and fiber pathways in three-dimensional space. Rat brain images are demonstrated by utilizing intrinsic optical contrasts including back-scattering, birefringence and optic axis orientation, which are simultaneously generated from the same dataset. Volumetric images from serial scans are combined to realize large scale brain maps. Nerve fiber tracts are globally described in 3D by retardance, and delicately delineated by cross-polarization at the resolution of 15 × 15 × 5.5 μm3. In-plane orientations of the tracts are quantified by optic axis orientation. SOCS offers a new solution for complete reconstructions of macroscopic tissues such as primate and human brains at microscopic resolution. The technique also opens up varieties of opportunities for connectome studies and systematic investigations on neurological diseases and brain disorders.
Keywords: fiber pathways, nerve fiber orientation, connectivity, brain anatomy, optical coherence tomography, polarization
Introduction
Light microscopy has made tremendous contributions to our knowledge in neuroanatomy including conformation and function of neural cells in the brain over the past century. In recent years, more consensuses arise to realize the role communication pathways play in brain disorders such as autism and schizophrenia. Comprehensive navigation of the white matter routes imposes great challenges to the current imaging technologies. Traditional histology bears serious limitation as single axonal tract can extend up to centimeters long, and the structures of the axonal networks are extremely complicated. Inevitable distortion caused by tissue processing and embedding makes the alignment of sequential microscopy images extremely difficult and laborious (Yushkevich et al., 2006; Streicher et al., 2000). To overcome the problem, plane illumination microscopy (Huisken et al., 2004) and ultramicroscopy in combination with optical clearance technique (Dodt, et al., 2007; Jährling et al., 2009) eliminate mechanical sectioning and produce entire brain imaging of young mice with comparable resolution. Nevertheless, better optical clearance has yet to be developed for large scale reconstruction of the axonal networks in adult brain (Hama et al., 2011; Chung et al., 2013). Neural tracers in combination with fluorescent microscopy contribute to sensitive identification of local neural circuits. However, the timeline imposes significant obscure to establish the full connection map in a brain template, considering systematic characterization of thousands of injection sites on multiple samples (Bohland et al., 2009).
Firstly introduced in light microscopy (Odgaard et al, 1990), block-face imaging with electron microscopy (Denk and Horstmann, 2004), confocal microscopy (Sands, et al., 2005) and two-photon microscopy (Tsai et al., 2003; Ragan, et al., 2012) targets large scale synaptic connections or axonal networks in 3D space. The entire tissue block was mounted still and thin slices were removed between consecutive scans, the procedure of which yields automatically aligned image stacks in 3D. However, due to the high density of slicing and the point-scan scheme, complete reconstruction of complicated mammalian brains remains a hardly approachable proposition.
The recent advancements of optical coherence tomography (OCT) may shine a light to deal with the difficulties. OCT is an interferemetric technique that uses a broadband light source at near-infrared regime to produce depth resolved images (cross sections) of tissue structures at the micrometer scale resolution (Huang et al., 1991). Fourier domain OCT (Fercher et al., 1995) captures the information at all imaging depths with a single measurement, hence dramatically improving the imaging speed. Since invention, its application in peripheral nervous system such as retina has been rapidly translated to clinical studies and continuously supported by technical advances (Bernardes and Cunha-Vaz, 2012; Schuman, 2013). In contrast, the applications of OCT in central nervous system have been sparsely reported until very recently (early review by Boppart 2003, Nakaji et al., 2008, Arous et al., 2011, Wang et al., 2011, Srinivasan et al., 2012). After demonstrating the feasibility to differentiate the gray and white matter in the brain (Bizheva et al., 2004, Jeon et al., 2006), development of OCT probes to guide neurosurgical interventions has been presented (Jafri et al., 2005&2009, Liang et al., 2011). However, systematic studies on large-scale brain structures and white matter organizations have not been reported.
We develop a serial optical coherence scanner (SOCS) to accomplish large-scale volumetric imaging of ex-vivo brain and to reconstruct the nerve pathways in 3D. The optical system is a multi-contrast (MC) OCT that uses the polarization-maintaining fiber (PMF) technology and polarization-sensitive measurements to produce multi-parametric images (Wang et al., 2010, Wang et al., 2011). The multiple contrasts provide the anatomical information, the differentiation between the gray and the white matter, the fiber architectures, and the quantification of fiber orientations in the brain. With integrated tissue sectioning between serial scans, SOCS reconstructs a rat brain with axial resolution of 5.5 μm and transverse resolution of ~15 μm. The axonal networks are visualized and fiber tracts of various scales are traced.
Materials and methods
Tissue preparation
Three euthanized adult rats were obtained from the tissue sharing program with approval by the Research Animal Resources at the University of Minnesota. Brain was dissected and kept in 10% buffered formalin for 72 h before imaging.
System and data acquisition
Serial optical coherence scanner
SOCS integrates a tissue slicer into a MC-OCT system for reconstructing large-scale biological tissues in 3D. Schematic diagram of SOCS is demonstrated in Fig. 1A. The MC-OCT combines a PMF technique (Al-Qaisi 2008) and the spectral domain measurement to provide morphological and polarization sensitive imaging with high spatial-temporal resolution (Wang 2010). The light source is a broadband superluminescent diode operating at the center wavelength of 840 nm with a 50 nm bandwidth, yielding an axial resolution (z) of 5.5 μm in tissue (refractive index: ~1.4). Polarized light is directed through PMF coupler into the sample and reference arms. A scan lens in the sample arm ensures consistent imaging quality over a large area. The lateral resolution estimates ~15 μm (xy). Interferometric signals carrying the optical delay gate between reference light and back-scattered light from sample are detected by a customized spectrometer, which consists of a grating to disperse spectral components, a Wollaston prism to separate the PMF channels, and a lens to focus the spectra on a line-scan camera (Basler sprint 140k). Vertical and horizontal binning was applied on the camera to enhance photon collection. The spectra on the two polarization channels are acquired simultaneously at a rate of 25 kHz. An inverse Fourier transform of the spectral modulations (in k-space) produces a complex depth profile (A-line) for each channel A1,2(z)exp{iΦ1,2(z)}, where A and Φ denote the amplitude and phase, respectively, along the depth z, and 1 and 2 correspond to the cross-coupled and main polarization channels. The imaging contrasts are derived from amplitudes and phases of the depth profiles: reflectivity (R(z)), the traditional OCT contrast, is the addition of intensity on the two channels; cross polarization (C(z)) only takes the intensity of the cross-coupled channel; retardance (δ(z)) and optic axis orientation (ϑ(z)) are computed based on the Jones analysis (Götzinger et al., 2005). The equations for the contrasts are extracted as,
Figure 1.
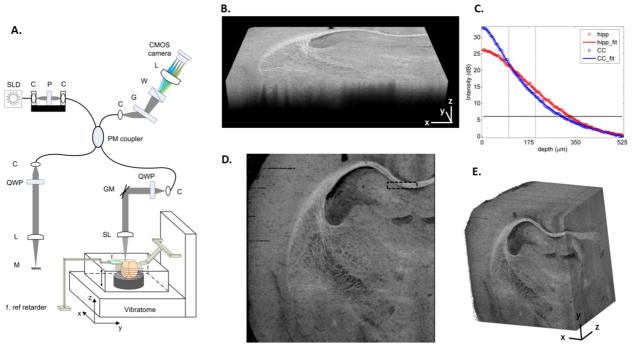
SOCS and reconstruction of rat brain images. (A) System schematic diagram. SLD, superluminscent diode; P, polarizer; C, collimator; QWP, quarter-wave plate; L, lens; M: mirror; GM, galvo mirror; SL, scan lens; G, grating; W, Wollaston prism; LSC, line scan camera. (B) Volumetric scan of an optical section. xz-plane represents the cross section, and xy-plane assembles the coronal section. (C) Depth profiles of reflectivity in hippocampus (red circles) and corpus callosum (blue circles). The plots present an average of 400 A-lines for each structure within the ROI in (D). Fifth-order polynomial fits were applied for the estimates of light penetration (solid lines). The horizontal line sets the intensity threshold at SNR > 6 dB for the estimation. The vertical lines indicate the slice thickness used in the current studies. (D) En-face image created from the optical section in (B) resembles the coronal view. The black rectangular box indicates the ROI used for the plots in (C). Scale bar: 500 μm. (E) Large scale brain imaging (7 × 7 × 5.5 mm3) is presented by stacking sequential en-face images (see also supplemental video 1). xy: coronal plane; yz: sagittal plane; xz: axial plane.
| (1) |
| (2) |
| (3) |
| (4) |
A volumetric scan (optical section) contains 300 cross-sectional frames (B-line) with 1000 A-lines in each frame, covering a field of view of 7×7×1.78 mm3 in xyz. The voxel size is 7×23×3.47 μm3, correspondingly. The pixel anisotropy in xy-plane is caused by the limitation of maximum B-lines that the current system can save in one optical scan.
During imaging, a vibratome (Leica Microsystems, Bannockburn, IL) is positioned under the sample path optics. The brain is mounted on the slicer and immersed in water. After imaging one optical section, a slice is removed by the vibratome, allowing deeper regions to be imaged. The procedure is repeated until the whole block is imaged. The thickness of the slice is less than the penetration depth of light, and it is optimally selected to ensure satisfactory SNR for high-quality 3D reconstruction of the entire sample. The water level and the imaging surface are controlled at constant heights during the scans.
Three brains were imaged in the current study, one sectioned in sagittal planes and two in coronal planes. The sagittal sections consist of 28 slices of 200 μm each, and compose the left hemisphere of the brain. The coronal sections in one brain consist of 66–100-μm slices, and cover the regions between frontal cortex and the middle portion of thalamus in the left hemisphere. To achieve reconstruction of entire coronal sections, for the third brain, two scans are performed between sequential slices. The optical scan head is laterally translated between the two scans. A 15% overlap is reserved for image registration.
Calibration of axis orientation
The optic axis orientation quantifies the in-plane orientation of neuronal tracts as a relative measure, because it bears a time-variant offset induced by environmental factors such as temperature change and movement of the optical fiber (Wang et al., 2010). To resolve this issue and obtain an absolute axis orientation measure, a retarder film was included as an active calibrating reference. The film was placed next to the brain and imaged together with the brain sections. The offset in the orientation measurement is hence determined as the optic axis of the retarder is known. Another issue is that large-scale lateral scans may affect the orientation measure by inducing polarization effects. By scanning a retarder at the same field of view as used for brain imaging, trends of the axis orientation in xy-plane are extracted prior to brain imaging and removed afterwards.
Data processing
With the depth profiles computed and saved from the raw spectra, the processing routines work as follows. Top surface of the tissue in cross sections is extracted from reflectivity contrast by an edge detection algorithm. The inclusion of viable data starts 35 μm below the surface to avoid a potential distortion caused by mechanical slicing. A tissue mask was created with a threshold of SNR > 6 dB. Image creation and quantitative analysis are conducted in the next based on the pre-processed frames. Unless otherwise stated, image processing and quantification algorithms were implemented in Matlab.
Reconstruction from en-face images
En-face image is the 2D projection of a 3D dataset on the xy-plane. The pixel values represent characteristic of the depth profiles. The contrast specific algorithms for image creation are described below.
Reflectivity
A 2×2 median filter was applied to the cross-sectional reflectivity images. The pixel values on the en-face were derived by the mean of the depth profiles. The depth range included in the computation matches the physical thickness of the slice.
Attenuation
Due to scatter and absorption, the intensity of light propagating in tissues exponentially decays with a medium-specific attenuation coefficient. We performed least-squares first-order polynomial fit on logarithmic reflectivity profiles, which present linear decreases along the axial direction. The slope of the linear function was used to form the en-face attenuation image. Data points up to 200 μm below surface were included in the fitting. The thickness was selected to minimize the effect of noise on the fit while keeping an optimal illustration of the microstructures.
Retardance
A 2×2 median filter was applied to the cross-sectional retardance images. Then, the en-face value was calculated by taking the mean of the retardance profile. The depth range used in calculation matches the physical slice thickness.
Axis orientation
A histogram based approach was developed to compute the en-face orientation. Histogram of the axis orientation for each A-line was computed at 5° intervals and fitted by a Gaussian function. The mean of the Gaussian function was used for the en-face orientation. When histogram presented two peaks centering at about ±90°, the lower and upper limits of measurement, circular shift was applied to form a continuous distribution before fitting. The depth range used in the histogram matches the physical slice thickness. Unless otherwise stated, representative orientation along a line or in a region of interest (ROI) was computed this way.
The en-face images generated from serial scans are stacked to form the 3D space of rat brain, without the necessity of additional registration between slices. The resolution along z-axis in this case is determined by the depth range used in the image calculation, and it matches the thickness of physical sections. Such constructions facilitate quick identification and global assessment of large-scale brain structures at a mesoscopic resolution. The volumetric data was visualized in Vaa3D (Peng et al., 2010).
To construct a complete coronal plane from two lateral scans in the third brain, we applied a pairwise stitching algorithm (Preibisch et al., 2009) on en-face reflectivity images using Fiji software. The algorithm computed the overlap between the scans which was then linearly blended to compose a full section. The registration parameters were saved and applied to all other contrast images of the same brain section. Orientation offset of the first scan (left hemisphere) was corrected with the reference retarder; however, the second scan (right hemisphere) utilized the white matter, typically the commissural fibers, in the overlapping region as a reference to compute and correct for the orientation offset. Another reference retarder could have been added for the second scan, but we decided to develop the serial correction method that uses internal references in the overlap between adjacent scans. More importantly, the method allows for reconstruction of larger samples, in which multi-grid scans are required and inclusion of external references in the center zone is problematic.
Reconstruction at the natural resolution of SOCS
Successful fusion of serial volumetric scans forms the basis of 3D reconstruction of the entire brain at the natural resolution of SOCS (15 × 15 × 5.5 um3). Cross polarization was utilized for this purpose. Carrying the properties of reflectivity and birefringence, the cross polarized light describes the nerve fibers and preserves decent signal intensity in deeper regions. The depth range of the optical section matches the physical slice thickness, but the starting point along depth is adjustable for optimal fusing outcome.
To achieve smooth transition between serial scans, trends along depth direction z were minimized by multiplying each A-line with a regularization function L(z),
| (5) |
where N is the number of points in each A-line, i is the slice index, ai and bi are local averages of intensities for the start and the end of A-lines in slice i. The operation minimizes the intensity mismatch across stitching borders, while maintaining the intensity at the central locations. Residual trends may be removed by advanced image processing algorithms.
Histology of brain slices
Brain slices were sent for histological validation after OCT imaging. Cresyl violet and Weil’s myelin stains were performed on selective coronal slices for labeling cell bodies and fiber tracts, respectively. We didn’t stain the sagittal sections because 200 μm slices are too thick for histological processing.
Results
The following sections demonstrate the results of SOCS imaging from three rat brains. Serial scans of coronal sections (Figs. 1–4, 5B), and those of sagittal sections (Figs. 5A, 6, 7) are presented.
Figure 4.
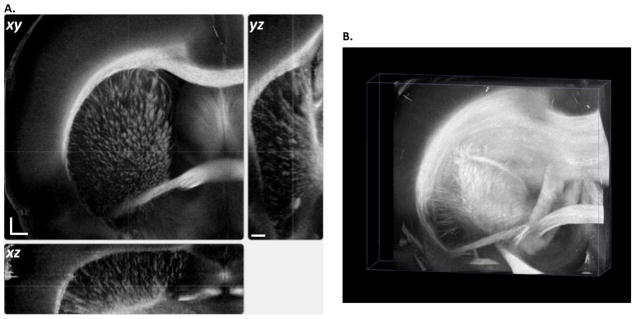
Global identity of 3D neuronal roadmaps in rat brain at the mesoscopic resolution (15 × 15 × 100 μm) is achieved by stacking en-face retardance images of the entire sample. (A) Orthogonal viewing planes: xy, coronal view; xz, axial view; yz, sagittal view. Scale bars: xy, 500 μm; z, 1 mm. (B) Volume rendering of the 3D dataset (7 × 7 × 5.5 mm3, see also supplemental video 2). Maximum projection illustrates the spatial organization of major fiber tracts in the brain.
Figure 5.

En-face orientation maps of sagittal (A) and coronal (B) sections show the in-plane orientation of fiber tracts. (A) Orientation image of a sagittal section around the midline is shown on the left with the magnified images of two ROIs. The anterior side is on the right, and the posterior is on the left. The value of orientation is color coded in HSV space according to the color wheel, and the brightness is controlled by the retardance which masks the gray matter. The associated anatomy (reflectivity image) is shown on the right. (B) Reconstruction of the entire coronal section. Overlap of the left and right scans is used to estimate the orientation offset of the second scan. Histogram and Gaussian fitting of the orientation difference are demonstrated. Stitching results for the entire coronal section are shown in the orientation and anatomy maps at the bottom. Scale bars: 500 μm.
Figure 6.

Stitching consecutive volume scans. (A) Reflectivity, cross polarization and birefringence images are available to reveal localized fiber tracts on cross sections. For contrast comparison, color blended images are shown on the right. The co-expression of cross-polarization (red) and reflectivity (green) is illustrated in yellow, and that of cross-polarization (red) and birefringence (blue) is in magenta. Scale bars: horizontal, 500 μm; vertical, 150 μm. (B) En-face cross polarization images are reconstructed at various depths (35, 85, 135 and 185 μm) to demonstrate consistent image quality within an optical section (a volume scan). Scale bar: 500 μm. (C) Stitching cross sections of consecutive volume scans (13 and 14). Same regions are covered in both scans, as exampled by the yellow boxes. The connected image is color coded (13 in red, and 14 in green), and fused image, after removal of depth-dependent trend, is in gray scale. Scale bars: horizontal, 500 μm; vertical, 150 μm. (D) En-face cross polarization images from the overlap region for each scan. Scale bar: 500 μm. The cross-correlation peaks at the origin.
Figure 7.

Reconstruction of rat brain at natural resolution of SOCS. (A) 3D reconstruction with orthogonal views, 1: horizontal, 2: sagittal, 3: coronal. (B) The horizontal planes are constructed by stitching the cross sectional images of serial scans. Most of the neuronal tracts appear bright, whereas the fibers oriented perpendicular to the illumination plane may appear rather dim. The rectangular ROI represents small fibers in the midbrain region exampled by an arrow in C. Surface plot (D) and intensity profile along a vertical line (E) clearly illustrate individual fiber tracts. (F) Trajectories of small fibers are shown on sequential sections along y-axis towards superior direction. The first image specifies the square ROI of B. Pixel sizes: 7 × 3.47 μm2 for B and F, and 7 × 7 μm2 (interpolated) for C. Scale bars: 500 μm in B and C, and 250 μm in F.
SOCS based brain atlas
SOCS provides morphology of tissue structures in a volumetric scan. As a representative optical section in Fig. 1B shows, the most visible nerve fibers manifest as bright spots or strips followed by fast attenuation in axial (z) direction. The transverse (xy) plane resembles a coronal section resolving the microscopic anatomy. The top ~35 μm section is not included in the image. To evaluate the light penetration in brain tissues, a ROI (black box in Fig. 1D) containing the hippocampus and the corpus callosum (cc) is selected, and the averaged reflectivity profiles in the ROI are plotted for the two structures (circles in Fig. 1C). Light propagating through cc undergoes faster decay with shallower penetration comparing to that through hippocampus. With a polynomial fit (solid curves) and a 6 dB intensity threshold, the imaging depths in the hippocampus and the cc are estimated as 330 μm and 298 μm, respectively. The physical slice thickness can be determined by a criterion that ensures sufficient SNR (e.g. 12 dB) for successful stitching of optical sections, while minimizing the load of slicing. Indicated by the gray lines in the plot, a thickness of 100–200 μm was favorable as described in the Method section.
The en-face reflectivity image generated from the optical section is presented in Fig. 1D. By stacking sequential en-face images, the left hemisphere of a rat brain is assembled in Figure 1E. The coronal section representing the en-face plane starts at Bregma −2.2 mm in front, and reaches Bregma 4.3 mm towards anterior direction. The dimension of the reconstructed brain in z-direction is currently limited by the maximum elevating distance of the mounting stage on the vibratome. Complete coverage can be achieved with a longer traveling distance of the stage. The en-face (xy) plane with a resolution of ~15 μm delineates the anatomy and preserves decent features of nerve fibers which exhibit intricate organizations. The resolution on z-axis is 100 μm for this sample. For smooth visualization, data was interpolated five times yielding a sampling pitch comparable to the resolution on xy-plane. Trajectories of long axonal tracts are visible on orthogonal planes (Fig. 1E and supplemental video 1). The size and the geometry of brain structures are better apprehended in 3D. The continuity and smoothness of fiber bundles on xz- and yz-planes confirms the quality of automatic alignment, which relieves the load of inter-slice registration and remarkably accelerates the reconstruction speed compared to conventional histology. Comprehensive 3D atlas of the brain supports high-level structural identification and quantifications such as segmentation, and also forms the basis for further investigations on the progress of neurological and psychiatric diseases.
En-face images of reflectivity, attenuation and retardance
Extracted from single dataset, the contrasts of SOCS provide multidimensional depiction of brain anatomy from different perspectives. En-face reflectivity distinguishes the gross structures with altered intensity, and keeps track of the small features by virtue of the superior sensitivity and dynamic range (Fig. 2A, D). Small features might not be easily recognized on global images due to the high dynamic range. For better visualization, local contrast enhancement was applied to selected ROIs with Fiji (Fig. 2, i, ii and iv). Retardance map targets the white matter and yields an integral delineation of the fiber routes (Fig. 2B, E). Attenuation image enriches the anatomical information by sustaining subdivision of a local structure with clear borders (Fig. 2C, F).
Figure 2.
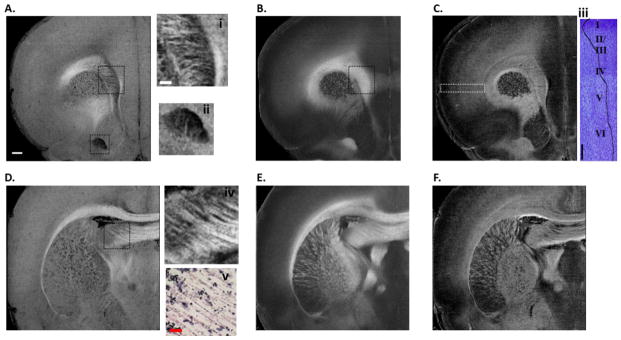
En-face images of reflectivity (A, D), retardance (B, E) and attenuation (C, F) for two coronal sections. Details of the ROIs in the reflectivity images manifest in i, ii and iv with local contrast enhancement implemented in Fiji. The spatial patterns of small fiber tracts are clearly visible. Fiber directions in iv demonstrate consistent result with the myelin stain in v (objective: 40×). The attenuation maps own a different signature. The cortical layers in somatosensory cortex are visible in the ROI on C. The attenuation values in the ROI were averaged along the vertical direction, the plot is then rotated clockwise by 90° (trace in iii), and displayed on top of the cresyl violet stain in the ROI (objective: 10×). Scale bars: 500 μm for coronal sections (A–F), 200 μm for ROIs (i, ii, iii and iv), and 30 μm for histology (v).
It is known that the reflective intensity of the white matter relies on the orientation of fiber tracts with respect to the illumination plane (Hebada et al., 1994; Wang et al., 2011). For coronal sections, the brightest regions on the reflectivity images are seen among the inter-hemispheric bundles such as cc when the fiber tracts travel parallel to the plane (Fig. 2D); and the intensity becomes minimum for the fibers running perpendicularly through the plane, observed as dark dots in the striatum (Fig. 2A, D). The variation of reflectivity brightness exposes the complexity of fiber organization in 3D space, but also reflects detailed in-plane architectures of the white matter. For example, within cc, irregular fiber patterns are visible against a dim medium (upper ROI in Fig. 2A, and i), indicating sharp turn and cross between the en-face plane and the orthogonal direction. Another demonstration is in the lower ROI that reflects interweaving fiber patterns at the lower border of anterior commissure (ac) (Fig. 2A, and ii). The regular pattern and direction of fibers in the fimbria of the hippocampus (fi) (ROI in Fig. 2D, and iv) is verified by myelin staining at higher magnification (x40) (Fig. 2D, v).
En-face retardance images clearly identify the fiber bundles and delineate the fiber paths. The intricacy of white matter in reflectivity images was released by retardance, where white matter consistently presents a positive contrast over gray matter regardless of the orientation (Fig. 2B, E). For example, fibers in the striatum which are dark in the reflective images are highlighted across coronal sections. The only exception would occur for fibers running about 90° throughout the en-face plane. In contrast to reflectivity, the consistent expression of birefringence leads to a more uniform portrait of the cc as shown in the ROI of Fig. 2B.
Attenuation maps favor the subdivision of local structures, facilitating the comprehension of spatial organizations and functional implications of fiber pathways (Fig. 2C & F). The layers of somatosensory cortex are distinguishable with alternating brightness (ROI in Fig. 2C), and the alternations are well correlated with the results from cresyl violet stain (Fig. 2C, iii). The morphology changes in the insular cortex below. In addition, the boundary between globus pallidus and striatum is clearly visible (Fig. 2F). The attenuation image also provides the capability to identify the white matter, most of which highly correlates with the retardance.
To correlate and compare the contrasts, we used color channels to fuse en-face images (Fig. 3A–C) of reflectivity (red), retardance (green), and attenuation (blue) into a composite image (Fig. 3D). The brightest region represents the fiber bundles lying parallel to the plane, while the fibers with large inclination angle are shown in blue-green color with missing identity of reflectivity. The myelinated fibers in layer V/VI of cortex extended from the cc are implied by the attenuation contrast in blue. The attenuation map could miss fiber routes highlighted by retardance (ROI in Fig. 3B & C). Cross sectional image indicates that those fibers are deeply located in the optical section (blue arrow in Fig. 3E), hence resulting in an irregular depth profile and a lower attenuation from a linear fit comparing with the adjacent gray matter (Fig. 3F). In contrast, retardance reliably captures the existence of the fiber bundle on the cross section (green arrow in Fig. 3E).
Figure 3.

Correlation and comparison between contrasts. Reflectivity (A), retardance (B), and attenuation (C) are color coded (A, red; B, green; C, blue), and merged in a composite image (D). Scale bar: 500 μm. Cross sectional images in E demonstrate the case that for deeply embedded fiber bundles (blue and green arrows), en-face attenuation might miss the identification (dark region of ROI in C); the bundle is positively detected by retardance. Scale bars: horizontal, 200 μm; vertical, 100 μm. Averaged depth profiles for the regions under the horizontal bars (blue and red) on E are plotted in F (blue circles and red dots) together with the linear fits (solid lines). The slope in the embedded bundle region (>100 μm) is large, but the overall slope appears smaller than that of the gray matter region.
Taken all the aspects together, en-face retardance offers the most robust detection for global description of the neuronal fibers at mesoscopic resolution. We use stacks of en-face retardance to portray the major fiber roadmap in 3D. Geometry and spatial organizations of neural pathways are captured on the orthogonal viewing planes (Fig. 4A). Maximum intensity projection of volume rendering provides a perspective view and discloses the complex configurations of the white matter in the brain (Fig. 4B, supplemental video 2).
Fiber orientations
Optic axis orientation offers quantitative assessment of fiber orientations in the illumination plane. Fig. 5A demonstrates the en-face orientation map (left) of a sagittal section around the midline of the brain along with the anatomical (en-face reflectivity) image on the right. The orientations of neuronal tracts generally agree with the geometry and directional features as revealed by the anatomical image. Gradually changing directions in the stria medullaris of thalamus are expressed as smooth color transitions according to the color wheel. The fibers of outer layer of cc align parallel to the plane, and the orientation change at the tail of genu of the cc (rectangular ROI in Fig. 5A) is clearly shown in the magnified image. The orientation map is also capable of uncovering groups of axonal bundles by differentiated directions such as fiber clusters within the thalamic area (round ROI in Fig. 5A), whereas the fiber tracts are hardly distinguishable in the anatomical image.
The orientation map of an entire coronal section is achieved by stitching the images of two scans (Fig. 5B). The orientation offset of the second scan with respect to the first was estimated in the overlap region: the difference in the commissural fibers (i – ii) was plotted in histogram and fitted by a Gaussian function, the mean of which represents the estimate of the offset. After stitching, the orientation map of the entire coronal section was demonstrated with the anatomy (bottom panels). As expected, orientations of cc, fi and fornix on contralateral sides exhibit symmetric colors with respect to the vertical line on the color wheel. The consistency of colors on the commissural fibers (cc and ac) at the inter-hemispheric region indicates a good match between the two scans. With this successful fusion, investigation of fiber orientations in large samples is plausible.
3D reconstruction of fiber maps in rat brain
Cross sectional images take advantage of depth resolved capability of the system (5.5 μm) to unveil microstructures that are not exhibited by en-face stacks. To achieve 3D reconstruction at the natural resolution of the SOCS, it is ideal to stack depth-resolved optical sections of the sequential scans. Three types of contrasts are viable to depict localized fiber tracts. These are reflectivity, cross polarization and birefringence as illustrated in Fig. 6A. The blended image of cross polarization (red) and reflectivity (green) shows that reflectivity loses the strength to elucidate fibers in deeper regions (red domination), and is inferior in suppressing the gray matter (green in non-fiber regions), albeit the equivalent expression of the fiber tracts in yellow at shallower locations. Color merged image of cross polarization (red) and birefringence (blue) exhibits co-identification of large fibers in magenta. However, the advantage of depth-localized identification by birefringence is compromised for small fibers. This is due to the extensive noise-reduction processing on retardance image for birefringence calculation, which smoothes the sharp features, leads to lower birefringence values and worsens the effective spatial resolution. Based on these comparisons, we utilized cross polarization to conduct inter-section stitching. We also examined cross polarization images on xy-plane at various depths. As shown in Fig. 6B, deterioration of image quality was not observed within the depth of consideration.
Stitching consecutive volume scans requires careful alignment. Fig. 6C shows two cross-sections from consecutive volume scans (section 13 and 14). The rectangular boxes indicate the same region, whose landmarks are used to examine the stitching quality. After connected along z-axis, the color blended image of the two scans demonstrates a decent overlap of the small and large fiber tracts. Moreover, the fused image after removing the trend of depth-dependent intensity exhibits a smooth transition. These images suggest that mechanical distortion due to slicing is negligible and additional registration is not in need for the preservation of lateral coordinates. For further confirmation, we constructed en-face images from the overlap region of the adjacent scans. For scan 13, data is located between 200 μm and 250 μm below surface; while for scan 14, data is selected from the top 50 μm. Fig. 6D shows that the two images are highly alike, despite the slight difference in lateral resolutions due to depth dependence of beam width within the depth of focus. Cross-correlation of the images peaks at the origin, indicating that no lateral shift was induced by slicing. These results demonstrate that the sequential images produced by serial scans can be successfully connected to reconstruct large tissues at high spatial resolution. Specifically, continuity of fiber tracts across the stitching border demonstrates the feasibility of tracing long axonal fiber bundles in the brain.
Reconstruction of the rat brain at the natural resolution of SOCS is viewed in orthogonal planes by using the cross-polarization contrast (Fig. 7A). The sagittal view (2) denotes the en-face plane with an isotropic resolution of 15 μm, and horizontal (1) and coronal (3) sections compose of stacks of cross-sectional images owning the resolution of 5.5 × 15 μm2. Although features in the commissural fibers like cc are not distinctive owing to the fiber orientation dependence of light intensity, geometry of the fiber bundles can be predicted. Images on the horizontal planes sensitively catch the fiber tracts (Fig. 7B and supplemental video 3), although residual stitching effect is still visible due to imperfect compensation of the depth-dependent trend. The tiny dots in the rectangular ROI are intersected fiber tracts on the sagittal view in the midbrain region (arrow in Fig. 7C). The dots are better visualized by a 3D surface plot (Fig. 7D) and intensity profile of a representative line (Fig. 7E). Estimated from full width at half maxima, the mean size of the tracts in the ROI is found to be about 23 μm. Trajectories of small fibers are recognized on the high resolution images as well. In Fig. 7F, fiber tracts emerging from the border of globus pallidus and running through striatum to cc are shown on sequential horizontal planes from ventral to dorsal direction. The images are separated by 25 μm and presented in two groups. The first group (0–100 μm) starts with the square ROI of Fig. 7B, and the second group is 500 μm away from the ROI. Overall, the integration of serial volumetric scans enables the multi-perspective and multi-scale inspections of the intricate neuronal roadmaps in the brain.
Discussion
We demonstrated a novel approach of SOCS to reconstruct large-scale neuroanatomical circuitry of brain at microscopic scale resolution. The imaging modality takes advantage of intrinsic optical properties of tissues to depict the anatomy of brain, especially the architectures of white matter within and between local structures, and the orientation of constituting fiber tracts. We described global fiber organizations by en-face image stacks, and inspected fiber tracts of various sizes at the natural resolution of SOCS by stacking serial scans.
The multiple contrasts generated from a single measurement of SOCS enlighten the exploration of neural pathways from different perspectives. The reflectivity highlights different types of scatters and their interface; hence, it unveils the fine features in a fiber bundle which are typically reported in histological images (Budde and Frank, 2012). On the other hand, the reflectivity contrast loses the depiction of fibers with large inclination angle. The attenuation contrast holds the general property of photon propagation in tissue. The characteristic is affected by cell type, density and alignment. Therefore, the attenuation images reveal the structures in gray matter such as cortex and subcortical regions in addition to fiber delineation. For white matter identification, the attenuation has a weaker dependence on the direction of fiber axis. Due to the limitation of first order fit on logarithmic depth profile, attenuation does not reflect the structure change in depth, resulting in miss identification of fiber tracts that occupy the lower portion of the imaging depth. Local attenuation image can be generated based on the derivative of depth profiles, but considerable noise-reduction procedures needs to be investigated in the future. Retardance provides a reliable identification of fiber tracts due to the birefringence property of myelination. Unlike histological images which merely describe the superficial features of a tissue slice, the retardance contrast enables deep fiber tracts emerge on the en-face images as well. Quantification of fiber orientation has been obtained through texture analysis on digital images (Budde and Frank, 2012; Goergen, et al., 2012). The optic axis orientation contrast of SOCS offers a direct access to in-plane fiber orientations, and 3D orientation could be realized with geometrical analysis on volumetric data. Owing to the unique merit of each contrast, an important future work is to translate and integrate the multi-contrast images into quantitative representations for the physical properties of neuronal networks such as fiber density and anisotropy, which will enable comparisons across various imaging modalities.
Complete reconstruction of neuronal connectivity maps has been prohibited in conventional histology because of the failure to track long fibers throughout the brain. Currently, diffusion magnetic resonance imaging (Basser et al., 1991) serves as the unique approach to sketch the fiber maps of in-vivo human brains at a resolution of ~2 mm. While pushing the resolution to submillimeter regime for distinguishing crossing fibers (Wedeen et al., 2012), the scanning time greatly increases up to tens of hours making it only available for ex-vivo studies (Augustinack et la., 2010). In addition, the technique needs to be validated which turns out to be another challenge (Seehaus et al., 2012).
To address the issue of full-scale brain imaging at microscopic resolution, speed of SOCS becomes a most appealing attribute. By adopting serial block-face design, SOCS automatically enables spatial alignment of the optical sections. Comparing to serial confocal (Sands, et al., 2005) and two photon microscopy (Ragan et al., 2012), SOCS is superior in light penetration, which alleviates the slicing load. Besides, SOCS acquires features along a depth profile simultaneously without requiring a mechanical scan, which shortens the imaging time further. Currently, the total time required for serial scans is limited by manual operations and speed of the vibratome. However, time for data acquisition alone for an entire rat brain is estimated to be ~1.5 hours with a voxel size of 6 × 6 ×3.5μm3 and the sectioning thickness of 200 μm. Future enhancement of optical resolution will necessitate finer grids and longer acquisition, but the speed of acquisition can be improved by a shorter integration time of the camera. Alternatively, imaging can be performed with swept-source technology, which can enhance the acquisition speed up to 50 times using a VCSEL source (Jayaraman et al., 2012). We envision that implementation of an automated serial scanner and development of post-processing tools will eventually lead comprehensive reconstruction of primate and human brains in a manageable time.
There are technical issues to be resolved for drawing comprehensive wiring diagrams in the brain. First of all, the dependence of reflectivity on fiber orientations causes missing identity of fiber tracts with large inclination angles. Similar observations have been reported in collagen networks with reflective confocal microscopy (Jawerth et al., 2009). To have a full viewing angle of the fiber tracts, multi-directional illuminative beams are appealing (Chalut et al., 2008; Yang et al., 2012). Another related issue is to measure the inclination angle, which will allow quantification of the 3D orientation of fiber tracts and the true birefringence. Variable-incidence angle has been incorporated to polarization-sensitive OCT to quantify the 3D axis orientation of a tendon sample (Ugryumova et al., 2006; Lu et al., 2011). In addition, current computations of retardance and axis orientation assume that in-plane axis does not change along depth in one optical section; however, this condition would not be satisfied in the regions where fiber crossing is widely observed. Quantification of depth-resolved true birefringence and 3D axis orientation is indispensible. Local birefringence and axis orientation in layered structures have been obtained by modified polarization-sensitive OCT setups and numerical analysis (Guo et al., 2004; Kemp et al., 2005; Fan and Yao, 2013). However, the capability to unveil more complex and heterogeneous patterns of the white matter in the brain has yet to be investigated.
The big challenge of obtaining comprehensive connectivity in the complex brain would be whether intrinsic contrasts are sufficient to visualize trajectory of distinctive fiber tracts within large bundles, including the commissural fibers, the association fibers and crossing fiber regions. The features on the fiber maps demonstrated the ability of SOCS to visualize interweaving fibers (Fig. 7C); however, the resolution must be improved to visualize individual axonal tracts at a fiber scale. Electron microscopy of corpus callosum reveals a dense package of axons with separations of 1–2 um (Mikula et al., 2012). The axial and lateral resolutions of SOCS can be improved by incorporating a broader bandwidth light source and a high numerical aperture lens, respectively. Using an optical coherence microscopy (OCM) system at 1300 nm wavelength, neurons and axonal fibers in different cortical layers were characterized (Srinivasan et al., 2012), and myofibers are visualized in different tissues (Goergen et al., 2012). The progressive development of plaques in Alzheimeric mouse brain was observed using an extended-focus OCM setup (Bolmont et al., 2012). With a full-field OCT setup, myelinated fiber tracts were visualized in central and peripheral nervous systems (Arous et al., 2011). However, systematic characterizations of white matter in the brain using ultrahigh resolution OCT have not been reported. The contrasts of SOCS can be utilized and investigated for brain imaging at the OCM resolution.
SOCS and its future advances open up intriguing applications in neurological and psychiatric disorders. As a new tool that offers multi-scale images and multi-parametric quantitative analysis, SOCS may lead to unprecedented discoveries of anatomical changes in population neurons and fiber networks of pathological brains, building up our current knowledge in multiple sclerosis, Parkinson’s, Alzheimer’s, autism and schizophrenia.
Supplementary Material
Video 1. Reconstruction of a rat brain (left hemisphere) by stacking the en-face reflectivity images.
Video 2. Global neural roadmaps in a rat brain (left hemisphere) are reconstructed by stacking the en-face retardance images. Maximum projection is used for 3D visualization.
Video 3. Neuronal fiber tracts in a rat brain are visualized by using the cross-polarization contrast at the resolution of SOCS. Frames show horizontal planes from inferior to superior direction.
Highlights.
Serial optical coherence scanner enables large-scale volumetric imaging at microscopic resolution.
Ex-vivo rat brain is reconstructed and global neural roadmaps are depicted in 3D.
Trajectories of fiber tracts are visualized at the resolution of 15 × 15 × 5.5 μm3.
Fiber orientation is quantified with optical measurement.
Acknowledgments
This work was supported by the Graduate School Doctoral Dissertation Fellowship at the University of Minnesota (to HW), and a research grant from National Institute of Biomedical Imaging and Bioengineering of the US National Institutes of Health (NIH, R01 EB012538). The authors thank Dr. Theoden Netoff for generously offering the vibratome slicer, Heidi Rohrich and Core Grant for Vision Research (NIH, P30 EY11374) for histology, and Minnesota Supercomputing Institute for the high-performance computing resources.
Footnotes
Publisher's Disclaimer: This is a PDF file of an unedited manuscript that has been accepted for publication. As a service to our customers we are providing this early version of the manuscript. The manuscript will undergo copyediting, typesetting, and review of the resulting proof before it is published in its final citable form. Please note that during the production process errors may be discovered which could affect the content, and all legal disclaimers that apply to the journal pertain.
References
- Al-Qaisi MK, Akkin T. Polarization-sensitive optical coherence tomography based on polarizationmaintaining fibers and frequency multiplexing. Opt Express. 2008;16:13032–13041. doi: 10.1364/oe.16.013032. [DOI] [PubMed] [Google Scholar]
- Arous BJ, Binding J, Léger JF, Casado M, Topilko P, Gigan S, Boccara AC, Bourdieu L. Single myelin fiber imaging in living rodents without labeling by deep optical coherence microscopy. J Biomed Opt. 2011;16:116012. doi: 10.1117/1.3650770. [DOI] [PubMed] [Google Scholar]
- Augustinack JC, Helmer K, Huber KE, Kakunoori S, Zöllei L, Fischl B. Direct visualization of the perforant pathway in the human brain with ex vivo diffusion tensor imaging. Front Hum Neurosci. 2010;4:42. doi: 10.3389/fnhum.2010.00042. [DOI] [PMC free article] [PubMed] [Google Scholar]
- Basser PJ, Mattiello J, Le Bihan D. Estimation of the effective self-diffusion tensor from the NMR spin-echo. J Magn Reson B. 1994;103:247–254. doi: 10.1006/jmrb.1994.1037. [DOI] [PubMed] [Google Scholar]
- Bernardes R, Cunha-Vaz JG. SpringerLink (Online service) Berlin; New York: Springer; 2012. Optical coherence tomography a clinical and technical update. [Google Scholar]
- Bizheva K, Unterhuber A, Hermann B, Povazay B, Sattmann H, Drexler W, Stingl A, Le T, Mei M, Holzwarth R, Reitsamer HA, Morgan JE, Cowey A. Imaging ex vivo and in vitro brain morphology in animal models with ultrahigh resolution optical coherence tomography. J Biomed Opt. 2004;9:719–24. doi: 10.1117/1.1756920. [DOI] [PubMed] [Google Scholar]
- Bohland JW, Wu C, Barbas H, Bokil H, Bota M, et al. A proposal for a coordinated effort for the determination of brainwide neuroanatomical connectivity in model organisms at a mesoscopic scale. PLoS Comput Biol. 2009;5:e1000334. doi: 10.1371/journal.pcbi.1000334. [DOI] [PMC free article] [PubMed] [Google Scholar]
- Bolmont T, Bouwens A, Pache C, Dimitrov M, Berclaz C, Villiger M, Wegenast-Braun BM, Lasser T, Fraering PC. Label-free imaging of cerebral β-amyloidosis with extended-focus optical coherence microscopy. J Neurosci. 2012;32:14548–56. doi: 10.1523/JNEUROSCI.0925-12.2012. [DOI] [PMC free article] [PubMed] [Google Scholar]
- Boppart SA. Optical coherence tomography: Technology and applications for neuroimaging. Psychophysiology. 2003;40:529–541. doi: 10.1111/1469-8986.00055. [DOI] [PubMed] [Google Scholar]
- Budde MD, Frank JA. Examining brain microstructure using structure tensor analysis of histological sections. NeuroImage. 2012;63:1–10. doi: 10.1016/j.neuroimage.2012.06.042. [DOI] [PubMed] [Google Scholar]
- Chalut KJ, Chen S, Finan JD, Giacomelli MG, Guilak F, Leong KW, Wax A. Lable-free, high-throughput measurements of dynamic changes in cell nuclei using angle-resolved low coherence interferometry. Biophysical Journal. 2008;94:4948–4956. doi: 10.1529/biophysj.107.124107. [DOI] [PMC free article] [PubMed] [Google Scholar]
- Chung K, Wallace J, Kiim SY, Kalyanasundaram S, Andalman AS, Davidson TJ, Mirzabekov JJ, Zalocusky KA, Mattis J, Denisin AK, Pak S, Bernstein H, Ramakrishnan C, Grosenick L, Gradinaru V, Deisseroth K. Strucutral and molecular interrogation of intact biological systems. Nature. 2013;497:332–337. doi: 10.1038/nature12107. [DOI] [PMC free article] [PubMed] [Google Scholar]
- Denk W, Horstmann H. Serial block-face scanning electron microscopy to reconstruct three-dimensional tissue nanostructure. PLoS Biol. 2004;2:e329. doi: 10.1371/journal.pbio.0020329. [DOI] [PMC free article] [PubMed] [Google Scholar]
- Dodt HU, Leischner U, Schierloh A, Jährling N, Mauch CP, Deininger K, Deussing JM, Eder M, Zieglgänsberger W, Becker K. Ultramicroscopy: three-dimensional visualization of neuronal networks in the whole mouse brain. Nat Methods. 2007;4:331–336. doi: 10.1038/nmeth1036. [DOI] [PubMed] [Google Scholar]
- Fan C, Yao G. Imaging myocardial fiber orientation using polarization sensitive optical coherence tomography. Biomed Opt Express. 2013;4:460–465. doi: 10.1364/BOE.4.000460. [DOI] [PMC free article] [PubMed] [Google Scholar]
- Fercher AF, Hitzenberger CK, Kamp G, El-Zaiat SY. Measurement of intraocular distances by backscattering spectral interferometry. Opt Commun. 1995;117:43–45. [Google Scholar]
- Goergen CJ, Radhakrishnan H, Sakadžić S, Mandeville ET, Lo eh, Sosnovik DE, Srinivasan VJ. Optical coherence tractography using intrinsic contrast. Opt Lett. 2012;37:3882–3884. doi: 10.1364/ol.37.003882. [DOI] [PMC free article] [PubMed] [Google Scholar]
- Götzinger E, Pircher M, Hitzenberger CK. High speed spectral domain polarization sensitive optical coherence tomography of the human retina. Opt Express. 2005;13:10217–10229. doi: 10.1364/opex.13.010217. [DOI] [PMC free article] [PubMed] [Google Scholar]
- Guo S, Zhang J, Wang L, Nelson JS, Chen Z. Depth-resolved birefringence and differential optical axis orientation measurements with ber-based polarization-sensitive optical coherence tomography. Opt Lett. 2004;29:2025–2027. doi: 10.1364/ol.29.002025. [DOI] [PubMed] [Google Scholar]
- Hama H, Kurokawa H, Kawano H, Ando R, Shimogori T, Noda H, Fukami K, Sakaue-Sawano A, Miyawaki A. Scale: a chemical approach for fluorescence imaging and reconstruction of transparent mouse brain. Nat Neurosci. 2011;14:1481–1488. doi: 10.1038/nn.2928. [DOI] [PubMed] [Google Scholar]
- Hebeda KM, Menovsky T, Beek JF, Wolbers JG, van Gemert MJC. Light propagation in the brain depends on nerve fiber orientation. Neurosurgery. 1994;35:720–724. doi: 10.1227/00006123-199410000-00019. [DOI] [PubMed] [Google Scholar]
- Huang D, Swanson EA, Lin CP, Schuman JS, Stinson WG, Chang W, Hee MR, Flotte T, Gregory K, Pu alito CA, Fujimoto JG. Optical coherence tomography. Science. 1991;254:1178–1181. doi: 10.1126/science.1957169. [DOI] [PMC free article] [PubMed] [Google Scholar]
- Huisken J, Swoger J, Del Bene F, Wittbrodt J, Stelzer EH. Optical sectioning deep inside live embryos by selective plane illumination microscopy. Science. 2004;305:1007–1009. doi: 10.1126/science.1100035. [DOI] [PubMed] [Google Scholar]
- Jafri MS, Farhang S, Tang RS, Desai N, Fishman PS, Rohwer RG, Tang CM, Schmitt JM. Optical coherence tomography in the diagnosis and treatment of neurological disorders. J Biomed Opt. 2005;10:051603. doi: 10.1117/1.2116967. [DOI] [PubMed] [Google Scholar]
- Jafri MS, Tang R, Tang CM. Optical coherence tomography guided neurosurgical procedures in small rodents. J Neurosci Methods. 2009;176:85–95. doi: 10.1016/j.jneumeth.2008.08.038. [DOI] [PubMed] [Google Scholar]
- Jährling N, Becker K, Dodt HU. 3D-reconstruction of blood vessels by ultramicroscopy. Organogenesis. 2009;5:145–148. doi: 10.4161/org.5.4.10403. [DOI] [PMC free article] [PubMed] [Google Scholar]
- Jawerth LM, Münster S, Vader DA, Fabry B, Weitz DA. A Blind Spot in Confocal Re ection Microscopy: The Dependence of Fiber Brightness on Fiber Orientation in Imaging Biopolymer Networks. Biophysical Journal. 2009;98:L01–L03. doi: 10.1016/j.bpj.2009.09.065. [DOI] [PMC free article] [PubMed] [Google Scholar]
- Jayaraman V, Cole GD, Robertson M, Burgner C, John D, Uddin A, Cable A. Rapidly swept, ultra-widely-tunable 1060 nm MEMS-VCSELs. Electron Lett. 2012;48:1331–1333. doi: 10.1049/el.2012.3180. [DOI] [PMC free article] [PubMed] [Google Scholar]
- Jayaraman V, Jiang J, Potsaid B, Cole G, Fujimoto J, Cable A. Design and performance of broadly tunable, narrow line-width, high repetition rate 1310 nm VCSELs for swept source optical coherence tomography. Proc SPIE. 2012:8276. [Google Scholar]
- Jeon SW, Shure MA, Baker KB, Huang D, Rollins AM, Chahlavi A, Rezai AR. A feasibility study of optical coherence tomography for guiding deep brain probes. J Neurosci Methods. 2006;154:96–101. doi: 10.1016/j.jneumeth.2005.12.008. [DOI] [PMC free article] [PubMed] [Google Scholar]
- Kemp NJ, Zaatari HN, Park J, Rylander HG, III, Thomas M. Depth-resolved optic axis orientation in multiple layered anisotropic tissues measured with enhanced polarization-sensitive optical coherence tomography (EPS-OCT) Opt Express. 2005;13:4507–4518. doi: 10.1364/opex.13.004507. [DOI] [PubMed] [Google Scholar]
- Liang CP, Wierwille J, Moreira T, Schwartzbauer G, Jafri MS, Tang CM, Chen Y. A Forward-Imaging Needle-Type OCT Probe for Image Guided Stereotactic Procedures. Opt Express. 2011;19:26283–26294. doi: 10.1364/OE.19.026283. [DOI] [PMC free article] [PubMed] [Google Scholar]
- Lu Z, Kasaragod DK, Matcher SJ. Optic axis determination by bre-based polarization-sensitive swept-source optical coherence tomography. Phys Med Biol. 2011;56:1105–1122. doi: 10.1088/0031-9155/56/4/014. [DOI] [PubMed] [Google Scholar]
- Mikula S, Binding J, Denk W. Staining and embedding the whole mouse brain for electron microscopy. Nat Methods. 2012;9:1198–1201. doi: 10.1038/nmeth.2213. [DOI] [PubMed] [Google Scholar]
- Nakaji H, Kouyama N, Muragaki Y, Kawakami Y, Iseki H. Localization of nerve ber bundles by polarization-sensitive optical coherence tomography. J Neurosci Methods. 2008;174:82–90. doi: 10.1016/j.jneumeth.2008.07.004. [DOI] [PubMed] [Google Scholar]
- Odgaard A, Andersen K, Melsen F, Gundersen HJ. J Microsc. 1990;159:335–342. doi: 10.1111/j.1365-2818.1990.tb03038.x. [DOI] [PubMed] [Google Scholar]
- Peng H, Ruan Z, Long F, Simpson JH, Myers E. V3D enables real-time 3D visualization and quantitative analysis of large-scale biological image data sets. Nat Biotechnol. 2010;28:348–353. doi: 10.1038/nbt.1612. [DOI] [PMC free article] [PubMed] [Google Scholar]
- Preibisch S, Saalfeld S, Tomancak P. Globally optimal stitching of tiled 3D microscopic image acquisitions. Bioinformatics. 2009;25:1463–1465. doi: 10.1093/bioinformatics/btp184. [DOI] [PMC free article] [PubMed] [Google Scholar]
- Ragan T, Kadiri LR, Venkataraju KU, Bahlmann K, Sutin J, Taranda J, Arganda-Carreras I, Kim Y, Seung SH, Osten P. Serial two-photon tomography for automated ex vivo mouse brain imaging. Nat Methods. 2012;9:255–258. doi: 10.1038/nmeth.1854. [DOI] [PMC free article] [PubMed] [Google Scholar]
- Sands GB, Gerneke DA, Hooks DA, Green CR, Smaill BH, Legrice IJ. Automated imaging of extended tissue volumes using confocal microscopy. Microsc Res Tech. 2005;67:227–239. doi: 10.1002/jemt.20200. [DOI] [PubMed] [Google Scholar]
- Schuman JS. Optical coherence tomography of ocular diseases. 3. Thorofare, NJ: SLACK Inc; 2013. [Google Scholar]
- Seehaus AK, Roebroeck A, Chiry O, Kim DS, Ronen I, Bratzke H, Goebel R, Galuske RAW. Histological Validation of DW-MRI Tractography in Human Postmortem Tissue. Cerebral Cortex. 2013;23:442–450. doi: 10.1093/cercor/bhs036. [DOI] [PMC free article] [PubMed] [Google Scholar]
- Srinivasan VJ, Radhakrishnan H, Jiang JY, Barry S, Cable AE. Optical coherence microscopy for deep tissue imaging of the cerebral cortex with intrinsic contrast. Opt Express. 2012;20:2220–2239. doi: 10.1364/OE.20.002220. [DOI] [PMC free article] [PubMed] [Google Scholar]
- Streicher J, Donat MA, Strauss B, Spörle R, Schughart K, Müller GB. Computer-based three-dimensional visualization of developmental gene expression. Nat Genet. 2000;25:147–152. doi: 10.1038/75989. [DOI] [PubMed] [Google Scholar]
- Tsai PS, Friedman B, Ifarraguerri AI, Thompson BD, Lev-Ram V, Schaffer CB, Xiong Q, Tsien RY, Squier JA, Kleinfeld D. All-optical histology using ultrashort laser pulses. Neuron. 2003;39:27–41. doi: 10.1016/s0896-6273(03)00370-2. [DOI] [PubMed] [Google Scholar]
- Yushkevich PA, Avants BB, Ng L, Hawrylycz M, Burstein PD, Zhang H, Gee JC. 3D Mouse Brain Reconstruction from Histology Using a Coarse-to-Fine Approach. Lecture Notes in Computer Science Volume. 2006;4057:230–237. [Google Scholar]
- Ugryumova N, Gangnus SV, Matcher SJ. Three-dimensional optic axis determination using variable incidence-angle polarization-optical coherence tomography. Opt Lett. 2006;31:2305–2307. doi: 10.1364/ol.31.002305. [DOI] [PubMed] [Google Scholar]
- Wang H, Black AJ, Zhu JF, Stigen TW, Al-Qaisi MK, Netoff TI, Abosch A, Akkin T. Reconstructing micrometer-scale fiber pathways in the brain: multi-contrast optical coherence tomography based tractography. Neuroimage. 2011;58:984–992. doi: 10.1016/j.neuroimage.2011.07.005. [DOI] [PMC free article] [PubMed] [Google Scholar]
- Wang H, Al-Qaisi MK, Akkin T. Polarization-maintaining ber based polarization-sensitive optical coherence tomography in spectral domain. Opt Lett. 2010;35:154–156. doi: 10.1364/OL.35.000154. [DOI] [PubMed] [Google Scholar]
- Wedeen VJ, Rosene DL, Wang R, Dai G, Mortazavi F, Hagmann P, Kaas JH, Tseng WI. The Geometric Structure of the Brain Fiber Pathways. Science. 2012;335:1628–1634. doi: 10.1126/science.1215280. [DOI] [PMC free article] [PubMed] [Google Scholar]
- Yang Y, Wang T, Zhu Q. Quantitative analysis of angle-resolved scattering properties of ovarian tissue using optical coherence tomography. J Biomed Opt. 2012;17:090503. doi: 10.1117/1.JBO.17.9.090503. [DOI] [PMC free article] [PubMed] [Google Scholar]
Associated Data
This section collects any data citations, data availability statements, or supplementary materials included in this article.
Supplementary Materials
Video 1. Reconstruction of a rat brain (left hemisphere) by stacking the en-face reflectivity images.
Video 2. Global neural roadmaps in a rat brain (left hemisphere) are reconstructed by stacking the en-face retardance images. Maximum projection is used for 3D visualization.
Video 3. Neuronal fiber tracts in a rat brain are visualized by using the cross-polarization contrast at the resolution of SOCS. Frames show horizontal planes from inferior to superior direction.