

Abstract
One account of the early versus late selection debate in attention proposes that perceptual load determines the locus of selection. Attention selects stimuli at a late processing level under low-load conditions but selects stimuli at an early level under high-load conditions. Despite the successes of perceptual load theory, a non-circular definition of perceptual load remains elusive. We investigated the factors that influence perceptual load by using manipulations that have been studied extensively in visual search, namely target-distractor similarity and distractor-distractor similarity. Consistent with previous work, search was most efficient when targets and distractors were dissimilar and the displays contained homogeneous distractors; search became less efficient when target-distractor similarity increased irrespective of display heterogeneity. Importantly, we used these same stimuli in a typical perceptual load task that measured attentional spill-over to a task-irrelevant flanker. We found a strong correspondence between search efficiency and perceptual load; stimuli that generated efficient searches produced flanker interference effects, suggesting that such displays involved low perceptual load. Flanker interference effects were reduced in displays that produced less efficient searches. Furthermore, our results demonstrate that search difficulty, as measured by search intercept, has little bearing on perceptual load. These results suggest that perceptual load might be defined in part by well-characterized, continuous factors that influence visual search.
Keywords: perceptual load, selective attention, visual search, search efficiency, search difficulty
The environment is rich with visual information – so much so that it is exceedingly difficult for the visual system to simultaneously identify all incoming stimuli (Mozer, 1991). The selection of certain visual stimuli over other stimuli is necessary in order to effectively interact with the environment. This attentional selection process can bias processing of stimuli that are currently task relevant (e.g., Folk, Remington, & Johnston, 1992; Treisman, 1969). However, attentional selection is not always perfect; irrelevant stimuli can capture attention, as demonstrated by increased response times (RTs) when salient distractors are present in a display compared to when they are absent (e.g., Duncan, 1980; Theeuwes, 1991, 1994).
Perceptual load is one factor that affects the overall selectivity of attention, that is, when attention remains highly selective versus when it spills-over to irrelevant items. Perhaps the most influential account of how perceptual load affects selectivity is Lavie and colleagues' perceptual load theory (Lavie, 1995; Lavie & Tsal, 1994; Lavie, Hirst, de Fockert, & Viding, 2004). When perceptual load is low, there is relatively little selectivity and processing resources mandatorily spill-over to task-irrelevant information; in contrast, when perceptual load is high, the system is forced to ignore a subset of task-irrelevant visual information at the benefit of task-relevant information.
Most of the early work on perceptual load employed a modified Eriksen flanker task (e.g., Eriksen & Hoffman, 1973; Eriksen & Eriksen, 1974) to assess the degree of attentional selectivity. In the flanker task, participants search for a target letter and report its identity; a task-irrelevant flanker appears somewhere in the display, and this flanker can be congruent or incongruent with the target's identity. If the flanker receives attentional resources and is recognized, then participants are faster on trials in which the flanker is congruent or neutral with the target than when it is incongruent with the target. Importantly, this flanker effect is modulated by the perceptual load of a search display (Lavie, 1995; but see Miller, 1991): In low perceptual load displays, the target appears alone or ‘pops out’ of the display; response times (RTs) in these low load displays show a flanker effect, indicating that attention is not perfectly selective and spills-over thereby allowing the flanker to be processed in addition to the target. In canonical high perceptual load displays, the target is embedded amongst an array of heterogeneous distractors; these high load displays yield no flanker effect, indicating that attention is highly selective.
Although the construct of perceptual load has been used countless times as an important experimental manipulation (e.g., Dark, Johnston, Myles-Worsley, & Farah, 1985; Handy & Mangun, 2000; Handy, Soltani, & Mangun, 2001; Kahneman & Chajczyk, 1983; Miller, 1991; Yantis & Johnston, 1990; Yi, Woodman, Widders, Marois, & Chun, 2004), few studies have systematically explored a continuous, independent operational definition of the construct of perceptual load (see Torralbo & Beck, 2008 for a recent account). At face value, perceptual load is putatively related to the complexity of a display or visual scene. Early work on operationally defining perceptual load led to the assertion that set size may serve as an important determinant (Lavie & Cox, 1997), but other manipulations of perceptual load have not involved set size; for example, target degradation and the discriminability of two targets that need to be distinguished have been used to operationalize high and low load displays (Handy & Mangun, 2000). Thus, there is not a clear understanding of what perceptual load represents. Consequently, we can only speculate at comparisons between inter-dimensional perceptual load manipulations.
Beyond the face validity drawbacks of perceptual load manipulations, a larger problem looms in the literature: often, perceptual load is circularly defined. To the extent that flanker effects are observed in a given search task, it is assumed that perceptual load was sufficiently low to allow flanker processing, whereas the absence of a flanker effect is taken as evidence of high perceptual load. However, typically if one inquires about the underlying cause of the presence or absence of a flanker effect, the answer invariably involves describing the displays as involving low or high perceptual load.
Although few studies have addressed this issue, recent work by Torralbo and Beck (2008) attempted to resolve this circularity by providing a definition of load that draws from biased competition theory (Desimone & Duncan, 1995). As noted above, in a low load search task, the target differs substantially from non-targets and ‘pops out’ of the display, whereas in high load search tasks the target does not ‘pop out.’ Torralbo and Beck (2008) proposed that the magnitude of featural overlap between the target and the distractors sets the level of competitive interaction between items in the search display (e.g., Beck & Kastner, 2005). Competitive interactions, in turn, alter the strength with which top-down attention operates to select the target. Thus, when the target is easily selected (e.g., if it ‘pops out’), top-down attention operates weakly and the task-irrelevant flanker is more likely to be processed; however, when target selection is difficult, top-down attention must operate more strongly to bias processing in favor of the target, often at the expense of the task-irrelevant flanker.
Although Torralbo and Beck (2008) used crowding and visual hemifield manipulations to provide support for the notion that competition could be used to define perceptual load in an a priori manner, the extent to which other stimulus factors may contribute to perceptual load effects is unknown. Furthermore, it is unclear how the manipulations of stimulus competition in the Torralbo and Beck (2008) work map onto more canonical manipulations of perceptual load.
Previous tests of perceptual load have typically confounded target-distractor (T-D) similarity and distractor-distractor (D-D) similarity. Low load displays often employ targets that are perceptually distinct from homogeneous distractors, whereas high load displays incorporate targets that resemble heterogeneous distractors (for examples of such displays, see Lavie, 1995 and Lavie & Cox, 1997). To assess the individual contribution of T-D similarity and distractor-distractor D-D similarity on perceptual load, it is necessary to orthogonally manipulate these two factors. Hence, in the current study we examined the same T-D and D-D relational configurations proposed by Duncan and Humphreys (1989) and directly assessed their influence in generating perceptual load effects.
Duncan and Humphreys (1989) demonstrated that both T-D similarity and D-D similarity affected the efficiency of visual search. When searching for a letter “L”, search slopes were greatest when the distractors were perceptually similar to the target (e.g., Ts rotated 180° and 270°) and dissimilar to one another (heterogeneous); search was more efficient when the distractors were dissimilar from the target and similar to each other (homogeneous). Based on these results, Duncan and Humphreys (1989) proposed that search efficiency lies on a continuum based on stimulus similarity. This and related work formed the basis for biased competition theory (Desimone & Duncan, 1995; Bundesen, 1990).
The primary goal of the current work was to examine whether factors known to influence attentional control over search efficiency — beyond set size — also influence perceptual load. In three separate experiments, we manipulated T-D and D-D similarity while participants completed: (1) a basic visual search task in which T-D and D-D similarity varied, and (2) a canonical perceptual load task that incorporated the same stimuli as the visual search task (see Figure 1). Across experiments, we confirmed Duncan and Humphreys' (1989) finding that search efficiency is greatest under low T-D similarity and high D-D similarity but gradually decreases as T-D similarity increases irrespective of D-D similarity. Similar patterns were obtained for the perceptual load task, which suggests a high degree of correspondence between the mechanisms influencing search efficiency and those generating perceptual load effects. We found that the degree to which a given distractor set produces inefficient search, as measured by search slope, was strongly correlated with the magnitude of the distractor interference effect engendered by the very same distractor set in the perceptual load task. Furthermore, regression analyses revealed that T-D similarity, as opposed to D-D similarity, is highly predictive of search slope in the visual search task and of the magnitude of the flanker effect in a canonical perceptual load task. Thus, search efficiency directly influences processing of task-irrelevant information and can be used as a proxy for perceptual load, providing support for the notion that differences in the strength with which attentional selection can be deployed across display types play a critical role in determining perceptual load effects. In short, we propose that search efficiency based on T-D similarity and D-D similarity provides an independent definition of perceptual load that avoids the circularity inherent in many previous studies.
Figure 1. Table depicting example stimulus arrays for the visual search and perceptual load tasks.

The target was the letter ‘T’ tilted 90 degrees to the left or right. Display size of 12 is depicted but display sizes 4, 8, and 12 were used in the visual search task (see Methods Section of EXP 1 for more details). Example stimulus arrays are not drawn to scale
Experiment 1
Participants
Twenty-four University of Iowa undergraduates participated in a single study session for course credit. All participants had normal or corrected-to-normal vision.
Stimuli and Procedure
A Mac mini computer displayed stimuli on a 17-in. CRT monitor and recorded responses and response latencies. The resolution was set at 1024 × 768 pixels with a refresh rate of 80 Hz. The experiment was controlled using MATLAB software with Psychophysics Toolbox Version 3 (Brainard, 1997).
Participants sat approximately 55 cm from the monitor in a dimly lit room. For each session, the order of the visual search task and the perceptual load task (c.f. Lavie & Cox, 1997) was counterbalaced across participants. The target was always the letter “T” tilted 90° to the left or to the right, and participants reported the orientation of the target via keyboard button press (either the ‘Z’ key or the ‘/?’ key). Targets and distractors subtended a visual angle of 2.05° by 2.05°
Distractors
Figure 1 depicts the stimuli used across the experiments. Low T-D similarity distractors were circles with a gap to one of four sides. High T-D similarity distractors were the letter “L” with equal-length line segments and were displayed in the canonical orientations of 0°, 90°, 180°, or 270°. This led to eight unique distractors for Experiment 1. Bauer, Jolicoeur, and Cowan (1996a) have developed a model for heterogeneity that incorporates the differences between distractors, the total number of distractors and the ratio of distractor types. On the basis of that model, we created maximal D-D similarity displays by presenting completely homogeneous distractors. D-D similarity was decreased to its minimum by presenting heterogeneous distractors; however, because the tasks required display set sizes that exceeded the total number of unique distractors per condition, entropy was carefully maintained by keeping distractor type ratios as constant as possible across heterogeneous trials. In a given trial, the same distractor never appeared more than three times when 12 items were displayed, no more than twice when 7 items (perceptual load task) or 8 items were displayed and no more than once when 4 items were displayed.
Visual Search Task
The visual search task incorporated displays containing 4, 8, or 12 items. Crowding was controlled such that four items appeared in a given quadrant of a 20° × 20° imaginary square – search was contained in 1, 2, or 3 quadrants depending upon whether set size was 4, 8, or 12 items respectively (see Figure 1 for example stimulus arrays). Quadrants were separated by a distance of 3.3° visual angle. The minimum distance between stimuli was 2.64° of visual angle from edge to edge. The search displays were presented until participants responded.
Before experimental blocks, participants performed 24 practice trials that included eight trials of each display size and six trials of each distractor type. Display size was intermixed while distractor type was blocked. Participants performed 96 experimental trials per block for a total of 384 visual search observations.
Perceptual Load Task
The perceptual load task was a replication of Lavie and Cox (1997) except for the identity of targets and distractors. Target and distractor identities varied in a manner identical to that in the visual search task allowing us to directly map our results from the search task onto those obtained in the perceptual load task (see Figure 1). The task-relevant area was defined by an imaginary circle with a radius of 2.81° visual angle which was cented at fixation. The target and five distractors appeared along the perimeter of the imaginary circle with 1.26° between adjacent items. The target appeared equiprobably at one of six locations along the imaginary circle. A flanker subtending 2.38° × 2.38° appeared equiprobably 1.32° to the left or the right of the task relevant area as measured from the edge of the flanker to the edge of the nearest stimulus. The flanker could be identical to the target (congruent flanker) or it could be the mirror image of the target (incongruent flanker). The displays were presented for 100 ms, followed by a blank screen that remained until participants reported the target's orientation. Participants performed 96 experimental trials per block for a total of 384 trials.
The order of the search and perceptual load tasks was alternated and the blocks of each task were counterbalanced in a manner that produced 24 (4! = 24) unique versions of each experiment.
Results
Visual Search Task
Response Times
Mean correct RTs were computed for each participant as a function of T-D similarity (low and high similarity), D-D similarity (homogeneous or heterogeneous), and display size (4, 8, or 12 items). RTs outside ±2.5 SD from each participant by condition mean were excluded from the analysis. This trimming excluded less than 5.5% of the data.
Search slopes were calculated for each participant on the basis of the four possible display types. Search slope and intercept values were derived from linear regression analyses that were independently performed across display size and upon each T-D × D-D mean (see Figure 2a for statistics). Individual participant search slopes were analyzed using a 2 × 2 repeated-measures analysis of variance (ANOVA) with T-D similarity and D-D similarity as independent factors. We observed a significant two-way interaction between the factors, F(1,23) = 43.47, p < 0.001, as well as main effects for both factors, T-D similarity, F(1,23) = 167.33, p < 0.001, and D-D similarity, F(1,23) = 24.62, p < 0.001.
Figure 2. Results of Experiment 1 (a) Visual Search Task (b) Perceptual load Task.


T-D and D-D represent Target-Distractor similarity and Distractor-Distractor similarity respectively. R2-values represent the best linear fit across the three set sizes for each distractor category. Error rate percentages are denoted at the base of each bar. Visual Search error bars represent 95% within participant confidence intervals (Loftus & Masson, 1994; Cousineau, 2005). Perceptual load error bars represent the error term from individual paired samples t-tests between congruent and incongruent trials. m = search slope in ms/item, b = search intercept in ms, *p < 0.05, **p < 0.001
Error Rates
Next, we analyzed error rates in the visual search task and performed a 2 × 2 × 3 repeated-measures ANOVA with T-D similarity, D-D similarity and display size as independent factors. We observed a significant interaction between T-D similarity and display size, F(2,22) = 7.77, p = 0.0030. The error rate for low T-D similarity distractors was slightly greater than for high T-D similarity distractors when 8 items were in the display (3.76% and 2.19% respectively). No other effects or interactions were significant.
Perceptual Load Task
Response Times
Mean correct RTs were computed for each participant as a function of T-D similarity, D-D similarity, and flanker congruency (response congruent or incongruent). RTs outside ±2.5 SD from each participant × condition mean were excluded from the analysis. This trimming excluded less than 4.5% of the data.
RTs were analyzed using a 2 × 2 × 2 repeated-measures ANOVA with T-D similarity, D-D similarity, and flanker congruency as independent factors (see Figure 2b). We observed a significant two-way interaction between T-D similarity and flanker congruency, F(1,23) = 32.14, p < 0.001, as well as a main effect of T-D similarity, F(1,23) = 87.03, p < 0.001. Planned comparisons between response congruent and incongruent trials for each of the four distractor categories revealed significant flanker effects when targets were dissimilar from distractors – homogeneous distractors, t(23) = 2.50, p = 0.020, heterogeneous distractors, t(23) = 3.71, p < 0.001 – but not when targets were similar to the distractors – homogeneous distractors, t(23) = 0.67, p = 0.50, heterogeneous distractors, t(23) = 0.12, p = 0.91. Flanker effects were observed when the target was conspicuous; in contrast, when the target and distractors were similar, no flanker effects were observed.
Error Rates
We performed an identical analysis on error rates in the perceptual load task and observed a significant main effect of T-D similarity, F(1,23) = 20.84, p < 0.0005. High T-D similarity led to increased error rates as compared to low T-D similarity (8.44% vs. 3.67% respectively). No other effects or interactions reached significance.
Discussion
The results of the visual search task indicate that steeper search slopes are typical of displays that include an inconspicuous target and heterogeneous distractors; however, the nature of the interaction between T-D similarity and D-D similarity suggests that the contribution of D-D similarity is only realized under high T-D similarity. This finding is consistent with Duncan and Humphreys (1989) who also found that search efficiency was affected by D-D similarity only when T-D similarity was high.
The results of the perceptual load task generally accord with the results of the visual search task; however, significant flanker effects were observed when the target was conspicuous irrespective of D-D similarity. Thus, flanker effects tend to follow T-D similarity rather than D-D similarity, which raises the possibility that, unlike search efficiency, attentional selectivity in the perceptual load may be solely determined by T-D similarity. Furthermore, in displays containing low T-D similarity (“low load” displays), distractors with low D-D similarity produced faster overall RTs and a shallower search slope than distractors with high D-D similarity. Although these differences were not substantial, they run counter to what one would expect from the visual search literature. To address these issues, in Experiment 2 we incorporated medium T-D similarity distractors to more fully map-out the interaction between T-D and D-D similarity. We hypothesized that the dissimilar distractors in Experiment 1 were so distinct from the target as to obscure any effects of D-D similarity. To avoid this, we created distractors that were dissimilar from the target but that nevertheless shared some features (e.g., 90° intersections) with the target.
Experiment 2
Participants
Twenty-four University of Iowa undergraduates participated in a single study session for course credit. All participants had normal or corrected-to-normal vision.
Method
The methods of Experiment 2 were identical to Experiment 1 except that the low similarity distractors were modified to better characterize the relationship between D-D similarity and perceptual load. We carefully chose a distractor set that would produce moderate search slopes in order to more comphrehensivley address the impact of D-D similarity on perceptual load across the dimension of T-D similarity. We will refer to this new distractor set as having medium similary with the target. In Experiment 2, medium similarity distractors were the letter “L” with equal-length line segments rotated 45°, 135°, 225°, or 315°. These medium T-D similarity distractors were identical to the high T-D similarity distractors except that they were rotated such that their vertices did not correspond with the vertices of the potential targets. Thus, any differences in dependent measures between the medium and high T-D similarity distractors must necessarily be due to differential perceptual processing on the basis of target-distractor commonalities in line segment intersection.
Results
Statistical Analyses
Data trimming and statistical analyses were conducted in the same manner as Experiment 1. Data trimming led to the exclusion of less than 5.5% of the data in the visual search task and less than 4.5% in the perceptual load task.
Visual Search Task
Response Times
We observed a significant two-way interaction between T-D and D-D similarity, F(1,23) = 4.69, p = 0.041 — heterogeneous (low D-D similarity) distractors led to increased search slopes only when the distractors were highly similar to the target — as well as main effects for both factors; T-D similarity, F(1,23) = 56.17, p < 0.001, and D-D similarity, F(1,23) = 24.37, p < 0.001.
Error Rates
We observed a significant interaction between T-D similarity and D-D similarity, F(1,23) = 7.31, p = 0.013. Heterogeneous distractors decreased error rates when they shared medium similarity with the target; however, heterogeneous distractors increased error rates when they were highly similar to the target. No other effects or interactions reached significance.
Perceptual Load Task
Response Times
We observed a significant two-way interaction between T-D similarity and flanker congruency, F(1,23) = 6.49, p = 0.018, as well as significant main effects for all three factors; T-D similarity, F(1,23) = 195.45, p < 0.001, D-D similarity, F(1,23) = 6.75, p = 0.016, and flanker congruency, F(1,23) = 8.01, p = 0.010. Planned comparisons between response congruent and incongruent trials for each of the four target-distractor configurations revealed significant flanker effects for high T-D similarity – homogeneous distractors, t(23) = 5.93, p < 0.001, heterogeneous distractors, t(23) = 2.11, p = 0.045 – but not for medium similarity distractors – homogeneous distractors, t(23) = 0.78, p = 0.44, heterogeneous distractors, t(23) = 0.22, p = 0.83.
Error Rates
We observed a main effect of T-D similarity, F(1,23) = 23.93, p < 0.0005, and a main effect of flanker congruency, F(1,23) = 17.65, p < 0.0005. High T-D similarity produced greater error rates than low T-D similarity (6.90% vs. 3.36% respectively). Likewise, incongruent trials produced greater error rates than congruent trials (6.23% vs. 4.04% respectively). No other effects or interactions reached significance.
Discussion
The results of Experiment 2 parallel the results of Experiment 1. T-D similarity largely determines whether or not the flanker effect will be observed in a perceptual load task, whereas both D-D similarity and T-D similarity contribute to search efficiency.
Again, the results indicate that perceptual load can be defined by factors known to affect visual search, namely search efficiency, which is determined primarily by T-D similarity.
Although the previous experiments point to search efficiency (i.e., search slope) as a main determinant of perceptual load effects, careful inspection of our search results suggests another alternative. Not only does search efficiency vary with our display manipulations; the y-intercept of these search functions also varies. Search efficiency and intercept are conflated in our search results, with steeper search slopes having higher y-intercepts.1
We addressed this issue empirically in Experiment 3 by degrading our displays to produce an increase in overall RT and the y-intercept while leaving search efficiency relatively intact. In a canonical perceptual load task, Lavie and DeFockert (2003) lowered the luminance contrast of the target, decreased the display duration, and backward-masked the target. Consequently, RTs increased without an accompanying increase in attentional selectivity. Using similar logic, we hypothesized that lowering the luminance contrast of the stimuli in our visual search task should raise search intercept without a commensurate increase in search slope. Based on Lavie and DeFockert's (2003) findings, we would also expect the same low-contrast stimuli to increase mean RT, but not attentional selectivity in the perceptual load task. If perceptual load corresponds with search efficiency, then our previous findings should be unchanged by an increase in the intercept. This manipulation has the added benefit of acting as a discriminant validity check on our operationalization of perceptual load by assessing the extent to which a search slope captures attentional selectivity and not mean RT.
Experiment 3
Participants
Twenty-four University of Iowa undergraduates participated in a single study session for course credit. All participants had normal or corrected-to-normal vision.
Stimuli and Procedure
The methods of Experiment 3 were identical to Experiment 2 except that: (1) only medium T-D similarity distactors were used, (2) the number of trials per D-D similarity condition was doubled to 192 trials so as to keep constant the total number of trials per task, and (3) the luminance contrast of all stimuli except the flanker was lowered to better characterize the influence of search intercept upon perceptual load. Targets and distractors were changed from black (RGB value = [0 0 0]) to light gray [100 100 100] and were presented on a white [255 255 255] background with black flankers.
Results
Visual Search Task
Response Times
Mean correct RTs outside ±2.5 SD were trimmed (less than 5.0% excluded) and averaged on a participant basis. Search slopes were derived and analyzed by carrying out a paired samples t-test. No significant difference was found between the search slopes of D-D similarity, t(23) = 1.46, p = 0.15, (see Figure 4a). Next, we examined the impact of luminance contrast by directly comparing visual search RTs when the distractors were moderately similar to the targets and displayed in high contrast and when the very same distractor set was displayed in low contrast. We conducted a mixed-model 2 × 2 × 3 ANOVA with luminance contrast as a between-subjects factor and D-D similarity and display size (4, 8, or 12 items) as within-subjects factors. This comparison between Experiments 2 and 3 revealed significant main effects of all three factors: D-D similarity, F(1,46) = 21.46, p < 0.0005, display size, F(2,45) = 20.26, p < 0.0005, and luminance contrast, F(1,46) = 703.01, p < 0.0005. No interactions reached significance.
Figure 4. Results of Experiment 3 (a) Visual Search Task (b) Perceptual load Task.


D-D represents Distractor-Distractor similarity. R2-values represent the best linear fit across the three set sizes for each distractor category. Error rate percentages are denoted at the base of each bar. Error rate percentages are denoted at the base of each bar. Visual Search error bars represent 95% within participant confidence intervals (Loftus & Masson, 1994; Cousineau, 2005). Perceptual load error bars represent the error terms from individual paired samples t-tests between congruent and incongruent trials. m = search slope in ms/item, b = search intercept in ms, *p < 0.05
Error Rates
We conducted a 2 × 3 repeated-measures ANOVA with D-D similarity and display size as factors. Neither main effect nor the interaction reached significance.
Perceptual Load Task
Response Times
Mean correct RTs were computed on a participant × D-D similarity × flanker congruency basis. RTs outside ±2.5 SD were trimmed (less than 4.6% excluded). A 2 × 2 repeated-measures ANOVA was carried out over D-D similarity and flanker congruency. Significant main effects of both factors were observed: D-D similarity, F(1,23) = 6.17, p = 0.021, flanker congruency, F(1,23) = 8.03, p = 0.009, (see Figure 4b). The interaction was not significant.
Planned comparisons between incongruent and congruent trials revealed a significant flanker effect when distractors were homogeneous, t(23) = 2.07, p = 0.050, but not when distractors were heterogeneous, t(23) = 1.44, p = 0.16.
We next analyzed the RTs from Experiments 2 and 3 together by conducting a mixed-model 2 × 2 × 2 ANOVA with D-D similarity and flanker congruency as within-subjects factors and luminance contrast as a between-subjects factor. We observed a main effect of congruency, F(1,46) = 25.06, p < 0.0005, and luminance contrast, F(1,46) = 5.50, p = 0.023. No other effects or interactions reached significance.
Error Rates
We performed a 2 × 2 repeated-measures ANOVA with D-D similarity and congruency as factors. We observed a main effect of congruency, F(1,23) = 7.29, p = 0.013. Incongruent trials resulted in greater error rates compared to congruent trials (5.80% vs. 4.40% respectively).
Discussion
The results of Experiment 3 indicate that search efficiency, not intercept, is the main determinant of perceptual load effects as measured by flanker congruency. Although our display degradation manipulation slowed RTs overall without affecting search slope, this overall slowing did not affect flanker interference. Our results are consistent with Lavie and DeFockert's (2003) findings, which found that perceptual degradation serves to increase mean RT without increasing attentional selection in their canonical perceptual load task.
Although Experiment 3 points to the role of search efficiency in determining perceptual load, the fact that search efficiency and search difficulty co-vary in Experiments 1 and 2 (and, indeed, in most visual search experiments) suggests that there might be a more complex relationship between factors that underlie visual search and those that determine perceptual load. That is, although search slope appears to be the main determinant of perceptual load effects, our previous analyses do not allow us to determine the relative contributions of many search factors simultaneously. To provide a finer-grained measure of the relationship between visual search and perceptual load, we conducted a regression analysis on the results of our three experiments.
Multiple Regression Analysis
We created a regression model that used several search factors, specifically search slope, search intercept, T-D similarity (low, medium, and high), D-D similarity (low and high), and luminance contrast (low and high) to predict the magnitude of the flanker effect in our perceptual load task. We used the natural log-transform of the flanker effect values because the flanker effect has a natural floor of 0 ms, when incongruent trials produce the same RT as congruent trials and where the flanker effect becomes insensitive to subtle changes in perceptual load.
Our analysis relied on the 10 observations from the foregoing experiments (four each from Experiments 1 and 2 and two from Experiment 3), where each observation was a pairing of the various search factors (search efficiency, search intercept, T-D similarity, D-D similarity, and luminance contrast) and the corresponding natural log of the flanker effect.
Figure 5 illustrates the results of a stepwise forward regression, which indicated that search slope was the single best predictor of the flanker effect, R2 = .932, F(1,8) = 110.1, p < 0.0005; however, the inclusion of an additional predictor — search intercept — explained nearly 98% of the flanker variance, R2 = .977, F(2,7) = 145.8, p < 0.0005. The increase in predictive power resulting from the addition of search intercept to the model was significantly greater than the predictive power of slope alone, ΔR2 = 0.044, F(1,7) = 13.23, p = 0.008. However, the standardized β-weights indicated that slope was nearly 4.5 times more influential than intercept in the two-predictor model [slope: β = -.93, p < 0.0005; intercept: β = -.21, p = 0.008].
Figure 5. Linear regression of search slope and flanker effect in Experiments 1, 2 & 3.

The interference effect was calculated by subtracting mean congruent RT from mean incongruent RT. T-D and D-D represent Target-Distractor similarity and Distractor-Distractor similarity respectively. N.B., search slope is plotted against the natural logarithm of the flanker effect (see EXP 3 Results Section for the rationale behind this transformation)
The relative independence of search slope and search intercept that we observed in Experiment 3 may explain why those variables are the best two predictors of the flanker effect in our regression analysis: The intercept can explain a small proportion of the variance that no other variable appears to capture. Indeed, we tested this by examining the relationship between the intercept and the natural log of the flanker effect after partialling out the effect of slope, D-D similarity, T-D similarity, and luminance contrast. This analysis revealed a strong, significant relationship between intercept and the flanker effect, R2 = 0.66, p = 0.013. However, and most important, the relationship between search slope and the flanker effect remained extraordinarily strong when the effect of intercept, D-D similarity, T-D similarity, and luminance contrast was partialed out, R2 = 0.90, p = 0.006.
One important contribution of these regression analyses is that they break the circularity of perceptual load theory. Our regression analyses allow us to determine an equation that best predicts the magnitude of the flanker effect, and thus provide a definition of perceptual load, that is independent of the presence or absence of a significant flanker effect:
Where e = 2.718, slope is in milliseconds per item, intercept is in milliseconds, and flanker effect is in milliseconds. The solution to this equation appears in Figure 6, which depicts the surface that predicts the flanker effect using search slope and the intercept. This surface illustrates the nature of the relationship between search slope and search intercept, indicating that increments in search intercept accompany increases in perceptual load only when search efficiency is relatively high. For the first time, perceptual load can be independently quantified in terms of search slope and search intercept, both of which are determined by display factors, most notably T-D similarity.
Figure 6. Surface plot illustrating the relationship between search slope, search intercept, and ln(flanker).
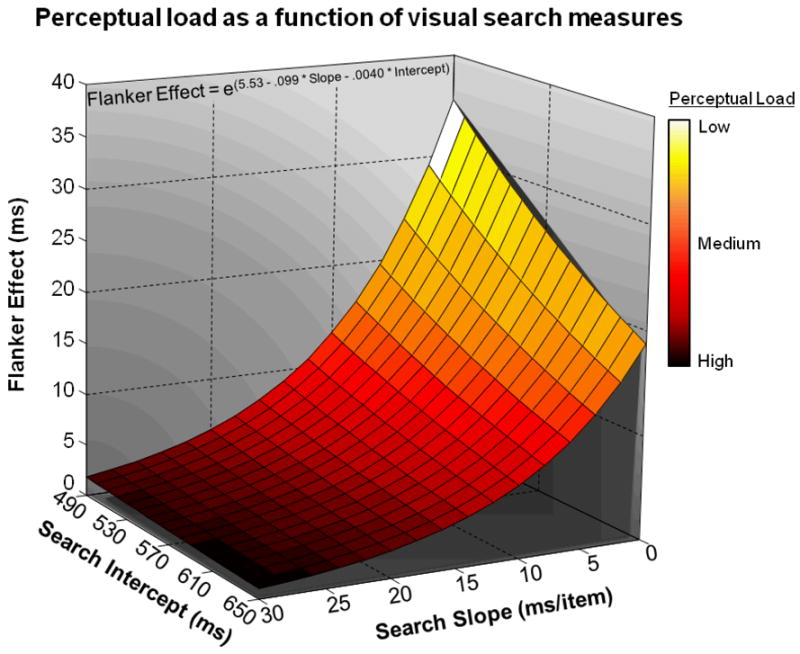
The equation for this curve was empirically derived from a multiple regression analysis of data obtained from EXPs 1-3 (see Discussion Section of EXP 3 for details)
General Discussion
The results of three experiments demonstrated that search efficiency serves as a continuous metric upon which perceptual load can be grafted. The very same stimulus sets that produced inefficient visual search (i.e., relatively large search slopes) provided evidence of high attentional selectivity as demonstrated by the absence of flanker effects in the perceptual load task. Contrariwise, stimulus sets that produced efficient visual search yielded evidence of low attentional selectivity as demonstrated by the presence of a flanker effect. These findings are theoretically important for at least two reasons: first, they operationally define perceptual load and unravel the argument of circularity that has previously knotted perceptual load theory, and second, they provide an independent metric that can be used to classify perceptual load manipulations.
The usefulness of the search efficiency metric is born out in an unexpected finding of Experiment 1. As stated in the introduction, at face value, the perceptual load of a display corresponds to that display's complexity. Bearing that in mind, it would have been logical to assume that a disordered display, such as those with low T-D similarity and low D-D similarity would produce greater attentional selectivity in the perceptual load task compared to an orderly display, such as displays with low T-D similarity and high D-D similarity. However, the observed relationship did not follow this prediction. Instead, the homogeneous, low T-D similarity distractors produced greater attentional selectivity. Of primary importance was the finding that the search slope data for those two conditions accurately reflected this surprising deviation, not only did the homogeneous, low T-D similarity distractors in Experiment 1 produce smaller flanker effects than the heterogeneous, low T-D similarity distractors, but they also produced greater search slopes. This suggests that it may not be reasonable to classify perceptual load displays based on phenomenology. Thus, there is a definite need to use an independent measure, such as visual search measures, to assess the perceptual load of a display. Furthermore, when conventional comparisons prove to be difficult (e.g., assessing the differential perceptual load produced by two distinct real-life scenes), this new metric can be used to rank-order any number of disparate displays on the basis of perceptual load.
It is important to address the limitations of this new perceptual load metric. First, we studied the effects of T-D similarity on perceptual load by manipulating the degree of similarity between targets and distractors along a dimension of shape and orientation characteristics. The extent to which our perceptual load model can account for T-D similarity manipulations that involve surface feature dimensions is unknown. However, this potential limitation is counteracted by our model's strong association with measures of visual search. This heavy reliance on search slope and intercept allows us to appeal to pre-existing visual search findings thereby seamlessly integrating perceptual load theory into the extensive visual search framework. For example, D'Zmura (1991) and Bauer, Cowan, and Jolicoeur (1996a, 1996b) investigated the effects of T-D color similarities on search efficiency. They found that greater color similarity between targets and distractors led to decreased search efficiency. With these results in hand, it is reasonable to assume that color similarities between targets and distractors could also contribute to perceptual load. On the basis of our model, the natural prediction then would be that increased T-D color similarity serves to increase perceptual load. Therefore, the generalizability of our results is bolstered by the likenesses shared by perceptual load and visual search.
Second, we cannot overstate the necessity of visual search strategies to complete our tests of perceptual load. In our perceptual load tasks, the precise target (T rotated left or right) is never certain. Additionally, the location of the target is only certain to the extent that the participant can anticipate that the target will appear in the central row of stimuli. Thus, it is reasonable to conclude that some degree of visual search must be conducted in order to identify the target. As such, it comes by no surprise that measures of visual search correspond to measures of perceptual load, as we tested it. Consequently, our model of perceptual load may be less instrumental in determining the perceptual load of displays that differ substantially from our task. Suffice it to say, that our model is best applied to circumstances where there is uncertainty in the target identity and location coupled with well-defined task-relevant and task-irrelevant portions of the display. Furthermore, we do not claim that all factors shown to affect search efficiency will in turn affect attentional selectivity and subsequently set the level perceptual load. The experience achieved by practicing a search task has been shown to increase search efficiency (Brockmole, Hambrick, Windisch, & Henderson, 2008). Furthermore, as search becomes more efficient, flanker effects obtain despite high perceptual load (Wilson, Muroi, & Macleod, 2008). These studies raise the possibility that search efficiency is a useful proxy for putative experience-dependent fluctuations in perceptual load; however, this issue requires further experimentation and consequently lies beyond the scope of current aim.
Torralbo and Beck (2008) proposed that the perceptual load of a display might be partly determined by local competitive interactions between targets and nearby distractor items visual cortex. Our manipulation of T-D similarity could conceivably play a role in establishing the magnitude of such competition by modulating the level of competition between targets and distractors (Desimone & Duncan, 1995). Specifically, increasing T-D similarity may increase the strength of top-down attention necessary to effectively select the target from an array of similar distractor. This increased recruitment of top-down attention may translate to greater selectivity in the perceptual load task thereby reducing the probability that the task-irrelevant flanker is processed. Thus, the present work not only conforms to previous findings but it provides an opportunity to address perceptual load in terms of biased-competition models of attention.
Our use of search efficiency to define another construct (i.e., perceptual load) is conceptually related to results from Alvarez and Cavanagh (2004), who demonstrated that accuracy in a visual short-term memory (VSTM) change detection task was highly predicted by search efficiency; objects that produced shallow search slopes were remembered better in VSTM than those that produced steeper search slopes. Alvarez and Cavanagh (2004) argued that the ‘information load’ of a class of stimuli — i.e., the visual detail that is stored in memory for a particular object — was the main determinant of both visual search efficiency and VSTM change detection performance. Based on our findings, we would add that display-wide measures, such as T-D similarity and D-D similarity might also encompass the information load of an entire display. Such display-wide considerations appear to explain various attentional results, including search efficiency and perceptual load, but could also impact the storage of items in visual memory (Luria & Vogel, 2011).
The potential impact of perceptual load theory hinges upon how perceptual load is operationally defined. Although is it known that perceptual load determines attentional selectivity (see Lavie, Hirst, de Fockert, & Viding, 2004, but see also Benoni & Tsal, 2010; Tsal & Benoni, 2010, for a differing viewpoint), its usefulness as a manipulation is only as precise as its definition. The finding that perceptual load may be determined by search efficiency, for the first time quantifies an otherwise nebulous construct. Furthermore, by demonstrating that perceptual load can be reduced to well-characterized factors that influence visual search, perceptual load can be explored with a renewed perspective.
Figure 3. Results of Experiment 2 (a) Visual Search Task (b) Perceptual load Task.


T-D and D-D represent Target-Distractor similarity and Distractor-Distractor similarity respectively. R2-values represent the best linear fit across the three set sizes for each distractor category. Error rate percentages are denoted at the base of each bar. Error rate percentages are denoted at the base of each bar. Visual Search error bars represent 95% within participant confidence intervals (Loftus & Masson, 1994; Cousineau, 2005). Perceptual load error bars represent the error term from individual paired samples t-tests between congruent and incongruent trials. m = search slope in ms/item, b = search intercept in ms, *p < 0.05, **p < 0.001
Acknowledgments
This research was supported in part by grants from the Nissan Motor Company, the Toyota Motor Company, the National Institutes of Health (R01AG026027), and the National Science Foundation (BCS 11-51209). Thanks to Toby Mordkoff, Daniel Vatterott, and Kaitlyn Zenner for many useful discussions. We would also like to thank Jim Brockmole, Wieske van Zoest, Adam Biggs, and an anonymous reviewer for their helpful comments on an earlier version of this manuscript. Correspondence should be addressed to Shaun P. Vecera, Department of Psychology, E11 Seashore Hall, University of Iowa, Iowa City, IA 52242-1407. Electronic mail can be sent to zachary-roper@uiowa.edu or shaun-vecera@uiowa.edu.
Footnotes
Thanks to Wieske van Zoest for bringing this to our attention.
Contributor Information
Zachary J. J. Roper, Email: zachary-roper@uiowa.edu.
Shaun P. Vecera, Email: shaun-vecera@uiowa.edu.
References
- Alvarez G, Cavanagh P. The capacity of visual short-term memory is set both by visual information load and by number of objects. Psychological Science. 2004;15(2):106–111. doi: 10.1111/j.0963-7214.2004.01502006.x. [DOI] [PubMed] [Google Scholar]
- Baur B, Jolicoeur P, Cowan WB. Distractor heterogeneity versus linear separability in colour visual search. Perception. 1996a;25:1281–1293. doi: 10.1068/p251281. [DOI] [Google Scholar]
- Baur B, Jolicoeur P, Cowan WB. Visual search for colour targets that are or are not linearly-separable from distractors. Vision Research. 1996b;36:1439–1466. doi: 10.1016/0042-6989(95)00207-3. [DOI] [PubMed] [Google Scholar]
- Beck DM, Kastner S. Stimulus context modulates competition in human extrastriate cortex. Nature Neuroscience. 2005;8(8):1110–6. doi: 10.1038/nn1501. [DOI] [PMC free article] [PubMed] [Google Scholar]
- Benoni H, Tsal Y. Where have we gone wrong? Perceptual load does not affect selective attention. Vision Research. 2010;50(13):1292–1298. doi: 10.1016/j.visres.2010.04.018. [DOI] [PubMed] [Google Scholar]
- Brainard D. The psychophysics toolbox. Spatial vision. 1997;10(4):433–436. doi: 10.1163/156856897X00357. [DOI] [PubMed] [Google Scholar]
- Brockmole JR, Hambrick DZ, Windisch DJ, Henderson JM. The role of meaning in contextual cueing: Evidence from chess expertise. Q Journal of Experimental Psychology. 2008;61(12):1886–1896. doi: 10.1080/17470210701781155. [DOI] [PubMed] [Google Scholar]
- Bundesen C. A theory of visual attention. Psychological Review. 1990;97(4):523–47. doi: 10.1037/0033-295X.97.4.523. [DOI] [PubMed] [Google Scholar]
- Dark VJ, Johnston WA, Myles-Worsley M, Farah MJ. Levels of selection and capacity limits. Journal of Experimental Psychology: General. 1985;114(4):472–497. doi: 10.1037/0096-3445.114.4.472. [DOI] [PubMed] [Google Scholar]
- Desimone R, Duncan J. Neural mechanisms of selective visual attention. Annual Review of Neuroscience. 1995;18:193–222. doi: 10.1146/annurev.ne.18.030195.001205. [DOI] [PubMed] [Google Scholar]
- Duncan J. The locus of interference in the perception of simultaneous stimuli. Psychological Review. 1980;87(3):272. doi: 10.1037/0033-295X.87.3.272. [DOI] [PubMed] [Google Scholar]
- Duncan J, Humphreys GW. Visual search and stimulus similarity. Psychological Review. 1989;96(3):433–58. doi: 10.1037/0033-295X.96.3.433. [DOI] [PubMed] [Google Scholar]
- D'Zmura M. Color in visual search. Vision Research. 1991;31(6):951–966. doi: 10.1016/0042-6989(91)90203-H. [DOI] [PubMed] [Google Scholar]
- Eriksen BA, Eriksen CW. Effects of noise letters upon the identification of a target letter in a nonsearch task. Perception & Psychophysics. 1974;16(1):143–149. doi: 10.3758/BF03203267. [DOI] [Google Scholar]
- Eriksen CW, Hoffman JE. The extent of processing of noise elements during selective encoding from visual displays. Perception & Psychophysics. 1973;14(1):155–160. doi: 10.3758/BF03198630. [DOI] [Google Scholar]
- Folk CL, Remington RW, Johnston JC. Involuntary covert orienting is contingent on attentional control settings. Journal of Experimental Psychology: Human Perception and Performance. 1992;18(4):1030–44. doi: 10.1037/0096-1523.18.4.1030. [DOI] [PubMed] [Google Scholar]
- Handy TC, Mangun GR. Attention and spatial selection: Electrophysiological evidence for modulation by perceptual load. Perception & Psychophysics. 2000;62(1):175–186. doi: 10.3758/BF03212070. [DOI] [PubMed] [Google Scholar]
- Handy TC, Soltani M, Mangun GR. Perceptual load and visuocortical processing: Event-related potentials reveal sensory-level selection. Psychological Science. 2001;12(3):213–218. doi: 10.1111/1467-9280.00338. [DOI] [PubMed] [Google Scholar]
- Kahneman D, Chajczyk D. Tests of the automaticity of reading: Dilution of Stroop effects by color-irrelevant stimuli. Journal of Experimental Psychology: Human Perception and Performance. 1983;9(4):497–509. doi: 10.1037/0096-1523.9.4.497. [DOI] [PubMed] [Google Scholar]
- Lavie N. Perceptual load as a necessary condition for selective attention. Journal of Experimental Psychology: Human Perception and Performance. 1995;21(3):451–68. doi: 10.1037/0096-1523.21.3.451. [DOI] [PubMed] [Google Scholar]
- Lavie N, Cox S. On the Efficiency of Visual Selective Attention: Efficient Visual Search Leads to Inefficient Distractor Rejection. Psychological Science. 1997;8(5):395–396. doi: 10.1111/j.1467-9280.1997.tb00432.x. [DOI] [Google Scholar]
- Lavie N, Tsal Y. Perceptual load as a major determinant of the locus of selection in visual attention. Perception & Psychophysics. 1994;56(2):183–97. doi: 10.3758/BF03213897. [DOI] [PubMed] [Google Scholar]
- Lavie N, Hirst A, de Fockert JW, Viding E. Load theory of selective attention and cognitive control. Journal of Experimental Psychology: General. 2004;133(3):339–54. doi: 10.1037/0096-3445.133.3.339. [DOI] [PubMed] [Google Scholar]
- Luria T, Vogel EK. Visual search demands dictate reliance upon working memory storage. Journal of Neuroscience. 2011;31(16):6199–6207. doi: 10.1523/JNEUROSCI.6453-10.2011. [DOI] [PMC free article] [PubMed] [Google Scholar]
- Miller J. The flanker compatibility effect as a function of visual angle, attentional focus, visual transients, and perceptual load: A search for boundary conditions. Perception & Psychophysics. 1991;49(3):270–288. doi: 10.3758/BF03214311. [DOI] [PubMed] [Google Scholar]
- Mozer MC. The perception of multiple objects. Cambridge, MA: MIT Press; 1991. [Google Scholar]
- Theeuwes J. Cross-dimensional perceptual selectivity. Perception & Psychophysics. 1991;50(2):184–193. doi: 10.3758/BF03212219. [DOI] [PubMed] [Google Scholar]
- Theeuwes J. Stimulus-driven capture and attentional set: Selective search for color and visual abrupt onsets. Journal of Experimental Psychology: Human Perception and Performance. 1994;20(4):799–806. doi: 10.1037/0096-1523.20.4.799. [DOI] [PubMed] [Google Scholar]
- Torralbo A, Beck DM. Perceptual-load-induced selection as a result of local competitive interactions in visual cortex. Psychological Science. 2008;19(10):1045. doi: 10.1111/j.1467-9280.2008.02197.x. [DOI] [PMC free article] [PubMed] [Google Scholar]
- Treisman AM. Strategies and models of selective attention. Psychological Review. 1969;76(3):282–299. doi: 10.1037/h0027242. [DOI] [PubMed] [Google Scholar]
- Tsal Y, Benoni H. Diluting the burden of load: Perceptual load effects are simply dilution effects. Journal of Experimental Psychology: Human Perception and Performance. 2010;36(6):1645–1656. doi: 10.1037/a0018172. [DOI] [PubMed] [Google Scholar]
- Wilson DE, MacLeod CM, Muroi M. Practice in visual search produces decreased capacity demands but increased distraction. Perception & Psychophysics. 2008;70:1130–1137. doi: 10.3758/PP.70.6.1130. [DOI] [PubMed] [Google Scholar]
- Yi DJ, Woodman GF, Widders D, Marois R, Chun MM. Neural fate of ignored stimuli: dissociable effects of perceptual and working memory load. Nature Neuroscience. 2004;7(9):992–996. doi: 10.1038/nn1294. [DOI] [PubMed] [Google Scholar]
- Yantis S, Johnston JC. On the locus of visual selection: evidence from focused attention tasks. Journal of Experimental Psychology: Human Perception and Performance. 1990;16(1):135–49. doi: 10.1037/0096-1523.16.1.135. [DOI] [PubMed] [Google Scholar]