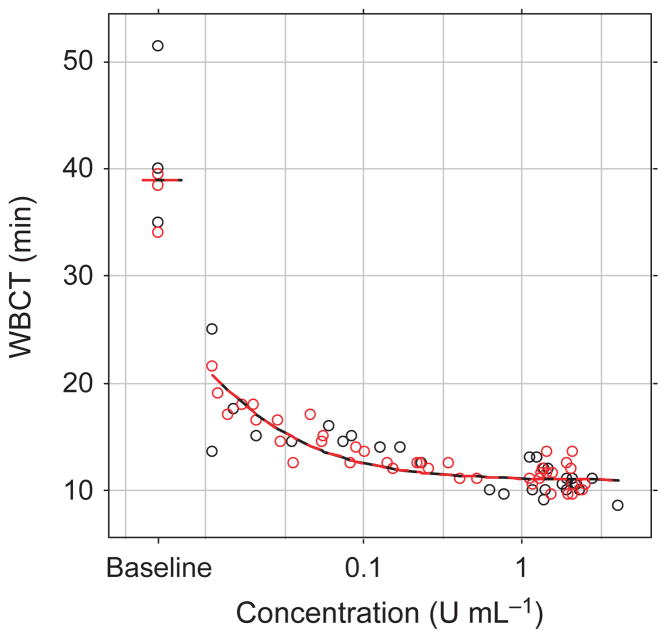
Fig. 2.
Whole blood clotting time (WBCT) plotted against the observed plasma concentration of turoctocog alfa (black) or N8-GP (red) after intravenous administration of 125 U kg−1 to haemophilic dogs (n = 3). Lines represent model fit, open circles the individual observed plasma concentration levels.

