

Abstract
Background
Risks associated with pediatric reconstructive heart surgery include injury of the sinoatrial node (SAN) and atrioventricular node (AVN), requiring cardiac rhythm management using implantable pacemakers. These injuries are result of difficulties in identifying nodal tissues intraoperatively. Here, we describe an approach based on confocal microscopy and extracellular fluorophores to quantify tissue microstructure and identify nodal tissue.
Methods and Results
Using conventional three-dimensional confocal microscopy we investigated the microstructural arrangement of SAN, AVN, and atrial working myocardium (AWM) in fixed rat heart. AWM exhibited a regular striated arrangement of the extracellular space. In contrast, SAN and AVN had an irregular, reticulated arrangement. AWM, SAN and AVN tissue were beneath a thin surface layer of tissue that did not obstruct confocal microscopic imaging. Subsequently, we imaged tissues in living rat hearts with real-time fiber-optics confocal microscopy (FCM). FCM images resembled images acquired with conventional confocal microscopy. We investigated spatial regularity of tissue microstructure from Fourier analysis and 2nd order image moments. Fourier analysis of FCM images showed that the spatial regularity of AWM was greater than that of nodal tissues (37.5±5.0% versus 24.3±3.9% for SAN and 23.8±3.7% for AVN, P<0.05). Similar differences of spatial regularities were revealed from 2nd order image moments (50.0±7.3% for AWM versus 29.3±6.7% for SAN and 27.3±5.5% for AVN; P<0.05).
Conclusions
The study demonstrates feasibility of identifying nodal tissue in living heart using extracellular fluorophores and FCM. Application of the approach in pediatric reconstructive heart surgery may reduce risks of injuring nodal tissues.
Keywords: Confocal imaging, two-dimensional, sinoatrial node, atrioventricular node, congenital cardiac defect
Introduction
Of all birth defects, congenital heart defects are the most frequent cause of death among infants in the U.S.1 The state-of-the-art approach to repair congenital heart defects is open heart reconstructive surgery in the neonatal period. Complications that can occur as a result of these complex surgeries are sinus node dysfunction or atrioventricular block arising from trauma to the sinoatrial (SAN) and atrioventricular node (AVN), respectively. These complications are associated with significant morbidity and mortality.2 Patients with persistent complications require short-term or chronic cardiac rhythm management using implantable pacemakers. The need for permanent pacemakers after repair for congenital cardiac defects ranges from 1-3% for ventricular septal defect to as high as 27-45% for congenitally corrected transposition of the great arteries.3-6
The SAN, AVN and other tissues of the conduction pathways are not visible using surgical loupes or microscopes. These instruments are based on reflection of light from the tissue surface and do not provide visual information from within the tissue, where nodal tissue resides. The localization of SAN and AVN tissue during surgery is based on their relative proximity to anatomical landmarks. The SAN is usually located proximal to the crista terminalis in the right atrium. The AVN is adjacent to the atrio-ventricular septum of the heart. Commonly, the AVN is identified from the triangle of Koch, which is defined as the space between the septal leaflet of the tricuspid valve, coronary sinus, and the tendon of Todaro. In hearts with congenital defects this localization is made more difficult by individual variations in the spatial relationship of landmarks to nodal structures.7, 8 The aforementioned postoperative complications can arise as a result of this imprecise methodology for localization of nodal tissue. Thus, imaging approaches for real-time visualization of nodal tissue in the intraoperative setting could reduce the incidence of nodal dysfunction and conduction block.
In this study, we establish a novel intraoperative imaging modality to discriminate cardiac tissue types using methodology based on fluorescent labeling, confocal microscopy and image analysis. To achieve this aim we investigated the microstructure of atrial working myocardium (AWM), the SAN and the AVN in a rodent model. Using fluorescent markers for nodal cells and extracellular space and three-dimensional conventional confocal microscopy we created reconstructions at sub-micrometer resolution from fixed tissue. From these reconstructions, we developed methods for characterization of tissue microstructure based on texture analysis. Subsequently, we evaluated our approach for tissue discrimination in the isolated perfused heart using a recently introduced fiber-optics confocal microscopy (FCM) system, a fluorescent marker of the extracellular space and specialized imaging microprobes. Using the acquired image data we characterized the tissue microstructure with previously developed methods for texture analysis. We performed statistical analyses of conventional confocal microscopy and FCM image data to investigate the proposed approach for discrimination of cardiac tissue types. Furthermore, we explored fetal and infant tissue microstructure in human using conventional confocal microscopy to provide further insights into clinical translation of the developed approach.
Methods
Rodent Heart Preparations
All procedures were approved by the University of Utah Institutional Animal Care and Use Committee and followed the guidelines of the National Institutes of Health Guide for the Care and Use of Laboratory Animals.
Sprague-Dawley male rats of approximately 300 g body weight were anesthetized with pentobarbital (40 mg/kg) and anticoagulated with heparin (500 IU/kg). Following intraperitoneal administration, hearts were rapidly excised and Langendorff-perfused with cold zero calcium Tyrode’s solution (in mM: 92 NaCl, 11 dextrose, 4.4 KCl, 5 MgCl2, 24 HEPES, 20 Taurine, 5 Creatine, 5 C3H3NaO3, 1 NaH2PO4, 12.5 NaOH; pH 7.2; ~10°C) at a flow rate of 10-15 mL/min.
For preparations of living hearts, those were continuously Langendorff-perfused with cold zero calcium Tyrode’s solution. Before imaging, 5 μL of fluorescent dye was applied to the epicardial or endocardial surface of the heart to label the extracellular space within regions of interest. The fluorescent dye was Alexa Fluor 488 conjugated to dextran with a molecular weight of 3 or 10 kDa (Invitrogen, Carlsbad, CA) dissolved in phosphate buffered saline (PBS) solution to a final concentration of 125 μg/mL.
For fixed tissue preparations, perfusion with Tyrode’s solution ceased after 5 min. Afterwards, hearts were either perfused for 5 min with a zero calcium Tyrode’s solution containing wheat germ agglutinin (WGA) conjugated to CF488A (29022-1, Biotium, Hayward, CA; 1:100), followed by a 10 min perfusion with Tyrode’s solution containing 4% paraformaldehyde (pH 7.2) or the hearts were immediately perfused with fixative. The hearts were then immersed in PBS containing 4% paraformaldehyde for 24 h at 4°C. Tissue from the AWM, SAN and AVN was dissected from the fixed hearts (Figure 1 and online-only Data Supplemental Figure 1, 2a).
Figure 1.
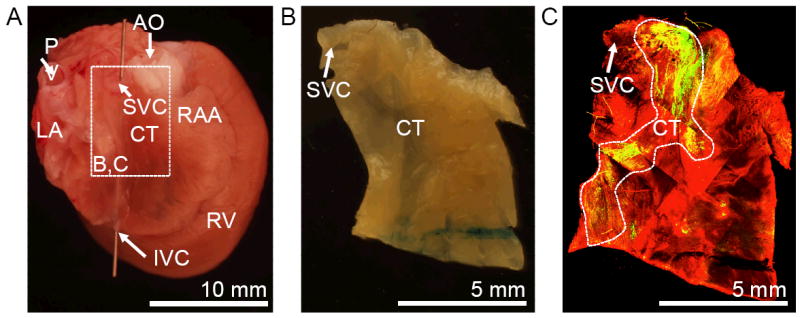
Preparation for localization and characterization of SAN tissue. (A) Fixed rat heart shown from posterior-lateral. (B) Tissue section from region marked in (A). (C) Conventional confocal microscopic image of tissue preparation (B) labeled with anti-HCN4 (green) and anti-sarcomeric α-actinin (red). AO, aorta; CT, crista terminalis; IVC, inferior vena cava; LA, left atrium; PV, pulmonary vein; RAA, right atrial appendage; RV, right ventricle; SVC, superior vena cava.
Immunofluorescent Labeling of Fixed Tissue
Preparations of fixed tissue were washed three times in PBS and then permeabilized and blocked with PBS solution containing 0.5% Triton X-100 and 4% normal goat serum (16210-064, Gibco, Grand Island, NY) for 1 h. After washing with PBS, preparations were bathed in Image-iT™ FX Signal Enhancer (I36933, Invitrogen) for 1 h. Next, preparations were washed in PBS and incubated overnight with primary antibodies (anti-HCN4, APC-052, Alomone Labs, Jerusalem, Israel, 1:800; anti-sarcomeric α-actinin, ab9465, Abcam, Cambridge, MA 1:400; DAPI, D1306, Invitrogen, 1:400) in PBS-incubation solution containing 0.5% Triton X-100 and 4% normal goat serum. The following day, preparations were washed three times in PBS and incubated overnight with secondary goat anti-rabbit IgG (H+L) conjugated to either Alexa Fluor 488 or Alexa Fluor 555 (Invitrogen; 1:400) and goat anti-mouse IgG1 conjugated to Alexa Fluor 633 (Invitrogen; 1:200) in PBS-incubation solution. The next day, preparations were washed three times in PBS and stored in PBS solution until imaging. All labeling was performed on a laboratory platform rocker (S-2035-D, Labnet International Inc, Woodbridge, NJ) at room temperature.
Imaging of Fixed Tissue
Fixed atrial tissue preparations were imaged using a confocal microscope (Zeiss LSM 5 Duo, Zeiss, Jena, Germany) equipped with a 40x oil immersion lens with a numerical aperture of 1.3. Tissue samples were placed on a glass slide and a coverslip was placed on top of the tissue (online-only Data Supplemental Figure 2b). The coverslip was gently pressed on the tissue, bringing its surface close to the glass slide. Fluorophores within the labeled preparations were individually excited for each image slice, alternating between 364, 488, 543, and 633 nm laser lines. The emitted light was collected through a longpass filter at 385 nm, bandpass filter for 505-555 nm, longpass filter at 560 nm, and longpass at 650 nm, respectively. This multi-track imaging protocol reduced cross-talk of the applied fluorophores. 3D image stacks were acquired at a spatial resolution of 0.2 × 0.2 × 0.2 μm in x-, y- and z- direction, respectively, and a field of view of (x) 204.8 μm by (y) 204.8 μm, and depth (z) up to 50 μm. Details on the processing and visualization of images are provided in online-only Supplemental Data.
Fourier Analysis of Tissue Microstructure
The spatial distributions of the extracellular space in images from atrial working myocardium and nodal tissue were characterized from their Fourier spectra.9 A discrete two-dimensional Fourier transform was applied on xy images after multiplying them with a Gaussian window function. Intensities in circular sectors with an angle of 10° at spatial frequencies from 0.07 to 0.2 μm-1 were integrated from the image spectra. A measure of spatial regularity was determined from a ratio of summed intensities within 15° of the peak of the angular spectra to the overall sum of intensities in angular spectra.
Image Moment Analysis of Tissue Microstructure
Higher order image moments were determined to characterize the spatial distributions of the extracellular space. Images were decomposed in sub-regions with a dimension of 64 × 64 pixels. A circular mask was applied to each sub-region and the central 2nd order moment calculated.10 Local orientation and scaling of the moment were derived from singular value decompositions. A histogram of local orientation angles was determined. A measure of spatial regularity was determined from the ratio of occurrence of an orientation angle within 15° of the peak of the occurrences to the overall occurrences.
FCM Imaging of Tissue in Living Hearts
Two-dimensional image sequences of AWM, SAN and AVN regions labeled with dextran conjugated Alexa Fluor 488 were acquired using a fiber-optics confocal microscope (FCM1000, Leica Microsystems GmbH, Wetzlar, Germany) equipped with a custom fiber-optics microprobe (UltraMiniO, Mauna Kea Technologies, Paris, France). A schematic diagram of the FCM imaging setup is shown in online-only Data Supplemental Figure 2. Excitation of the fluorophore was at a wavelength of 488 nm and emitted light was collected at wavelengths 505 to 700 nm. 2D image sequences were acquired with a lateral resolution of 1.8 × 1.8 μm in x- and y-direction, respectively, an optical sectioning (z) of 10 μm, a field of view (xy) of 169 μm by 120 μm, depth (z) up to 50 μm, and frame rate of 12 Hz. The microprobe tip diameter was 2.6 mm, which simplified maneuvering of the microprobe. It was attached to a manual micro-manipulator (M3301L, World Precision Instruments, Inc. Sarasota, FL) allowing for fine precision three-dimensional movement of the microprobe in proximity to the heart surface.
Processing and Visualization of FCM Images
The brightness and contrast of images acquired with the FCM1000 were auto-adjusted using the imadjust function in MATLAB (The Mathworks Inc, Natick, MA).
Statistical Analysis
Statistical data are presented as mean±standard deviation. Statistical significance was assessed by one-way ANOVA followed by post-hoc Tukey-Kramer (P < 0.05). A summary intensity (I15) was determined from the averaged angle spectra that resulted from the image moment and Fourier analyses for conventional confocal microscopic and FCM images of AWM, SAN, and AVN tissue samples. I15 was defined as the sum of intensities along grouped orientation angles between -15 and +15° from the Fourier analyses. From the image moment analyses, I15 was determined from the sum of occurrences of local orientation along grouped orientation angles between -15 and +15°. A comparative intensity based on standard deviation of intensities or occurrence of local orientation along grouped orientation angles between -89 and +90° was also determined (Istd). Differences in I15 of conventional confocal microscopic and FCM images of AWM, SAN, and AVN tissue samples were assessed. A similar analysis was done to determine significance based on Istd.
Human Heart Preparations, Immunofluorescent Labeling and Imaging
Studies were designated as “nonhuman subjects” research and granted Institutional Review Board exemption by the University of Utah. We obtained de-identified, formalin-fixed sections from AWM, SAN, and AVN regions of two autopsy hearts. The autopsy hearts were from a 4-month old infant and a 38-week old fetus. Both did not have congenital heart disease. Preparations of fixed sections were washed three times in PBS and incubated overnight with WGA conjugated to CF488A (Biotium; 1:25). The following day, preparations were washed three times and stored in PBS solution until imaging. We applied conventional confocal microscopy and texture analyses as described above.
Results
Imaging of Cardiac Tissue Using Conventional Confocal Microscopy
We hypothesized that fluorescent labeling of extracellular space and imaging with conventional confocal microscopy allows for identification of nodal tissue. We tested this hypothesis on tissue preparations from adult Sprague Dawley rat hearts. Locations of SAN and AVN in this species are grossly similar as in other mammals including human, rabbit and pig.
Cardiac tissue preparations were dissected from SAN and AVN regions using anatomical landmarks described above (Figure 1 and online-only Data Supplemental Figure 1). Briefly, SAN tissue was dissected from the junction of the superior vena cava and right atrium and AVN tissue was dissected from the region of the membranous septum, which is bordered by the septal leaflet of the tricuspid valve, coronary sinus and the tendon of Todaro. Tissue dissections were labeled with 4’,6-diamidino-2-phenylindole (DAPI) to mark nuclei and wheat germ agglutinin (WGA)conjugated to a fluorophore to label constituents of the extracellular space. WGA binds to glycoconjugates of the extracellular space including those associated with collagen strands and the glycocalyx on the surface and periphery of cell membranes.11, 12 Additionally, tissues were labeled with antibodies for both hyperpolarization-activated cyclic nucleotide-gated potassium channel 4 (HCN4)and sarcomeric α-actinin. HCN4 labeling has been previously established as a positive marker of nodal cells.13-16 Sarcomeric α-actinin served to identify cardiomyocytes. Conventional confocal microscopic imaging of the tissue preparations yielded three-dimensional distributions of the four labels at sub-micrometer resolution. Image stacks from a preparation of AWM are presented in Figure 2a-h. A hallmark of this tissue is the dense and aligned arrangement of myocytes, which is reflected in the striated distribution of WGA (Figure 2b). Fluorescence associated with anti-HCN4 was absent (Figure 2c). The myocytes labeled positive for α-actinin (Figure 2d). The myocytes were covered by an epicardial layer with a thickness of 3.6 μm. Figure 2i-p shows image stacks from SAN tissue. The stacks comprised three distinct layers, i.e. epicardium, nodal cells, and subnodal layer of AWM myocytes. In this stack, the epicardial and nodal layer had a thickness of 2.4 and 11.2 μm, respectively. The microstructural arrangement in the nodal layer was in various aspects different from the arrangement in the subnodal layer of AWM myocytes in this stack (Figure 2n versus m). It was also very different from the arrangement of myocytes in the stack from AWM tissue (Figure. 2e). SAN cells formed a highly irregular reticulum and had notably smaller diameters than myocytes of the AWM. However, SAN cells also exhibited similar features of striated myocytes, i.e. the regular transversal striations of the α-actinin signal with a longitudinal spacing of ~2 μm. The extracellular space in the SAN layer was more prominent than in AWM and comprised oval shaped clearings with variable sizes. Online-only Data Supplemental Figure 3 illustrates image stacks from the compact region of the AVN, which presented a microstructural arrangement similar to SAN tissue. Here, the endocardial layer had a thickness of 0.8 μm. The orientation of AVN cells was diverse and they formed a reticulum with ample extracellular space. Online-only Data Supplemental Figure 4 presents unprocessed images stacks corresponding to Figure 2 and online-only Data Supplemental Figure 3.
Figure 2.
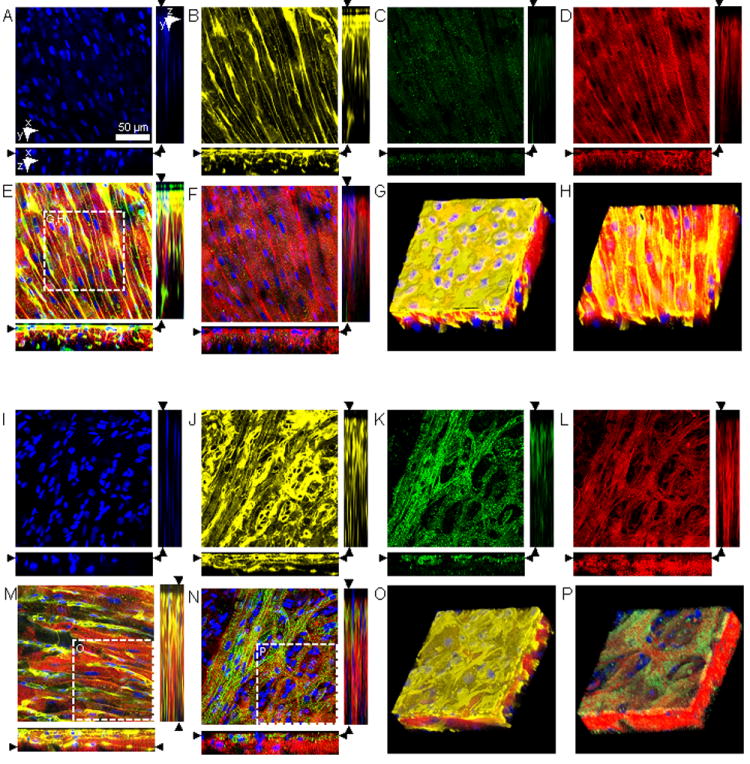
Conventional confocal microscopy of AWM and SAN. Image stacks were acquired from the epicardial surface into sub-epicardial (A-F) AWM and (I-N) SAN tissue labeled with (A,I) DAPI, (B,J) WGA, and (C,K) anti-HCN4 and (D,L) anti-sarcomeric α-actinin. (E) Overlaid DAPI, WGA and anti-sarcomeric α-actinin images illustrate the regular, dense arrangement of myocytes in AWM. (F) Overlaid DAPI, anti-HCN4 and anti-sarcomeric α-actinin images. (G) Three-dimensional reconstruction of region marked in (E) displaying AWM beneath an epicardial layer with a thickness of 3.6 μm. (H) Three-dimensional reconstruction of AWM after cropping of epicardial layer. SAN tissue exhibits a layer of HCN4-positive, reticular arranged myocytes and oval shaped clearings of variable sizes beneath an epicardial layer. Below this layer were regular arranged HCN4-negative myocytes. (M) Overlaid DAPI, WGA and anti-sarcomeric α-actinin images illustrate the regular, subnodal myocyte arrangement at a depth of 26.6 μm. (N) Overlaid DAPI, anti-HCN4 and anti-sarcomeric α-actinin images illustrate the irregular arrangement of HCN4-positive myocytes at a depth of 5.6 μm. (O) Three-dimensional reconstruction of region marked in (M) reveal the 3-layered arrangement of SAN tissue. (P) Reconstruction of region marked in (N) presents the SAN and AWM layer after cropping of epicardial layer. Scale bar in (A) applies to (B-F) and (I-N).
Statistical analyses were performed on acquired images from a group of animals (Table 1). Image analysis from the AWM and SAN tissue showed that the epicardial layer had a thickness of 7.5±3.5 μm and 5.5±2.9 μm, respectively. In the compact AVN the thickness of the endocardial layer was 3.2±2.4 μm. In SAN and AVN tissue, the thickness of the nodal layer was 10.3±3.2 μm and 17.2±8.7 μm, respectively. Analysis of HCN4 signal intensities showed that these were significantly (P < 0.005) higher in the nodal layer of the SAN and AVN preparations than in the AWM (online-only Data Supplemental Figure 5). Also, intensities in the nodal layers were significantly higher than in their respective subnodal layers. We did not find significant differences between HCN4 intensities in the AWM and in subnodal SAN and AVN layers.
Table 1.
Numbers of Images and Animals Used for Image Analysis.
| Tissue Type | Imaging of Fixed Tissue [images/animals] | Imaging of Living Hearts [images/animals] | Depth and Thickness Profiles [images/animals] |
|---|---|---|---|
| AWM | 16/6 | 37/7 | 13/6 |
| SAN | 13/6 | 40/6 | 11/6 |
| AVN | 10/6 | 29/6 | 9/6 |
Quantitative Characterization of Tissue Microstructure
We evaluated the ability of two methods of 2D texture analysis to discriminate between AWM and nodal tissue using WGA images. The first method measured the texture orientation from Fourier transformed images. The second method characterized texture orientation from 2nd order image moments of image regions.Figure 3a-c presents exemplary images and results from these analyses applied to the WGA images presented in Figures 2b, j and online-only Data Supplemental Figure 3b.These images were overlaid with glyphs characterizing local orientation and anisotropy ratio of 2nd order image moments. It is apparent that the microstructural arrangement of AWM (Figure 3a) differs from that of nodal tissue (Figure 3b,c). In this example, both methods of texture analysis indicated a larger degree of orientation in AWM than in SAN and AVN tissue (Figure 3d,e).
Figure 3.
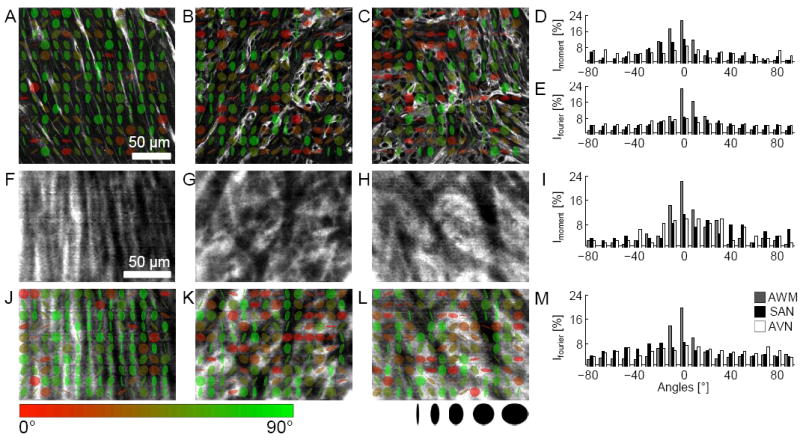
Quantitative characterization of microstructure in fixed and living tissue. WGA images of fixed tissue preparations from AWM (Figure 2b), SAN (Figure 2j), and AVN regions (online-only Data Supplemental Figure 3b) were analyzed using 2nd order moments. (A) AWM, (B) SAN and (C) AVN images overlaid with glyphs visualize orientation of the minor eigen-axis (color coded, bar) and anisotropy ratio of eigen-values (shape coded) of local image moments. Histogram of orientations based on (D) 2nd order moments and (E) Fourier transform. Kurtosis of histograms from 2nd order moment and Fourier analysis is a marker of myocyte alignment. FCM images of living tissue from (F) AWM, (G) SAN and (H) AVN regions labeled with a dextran-fluorophore conjugate. Living tissues exhibited similar micro-structural features as in fixed tissues (A-C). (J) AWM, (K) SAN and (L) AVN images overlaid with glyphs. Quantitative analysis of (I) 2nd order moments and (M) Fourier transforms suggest larger myocyte alignment in AWM regions versus SAN or AVN. Scale bar in (A) applies to (B,C). Scale bar in (F) applies to (G-H) and (J-L).
Imaging of Living Hearts using FCM
We hypothesized that imaging with FCM using a fluorescent marker of the extracellular space will allow discrimination of tissue types in living hearts. In these studies, we used dextran-conjugated fluorophores with a molecular weight of 10 kDa and a FCM microprobe with a working distance of 50 μm. Previous studies demonstrated that dextran-conjugates of 3 to 10 kDa molecular weight penetrate endothelial endocardium, endothelial epicardium and myocardial capillary endothelium in rat17, and through the epicardium into ventricular myocardium in rabbit.18 However, dextran-conjugates of this molecular weight do not penetrate intact cell membranes (see for instance19) and thus label specifically the extracellular space. FCM image sequences were acquired at a rate of 12 images/s from the AWM and nodal regions following topical application of extracellular fluorophore (online-only Data Supplemental Figure 6). The image sequences of nodal tissue were acquired from an intact living heart from similar regions that were excised for the aforementioned conventional confocal microscopy study (Figure 1 and online-only Data Supplemental Figure 1). Examples of FCM image sequence are shown in Movie 1 for AWM and Movie 2 for SAN. In these images bright and dark regions correspond to fluorescence in the extracellular spaces and the absence of fluorescence in the intracellular spaces, respectively. The average SNR in 17 image sequences was 12.1±3.3 (see online-only Data Supplemental Data for detail). Images from the dextran-labeled AWM and nodal regions using FCM bear resemblance to WGA images using conventional confocal microscopy. FCM images of the AWM exhibited regular striations (Figure 3f) as found previously in WGA images using conventional confocal microscopy (Figure 2b). In contrast, images from nodal regions revealed irregular microstructural arrangements (Figure 3g,h) similar as in WGA images (Figure 2j and online-only Data Supplemental Figure 3b).
Characterization of FCM Images
We investigated if tissue types can be discriminated in images from FCM using our two methods of texture analysis. Examples of this evaluation are presented in Figure 3j-l. The FCM images shown in Figure 3f-h were overlaid with glyphs characterizing local orientation and anisotropy ratio of 2nd order image moments. Fourier and 2nd order image moment analysis of the image from the AWM demonstrated a prominent texture orientation (Figure 3i,m). Nodal tissue did not feature a similar degree of orientation and the intensities were approximately uniform over the range of angles.
Statistical Evaluation of Approach for Tissue Discrimination
Texture orientation from 2nd order image moments and Fourier transforms of sets of WGA (Figure 4a,e) and dextran-labeled images (Figure 4b,f) were obtained using conventional confocal microscopy and FCM respectively. The resulting intensity and local orientation profiles from these sets of images were similar to those presented for exemplary images (Figure 3d,e versus 4a,e and Figure 3i,m versus 4b,f). We used the sum of intensities and occurrence of local orientation for angles between -15 and +15° as a measure of spatial regularity. The summary intensity (I±15) was found to be significantly different in images of AWM and nodal tissue from both conventional confocal microscopy and FCM (Figure 4c,g). Similarly, the standard deviation (Istd) of intensity profiles allowed discrimination of nodal and AWM tissue acquired with conventional confocal microscopy or FCM (Figure 4d,h).
Figure 4.
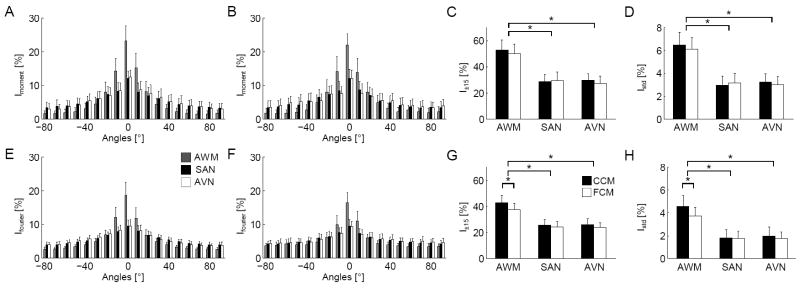
Statistical characterization of images from AWM, SAN, and AVN regions. Histograms of orientations calculated from (A) 2nd order moments and (B) Fourier transforms of images from fixed, WGA labeled tissue acquired with conventional confocal microscopy (CCM). Histograms of orientations from (E) 2nd order moments and (F) Fourier transforms of FCM images from tissue labeled with a dextran-fluorophore conjugate. I±15 of AWM and nodal tissues were significantly different using the (C) 2nd order image moment and (G) Fourier analyses. (D,H) Istd showed similar significant differences.*P < 0.05, compared with nodal tissue (one-way ANOVA with post-hoc Tukey-Kramer).
Imaging and Characterization of Human Tissue Microstructure
We investigated fetal and infant tissue microstructure in human. We observed similar microstructural features in human AWM tissue as described above for our rodent model (Figure 5a,b versus 2b). The thickness of the epicardial layer in the fetal and infant AWM tissues was 11.2 and 14.6 μm, respectively. Features of AVN regions were similar in rodent and human (Figure 5c versus online-only Data Supplemental Figure 3b). The thickness of the endocardial layer in the fetal AVN tissue was 3.6 μm. In addition, texture analysis based on 2nd order image moments and Fourier transforms indicated a larger degree of orientation in AWM than in AVN tissue (online-only Data Supplemental Figure 7 and Figure 5d,e).
Figure 5.
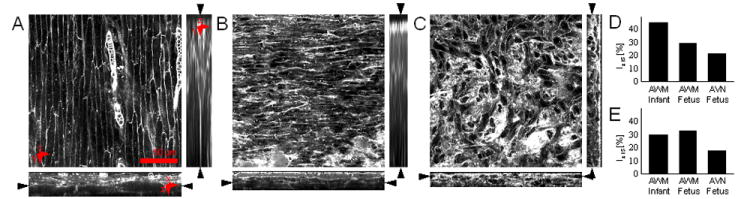
Conventional confocal microscopic images from human cardiac tissue. Image stacks were acquired from the epicardial surface into sub-epicardial AWM from (A) infant and (B) fetal heart. (C) Image stack from endocardial surface into sub-endocardial AVN tissue from fetal heart. Analysis of (D) 2nd order moments and (E) Fourier transforms of (A-C) indicate higher myocyte alignment in AWM versus AVN region, but a similar myocyte alignment in AWM regions in the infant and fetal heart.
Discussion
The microstructure of the SAN and AVN has been used for identification since their discovery by Keith and Flack in 190720 and Tawara in 190621, respectively. These studies were based on thin sections of nodal tissues, which revealed the characteristic microstructure using light microscopy. Here, we demonstrate that nodal tissue types can be identified in living hearts based on confocal microscopy and fluorescent labeling of the extracellular space. Our approach demonstrated that confocal microscopy can acquire image data at the appropriate specific depth within the intact heart. We found that AWM, SAN and AVN tissue is beneath a thin surface layer of tissue that does not obstruct confocal microscopic imaging in the rodent model. In our exemplary study on human tissue we found AWM and AVN tissue at similar small depths. We also introduced methods for texture analysis, which provided us with a quantitative tool for automated tissue identification. We suggest that the presented approach has the potential to identify nodal tissue in the in-situ heart and complement other methods for tissue identification in a clinical setting. An obvious clinical application is related to pediatric reconstructive heart surgery. The described approach allows surgeons to map out the location of nodal tissue and thus avoid tissue damage, such as what might occur by suture injury. Suture injury is a common clinical cause for SAN and AVN dysfunction.22, 23 In instances where repair must be made relatively close to nodal regions, surgeon could place sutures or incision lines with a higher level of confidence using the FCM. We suggest that our approach for tissue identification can help to reduce the incidence of complications caused by injury of nodal tissues.
FCM imaging complements other emerging technologies suggested for in-vivo tissue imaging such as micro-optical coherence tomography24, conventional fluorescence imaging with miniaturized microscopes25 and fluorescence spectroscopy.26 All these technologies have the potential to provide clinicians with real-time visual information beyond reflected visible light. In contrast to the other emerging imaging technologies, FCM systems are already available commercially and FDA-approved for applications in the gastrointestinal27 and pulmonary tracts28. However, the application of FCM in other clinical fields is hampered, in part, because of the lack of reliable fluorescent labeling strategies. Commonly, fluorescent labels consist of fluorophores conjugated to a ligand. The ligand typically targets a specific site of interest. Here, we investigated dextran conjugated to Alexa Fluor 488 to target the extracellular space. We demonstrated that the dextran conjugate was able to label the extracellular space in the living perfused heart with a high SNR. The labeling allowed for visualization of tissue microstructure and subsequent image processing and quantitative analysis.
A limitation of the presented approach for clinical translation is the potential toxicity of fluorophores. The toxicity of many fluorophores has been recently reviewed29 and several fluorophores are routinely used for human applications. The quantity of dextran–Alexa conjugate used in this study was approximately 50 pg per imaging trial. While no toxicity-related information is available for this conjugate and Alexa Fluor 488, other hydrophilic conjugates of dextran and FDA approved fluorophores are available. A promising fluorophore for labeling of the extracellular space is Fluorescite®, which is an FDA class IIa drug and already approved for use in ophthalmic angiography.30 A study exploring the use of intravenously injected Fluorescite® in FCM imaging of the gastrointestinal tract in-vivo produced a SNR from acquired images that was comparable to the value obtained in our living heart studies.31
We developed our approach based on a microstructural characterization of cardiac tissue using conventional three-dimensional confocal microscopy. The thicknesses of endocardial and epicardial layers determined from WGA images indicated that these layers do not constitute obstacles to confocal imaging of underlying tissue layers, for instance by depth dependent attenuation of the excitation and emitted light. We used labeling for HCN4 to confirm the presence of nodal tissue and measured the thickness of nodal layers. The measured thickness of the nodal layers is sufficiently large versus the thickness of optical sections acquired with FCM (approximately 10 μm). We suggest that this type of microstructural analysis can provide important input for the development of imaging microprobes that are specialized for imaging applications. This analysis can assist in the development of microprobes tailored to age groups, disease states, and anatomical regions for FCM imaging of cardiac and other tissues.
Supplementary Material
Clinical Perspective.
Open heart reconstructive surgery is the state-of-the-art approach to repair congenital heart defects in neonatals. Complications of these surgeries are trauma to the sinoatrial and atrioventricular node. Patients with persistent complications after surgery require cardiac rhythm management using implantable pacemakers. The need for implantation of permanent pacemakers after these surgeries ranges from 1-45%. A cause for these complications is that nodal tissues are not visible using surgical loupes or microscopes. Nodal tissues are commonly identified from anatomical landmarks. However, identification in hearts with congenital defects can be hindered by individual anatomical variations. In this study, we introduce an approach for identification of cardiac tissue in cardioplegic hearts based on fiber-optics confocal microscopy and fluorescent labeling. A particular clinical application is in pediatric reconstructive heart surgery. Our investigations on cardiac tissues in a rodent model and human autopsy hearts indicate that surgeons can apply the developed approach to map locations of nodal tissues. This mapping will allow surgeons to avoid damage to nodal tissues, for instance, by suture injury, which is a common clinical cause for nodal dysfunction. An important application of fiber-optics confocal microscopy is the repair of defects in proximity to nodal regions. Our approach may allow surgeons to place sutures or incision lines with a higher level of confidence. We propose that clinical application of the presented approach can help to reduce the incidence of complications caused by injury of nodal tissues.
Acknowledgments
We are grateful to Dr. F. Lacombe (Mauna Kea Technologies, Paris, France) for providing us with microprobes and Mr. L. K. Erickson, PA (ASCP) (Department of Anatomic Pathology, Primary Children’s Medical Center, Salt Lake City, Utah) for his help with human heart specimens.
Sources of Funding
This research was supported by the US National Institutes of Health (R21 HL108099), the Nora Eccles Treadwell Foundation, and the Utah Science, Technology and Research (USTAR) initiative.
Footnotes
Disclosures
None
References
- 1.Parker SE, Mai CT, Canfield MA, Rickard R, Wang Y, Meyer RE, Anderson P, Mason CA, Collins JS, Kirby RS, Correa A. Updated national birth prevalence estimates for selected birth defects in the united states, 2004-2006. Birth defects research Part A, Clinical and molecular teratology. 2010;88:1008–1016. doi: 10.1002/bdra.20735. [DOI] [PubMed] [Google Scholar]
- 2.Wolff GS, Rowland TW, Ellison RC. Surgically induced right bundle-branch block with left anterior hemiblock: An ominous sign in postoperative tetralogy of fallot. Circulation. 1972;46:587–594. doi: 10.1161/01.cir.46.3.587. [DOI] [PubMed] [Google Scholar]
- 3.Gross GJ, Chiu CC, Hamilton RM, Kirsh JA, Stephenson EA. Natural history of postoperative heart block in congenital heart disease: Implications for pacing intervention. Heart Rhythm. 2006;3:601–604. doi: 10.1016/j.hrthm.2006.01.023. [DOI] [PubMed] [Google Scholar]
- 4.Merin O, Ilan M, Oren A, Fink D, Deeb M, Bitran D, Silberman S. Permanent pacemaker implantation following cardiac surgery: Indications and long-term follow-up. Pacing Clin Electrophysiol. 2009;32:7–12. doi: 10.1111/j.1540-8159.2009.02170.x. [DOI] [PubMed] [Google Scholar]
- 5.Bogers AJ, Head SJ, de Jong PL, Witsenburg M, Kappetein AP. Long term follow up after surgery in congenitally corrected transposition of the great arteries with a right ventricle in the systemic circulation. Journal of cardiothoracic surgery. 2010;5:74. doi: 10.1186/1749-8090-5-74. [DOI] [PMC free article] [PubMed] [Google Scholar]
- 6.Graham TP, Jr, Bernard YD, Mellen BG, Celermajer D, Baumgartner H, Cetta F, Connolly HM, Davidson WR, Dellborg M, Foster E, Gersony WM, Gessner IH, Hurwitz RA, Kaemmerer H, Kugler JD, Murphy DJ, Noonan JA, Morris C, Perloff JK, Sanders SP, Sutherland JL. Long-term outcome in congenitally corrected transposition of the great arteries: A multi-institutional study. J Am Coll Cardiol. 2000;36:255–261. doi: 10.1016/s0735-1097(00)00682-3. [DOI] [PubMed] [Google Scholar]
- 7.Anderson RH, Ho SY, Becker AE. The surgical anatomy of the conduction tissues. Thorax. 1983;38:408–420. doi: 10.1136/thx.38.6.408. [DOI] [PMC free article] [PubMed] [Google Scholar]
- 8.Smith A, Ho SY, Anderson RH, Connell MG, Arnold R, Wilkinson JL, Cook AC. The diverse cardiac morphology seen in hearts with isomerism of the atrial appendages with reference to the disposition of the specialised conduction system. Cardiol Young. 2006;16:437–454. doi: 10.1017/S1047951106000382. [DOI] [PubMed] [Google Scholar]
- 9.Brigham EO. The fast fourier transform and its applications. Prentice Hall; 1988. [Google Scholar]
- 10.Gonzalez RC, Woods RE. Digital image processing. Reading, MA: Addison-Wesley; 1992. [Google Scholar]
- 11.Bhavanandan VP, Katlic AW. The interaction of wheat germ agglutinin with sialoglycoproteins. The role of sialic acid. J Biol Chem. 1979;254:4000–4008. [PubMed] [Google Scholar]
- 12.Soderstrom KO. Lectin binding to collagen strands in histologic tissue sections. Histochemistry. 1987;87:557–560. doi: 10.1007/BF00492470. [DOI] [PubMed] [Google Scholar]
- 13.Chandler NJ, Greener ID, Tellez JO, Inada S, Musa H, Molenaar P, Difrancesco D, Baruscotti M, Longhi R, Anderson RH, Billeter R, Sharma V, Sigg DC, Boyett MR, Dobrzynski H. Molecular architecture of the human sinus node: Insights into the function of the cardiac pacemaker. Circulation. 2009;119:1562–1575. doi: 10.1161/CIRCULATIONAHA.108.804369. [DOI] [PubMed] [Google Scholar]
- 14.Yoo S, Dobrzynski H, Fedorov VV, Xu SZ, Yamanushi TT, Jones SA, Yamamoto M, Nikolski VP, Efimov IR, Boyett MR. Localization of na+ channel isoforms at the atrioventricular junction and atrioventricular node in the rat. Circulation. 2006;114:1360–1371. doi: 10.1161/CIRCULATIONAHA.106.613182. [DOI] [PubMed] [Google Scholar]
- 15.Yamamoto M, Dobrzynski H, Tellez J, Niwa R, Billeter R, Honjo H, Kodama I, Boyett MR. Extended atrial conduction system characterised by the expression of the hcn4 channel and connexin45. Cardiovasc Res. 2006;72:271–281. doi: 10.1016/j.cardiores.2006.07.026. [DOI] [PubMed] [Google Scholar]
- 16.Brioschi C, Micheloni S, Tellez JO, Pisoni G, Longhi R, Moroni P, Billeter R, Barbuti A, Dobrzynski H, Boyett MR, DiFrancesco D, Baruscotti M. Distribution of the pacemaker hcn4 channel mrna and protein in the rabbit sinoatrial node. J Mol Cell Cardiol. 2009;47:221–227. doi: 10.1016/j.yjmcc.2009.04.009. [DOI] [PubMed] [Google Scholar]
- 17.Andries LJ, Brutsaert DL. Endocardial endothelium in the rat: Junctional organization and permeability. Cell Tissue Res. 1994;277:391–400. doi: 10.1007/BF00300211. [DOI] [PubMed] [Google Scholar]
- 18.Lasher RA, Hitchcock RW, Sachse FB. Towards modeling of cardiac micro-structure with catheter-based confocal microscopy: A novel approach for dye delivery and tissue characterization. IEEE Trans Med Imaging. 2009;28:1156–1164. doi: 10.1109/TMI.2009.2017376. [DOI] [PubMed] [Google Scholar]
- 19.Savio-Galimberti E, Frank J, Inoue M, Goldhaber JI, Cannell MB, Bridge JH, Sachse FB. Novel features of the rabbit transverse tubular system revealed by quantitative analysis of three-dimensional reconstructions from confocal images. Biophys J. 2008;95:2053–2062. doi: 10.1529/biophysj.108.130617. [DOI] [PMC free article] [PubMed] [Google Scholar]
- 20.Keith A, Flack M. The form and nature of the muscular connections between the primary divisions of the vertebrate heart. J Anat Physiol. 1907;41:172–189. [PMC free article] [PubMed] [Google Scholar]
- 21.Tawara S. Das reizleitungssystem des saeugetierherzens. Jena: Fischer; 1906. [Google Scholar]
- 22.Takahashi H, Oshima Y, Yoshida M, Yamaguchi M, Okada K, Okita Y. Sinus node dysfunction after repair of partial anomalous pulmonary venous connection. J Thorac Cardiovasc Surg. 2008;136:329–334. doi: 10.1016/j.jtcvs.2007.12.039. [DOI] [PubMed] [Google Scholar]
- 23.Mongeon FP, Burkhart HM, Ammash NM, Dearani JA, Li Z, Warnes CA, Connolly HM. Indications and outcomes of surgical closure of ventricular septal defect in adults. JACC Cardiovascular interventions. 2010;3:290–297. doi: 10.1016/j.jcin.2009.12.007. [DOI] [PubMed] [Google Scholar]
- 24.Liu L, Gardecki JA, Nadkarni SK, Toussaint JD, Yagi Y, Bouma BE, Tearney GJ. Imaging the subcellular structure of human coronary atherosclerosis using micro-optical coherence tomography. Nat Med. 2011;17:1010–1014. doi: 10.1038/nm.2409. [DOI] [PMC free article] [PubMed] [Google Scholar]
- 25.Ghosh KK, Burns LD, Cocker ED, Nimmerjahn A, Ziv Y, Gamal AE, Schnitzer MJ. Miniaturized integration of a fluorescence microscope. Nat Methods. 2011;8:871–878. doi: 10.1038/nmeth.1694. [DOI] [PMC free article] [PubMed] [Google Scholar]
- 26.Venius J, Bagdonas S, Zurauskas E, Rotomskis R. Visualization of human heart conduction system by means of fluorescence spectroscopy. J Biomed Opt. 2011;16:107001. doi: 10.1117/1.3631786. [DOI] [PubMed] [Google Scholar]
- 27.Buchner AM, Shahid MW, Heckman MG, Krishna M, Ghabril M, Hasan M, Crook JE, Gomez V, Raimondo M, Woodward T, Wolfsen HC, Wallace MB. Comparison of probe-based confocal laser endomicroscopy with virtual chromoendoscopy for classification of colon polyps. Gastroenterology. 2010;138:834–842. doi: 10.1053/j.gastro.2009.10.053. [DOI] [PubMed] [Google Scholar]
- 28.Salaun M, Roussel F, Bourg-Heckly G, Vever-Bizet C, Dominique S, Genevois A, Jounieaux V, Zalcman G, Bergot E, Jean-Michel V, Thiberville L. In vivo probe-based confocal laser endomicroscopy in amiodarone-related pneumonia. Eur Respir J. 2012 Sep 27; doi: 10.1183/09031936.00191911. Epub ahead of print. [DOI] [PubMed] [Google Scholar]
- 29.Alford R, Simpson HM, Duberman J, Hill GC, Ogawa M, Regino C, Kobayashi H, Choyke PL. Toxicity of organic fluorophores used in molecular imaging: Literature review. Mol Imaging. 2009;8:341–354. [PubMed] [Google Scholar]
- 30.Blauth CI, Arnold JV, Schulenberg WE, McCartney AC, Taylor KM. Cerebral microembolism during cardiopulmonary bypass. Retinal microvascular studies in vivo with fluorescein angiography. J Thorac Cardiovasc Surg. 1988;95:668–676. [PubMed] [Google Scholar]
- 31.Shahid MW, Crook JE, Meining A, Perchant A, Buchner A, Gomez V, Wallace MB. Exploring the optimal fluorescein dose in probe-based confocal laser endomicroscopy for colonic imaging. Journal of interventional gastroenterology. 2011;1:166–171. doi: 10.4161/jig.19953. [DOI] [PMC free article] [PubMed] [Google Scholar]
Associated Data
This section collects any data citations, data availability statements, or supplementary materials included in this article.