Abstract
Different geographical origins and species of Paris obtained from southwestern China were discriminated by near infrared (NIR) spectroscopy and high performance liquid chromatography (HPLC) combined with multivariate analysis. The NIR parameter settings were scanning (64 times), resolution (4 cm−1), scanning range (10000 cm−1∼4000 cm−1) and parallel collection (3 times). NIR spectrum was optimized by TQ 8.6 software, and the ranges 7455∼6852 cm−1 and 5973∼4007 cm−1 were selected according to the spectrum standard deviation. The contents of polyphyllin I, polyphyllin II, polyphyllin VI, and polyphyllin VII and total steroid saponins were detected by HPLC. The contents of chemical components data matrix and spectrum data matrix were integrated and analyzed by partial least squares discriminant analysis (PLS-DA). From the PLS-DA model of NIR spectrum, Paris samples were separated into three groups according to the different geographical origins. The R2X and Q2Y described accumulative contribution rates were 99.50% and 94.03% of the total variance, respectively. The PLS-DA model according to 12 species of Paris described 99.62% of the variation in X and predicted 95.23% in Y. The results of the contents of chemical components described differences among collections quantitatively. A multivariate statistical model of PLS-DA showed geographical origins of Paris had a much greater influence on Paris compared with species. NIR and HPLC combined with multivariate analysis could discriminate different geographical origins and different species. The quality of Paris showed regional dependence.
Introduction
Traditional Chinese medicine (TCM) is gaining greater acceptance throughout the world, especially in western countries, for improving health and preventing or healing diseases [1]. It is well known that TCM are composed of animal drugs, medicinal plants, fungi and minerals, among which medicinal plants play an important role for their wealthy sources, rich species and diverse components [2]. These plants have been used to treat various diseases for thousand years in Eastern Asia [3]. Recently, a large number of bioactive components and metabolites were found from medicinal plants, which are considered as the key ingredients of TCM development and utilization [4]. However, the quality and contents of bioactive components in medicinal plants are extremely variable depending on species, geographical origins, cultivation, growth altitude, soil, harvest time and climate conditions such as temperature, sun exposure time and rainfall [5], [6]. The clarification of the source and species of medicinal plants plays the decisive role in the quality control of TCM formulas, which is the fundamental prerequisite for its worldwide recognition and acceptance.
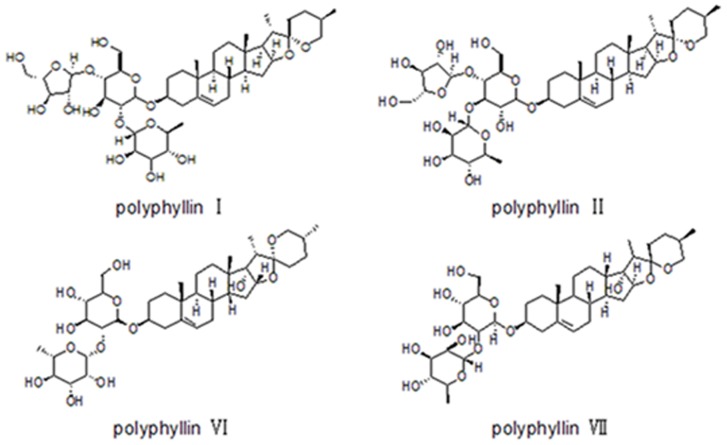
Paris, belonging to the family Liliaceae, contains about 24 species and mainly distributes in Europe and Eastern Asia. There are 22 species of Paris in China, and the diversity center of Paris is located in Southwest China [7]. The dried rhizome paridis is the main raw material of Chinese patent drugs “Yunnan Baiyao”, “GongXue Ning”, and “Jidesheng snake tablet” [8]. The phytochemistry research indicates that abundant active ingredients including steroidal saponins, flavonoids, fatty acid ester and endophytic fungi are in the dried rhizome of Paris, and steroid saponins such as polyphyllin I, polyphyllin II, polyphyllin VI, and polyphyllin VII are the most investigated ones [8], [9], [10], [11]. Their chemical structures are depicted in Figure 1. Modern pharmacology has demonstrated that polyphyllin has powerful pharmacological activities on stypticity, spermicide, homeostasis, analgesic, and as a potential anti-cancer drug for the functions of cytotoxicity and induction of apoptosis [12], [13], [14].
Figure 1. Chemical structures of polyphyllin I, II, VI and VII.
In folk of China, several species of Paris plants have a history used to treat snakebite, hemostasis, fractures, parotitis and abscess [8]. However, only the rhizomes of P. polyphylla var. chinensis and P. polyphylla var. yunnanensis are officially recorded in Chinese Pharmacopoeia. As we know, the morphological characteristics are similar between close related species. It is much more difficult to discriminate dry rhizomes of the same genus by traditional morphological identification method, especially the original powder. On the other hand, common methods like microscopic identification, thin layer chromatography are laborious and time-consuming.
In recent years, near infrared (NIR) spectroscopic methods have been used in analysis of vegetable, fruit, coffee, green tea, wine, plant and pharmaceutical [15], [16], [17], [18], [19], [20], [21]. High performance liquid chromatography (HPLC) is considered as a robust method in numerous applications of qualitative and quantitative analyses of TCM for its easy operation, high accuracy and wide suitability. In quantification, determination of a group of principal active constituents with similar or different structures in one medicinal plant has been widely implemented [22], [23], [24], [25].
In this research, NIR and HPLC in combination with multivariate statistical analysis were applied for discriminating Paris plants of different species and different origins quantitatively and qualitatively, and also found the key factor of identification of Paris.
Materials and Methods
Materials
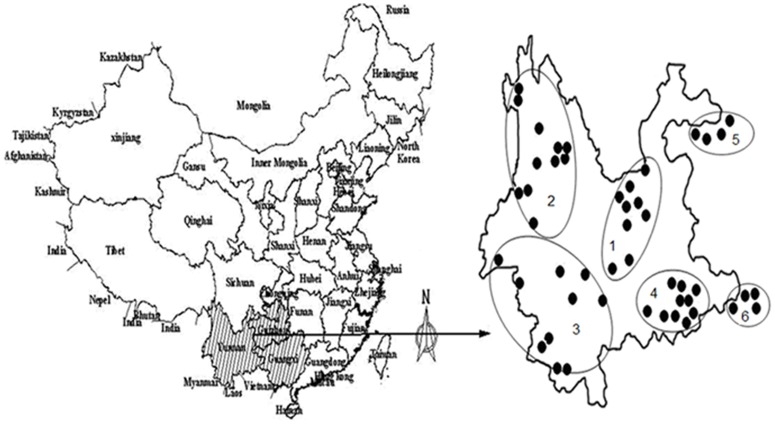
Forty eight samples of wild Paris including 12 species were collected from three main distribution areas in southwest China: Yunnan, Guizhou and Guangxi Provinces (Figure 2). They were identified and authenticated by Doctor J.Y. Zhang, Yunnan Academy of Agricultural Sciences (Table 1). The herbariums were preserved in the institute of medicinal plants, Yunnan academy of agricultural sciences. The rhizomes of Paris plants were dried at the temperature of 50°C, and then ground to fine powder and storaged in the zip lock bags until further analysis. No specific permits were required for the described field studies, as no endangered or protected species were sampled, and the localities where the samples came from are not protected in any way.
Figure 2. The wild Paris collected from main geographical origins in China.
1: Central Yunnan (16#, 18#, 19#, 21#, 26#, 32#, 33#, 37#, 43#); 2: Northwestern Yunnan (9#, 10#, 11#, 12#, 17#, 24#, 28#, 36#, 38#, 39#, 46#); 3: Southwestern Yunnan (22#, 25#, 27#, 30#, 35#, 40#, 41#, 44#, 47#, 48#); 4: Southeastern Yunnan (1#, 3#, 4#, 13#, 20#, 23#, 29#, 31#, 34#, 42#); 5: Guizhou (2#, 6#, 7#, 8#); 6: Guangxi (5#, 14#, 15#, 45#).
Table 1. Sample species and locations.
| Sample number | Species | Location | Sample number | Species | Location | ||
| 1# | P. caobangensis | Wenshan, Yunnan | 25# | P. polyphylla var. yunnanensis | Puer, Yunnan | ||
| 2# | P. cronquistii | Bijie, Guizhou | 26# | P. polyphylla var. yunnanensis | Yuxi, Yunnan | ||
| 3# | P. cronquistii | Wenshan, Yunnan | 27# | P. polyphylla var. yunnanensis | Lincang, Yunnan | ||
| 4# | P. cronquistii var. xichouensis | Wenshan, Yunnan | 28# | P. polyphylla var. yunnanensis | Nujiang, Yunnan | ||
| 5# | P. delavayi var. petiolata | Baise, Guangxi | 29# | P. polyphylla var. yunnanensis | Wenshan, Yunnan | ||
| 6# | P. fargesii | Bijie, Guizhou | 30# | P. polyphylla var. yunnanensis | Puer, Yunnan | ||
| 7# | P. fargesii | Bijie, Guizhou | 31# | P. polyphylla var. yunnanensis | Gejiu, Yunnan | ||
| 8# | P. fargesii | Bijie, Guizhou | 32# | P. polyphylla var. yunnanensis | Yuxi, Yunnan | ||
| 9# | P. mairei | Dali, Yunnan | 33# | P. polyphylla var. yunnanensis | Kunming, Yunnan | ||
| 10# | P. polyphylla | Dali, Yunnan | 34# | P. polyphylla var. yunnanensis | Wenshan, Yunnan | ||
| 11# | P. polyphylla | Lijiang, Yunnan | 35# | P. polyphylla var. yunnanensis | Puer, Yunnan | ||
| 12# | P. polyphylla var. alba | Dali, Yunnan | 36# | P. polyphylla var. yunnanensis | Nujiang, Yunnan | ||
| 13# | P. polyphylla var. chinensis | Wenshan, Yunnan | 37# | P. polyphylla var. yunnanensis | Kunming, Yunnan | ||
| 14# | P. polyphylla var. chinensis | Baise, Guangxi | 38# | P. polyphylla var. yunnanensis | Nujiang, Yunnan | ||
| 15# | P. polyphylla var. chinensis | Baise, Guangxi | 39# | P. polyphylla var. yunnanensis | Nujiang, Yunnan | ||
| 16# | P. polyphylla var. pseudothib | Dongchuan, Yunnan | 40# | P. polyphylla var. yunnanensis | Xishuangbanna, Yunnan | ||
| 17# | P. polyphylla var. yunnanensis | Baoshan, Yunnan | 41# | P. polyphylla var. yunnanensis | Lincang, Yunnan | ||
| 18# | P. polyphylla var. yunnanensis | Kunming, Yunnan | 42# | P. polyphylla var. yunnanensis | Wenshan, Yunnan | ||
| 19# | P. polyphylla var. yunnanensis | Kunming, Yunnan | 43# | P. polyphylla var. yunnanensis | Kunming, Yunnan | ||
| 20# | P. polyphylla var. yunnanensis | Wenshan, Yunnan | 44# | P. vietnamensis | Lincang, Yunnan | ||
| 21# | P. polyphylla var. yunnanensis | Chuxiong, Yunnan | 45# | P. cronquistii var. xichouensis | Baise, Guangxi | ||
| 22# | P. polyphylla var. yunnanensis | Puer, Yunnan | 46# | P. mairei | Nujiang, Yunnan | ||
| 23# | P. polyphylla var. yunnanensis | Wenshan, Yunnan | 47# | P. polyphylla var. yunnanensis | Xishuangbanna, Yunnan | ||
| 24# | P. polyphylla var. yunnanensis | Nujiang, Yunnan | 48# | P. polyphylla var. yunnanensis | Dehong, Yunnan | ||
Instruments and Reagents
The standards (polyphyllin I, polyphyllin II, polyphyllin VI, and polyphyllin VII) were purchased from the National Institute for Control of Pharmaceutical and Biological Products (Beijing, China). The purity of all the standards was greater than or equal to 98%. HPLC grade acetonitrile and methanol were obtained from TEDIA (Ohio, USA). Purified water (HPLC grade) was produced by Milli-Q system (Massachusetts, USA). Other reagents were all of analytical grade.
HPLC system (Shimadzu Technologies, Kyoto, Japan) was equipped with Workstation software class-VP (Shimadzu Technologies) for recording chromatograms and composed of HPLC-10 integrator, HPLC-10ATVP pump, and SDP-M10A VP detector (DAD). All chromatographic separations were carried out on a Shim-pack VP-ODS C18 (150×4.6 mm, particle size: 5 µm) from Shimadzu (Kyoto, Japan). Antaris II Fourier Transform Near Infrared Spectroscopy (Thermo Fisher Scientific INC., USA) was attached with diffuse reflection module. The spectrum collecting software Result™ 2.1 and the analysis software TQ 8.6 included in the instrument were employed. Traditional Chinese medicine grinder DFT-100 (Zhejiang wenling Linda machinery co., LTD) was applied. Stainless steel sieve tray 80 mesh (Tai'an of Chinese and western, Beijing) was used. The multivariate data analysis software was SIMCA-P 11.0 (Umetrics, Umea, Sweden).
Sample Preparation for NIR Analysis
The rhizomes powder (20.0 g) was weighed before it was sufficient mixed, then transferred to the sample cup of NIR and compressed. Collecting the spectrum of NIR by diffuse reflection module of Result™ 2.1. The parameter settings were scanning (64 times), resolution (4 cm−1), scanning range (10000 cm−1∼4000 cm−1) and parallel collection (3 times).
Sample Preparation for HPLC Analysis
The Paris rhizomes powder (0.5000 g) was extracted with 25 mL alcohol under refluxing for 45 min. After cooling to room temperature, 1.5 mL of the extract was transferred into 2 mL centrifuge tube, centrifuged at 16,000 rpm for 10 min, and then reserved supernatant for detection. The contents of polyphyllin I, polyphyllin II, polyphyllin VI, and polyphyllin VII and total steroid saponins were detected by HPLC. The mobile phase solvents, flow-rate, injection volume, column temperature and detection wavelength have been optimization by the reference of Zhang, et al [11].
Data Preprocessing
The NIR spectrums of Paris were preprocessed with Norris, mean centering, standardization, and second derivative successively by software TQ 8.6. The stability of 25 times parallel collections of a sample (30 #) was considered in the 95% confidence by SIMCA-P software 11.0.
The NIR resulting .spc files were converted to .csv data files by the multivariate statistical analysis of SIMCA-P software 11.0. The HPLC resulting .xls files were converted to .csv data files by the Excel software. Then the .csv files were imported to multivariate statistical analysis of SIMCA-P software 11.0. Different geographical origins and species of wild Paris were identified by partial least squares discriminant analysis (PLS-DA) according to the NIR spectra and the contents of chemical compositions. PLS was used to visualize general clustering, trends, and outliers among the observations.
Multivariate Analysis of NIR and HPLC
NIR spectrum was optimized by TQ 8.6 software, and the ranges 7455∼6852 cm−1 and 5973∼4007 cm−1 were selected according to the spectrum standard deviation. The higher the spectra standard deviation was, the greater the contribution to classification. The contents of chemical components data matrix and spectrum data matrix were integrated and analyzed by PLS-DA. PLS-DA was applied to obtain the first understanding of relationships between the data matrix, and to examine the differences in the spectrum of different geographical origins and species of Paris. The efficiency and reliability of the PLS-DA model were verified by percent variation of the x and y variables explained by the model (R2X, R2Y) and the predictive performance of the model (Q2) [26].
Results and Discussion
Validation of the NIR Spectroscopy and HPLC methods
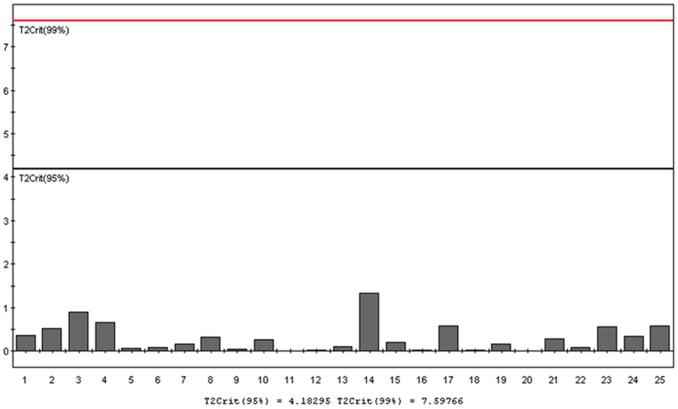
The precision of the NIR spectrometer was tested by assaying the same sample thirteen times continuously. The relative standard deviation (RSD) (n = 13) of precision for Paris powder was 0.184%. The repeatability of the NIR spectrometer was evaluated by assaying 13 replicate of the same sample. The RSD (n = 13) of repeatability for Paris powder was 0.232%. Within 3 h, the stability of sample was analyzed every 20 min. The RSD for stability was 0.297%. The spectral reproducibility is an essential factor in assessing the quality of the measurement technique. To gain insight into the reproducibility of system, 25 times parallel collections of sample 30 # were executed and evaluated by Hotelling T2 (Figure 3). The results showed that the parallel spectrum acquisitions possessed satisfactory stability with coefficient 4.18 and 7.58 in the 95% and 99% levels, respectively. The results indicated that NIR was a reliable method for discriminant analysis.
Figure 3. Stability control chart of NIRS of Paris.
The precision of HPLC was evaluated by analyzing the same sample extract six times continuously. The RSD (n = 6) of precision were 1.260%, 0.752% and 2.182% for polyphyllin I, polyphyllin II and polyphyllin VII, respectively. The repeatability of HPLC was tested by assaying 6 replicate of the same sample extract. The RSD (n = 6) of repeatability for Paris extract were 1.384%, 0.941% and 2.534% for polyphyllin I, polyphyllin II and polyphyllin VII, respectively. Stability of sample extract was tested every 4 h within 48 h, and the RSD were 1.346%, 1.225% and 2.734% for polyphyllin I, polyphyllin II and polyphyllin VII, respectively. The results indicated good performance of the method for HPLC assay.
Characterization of the Spectrum and Contents of Chemical Compositions
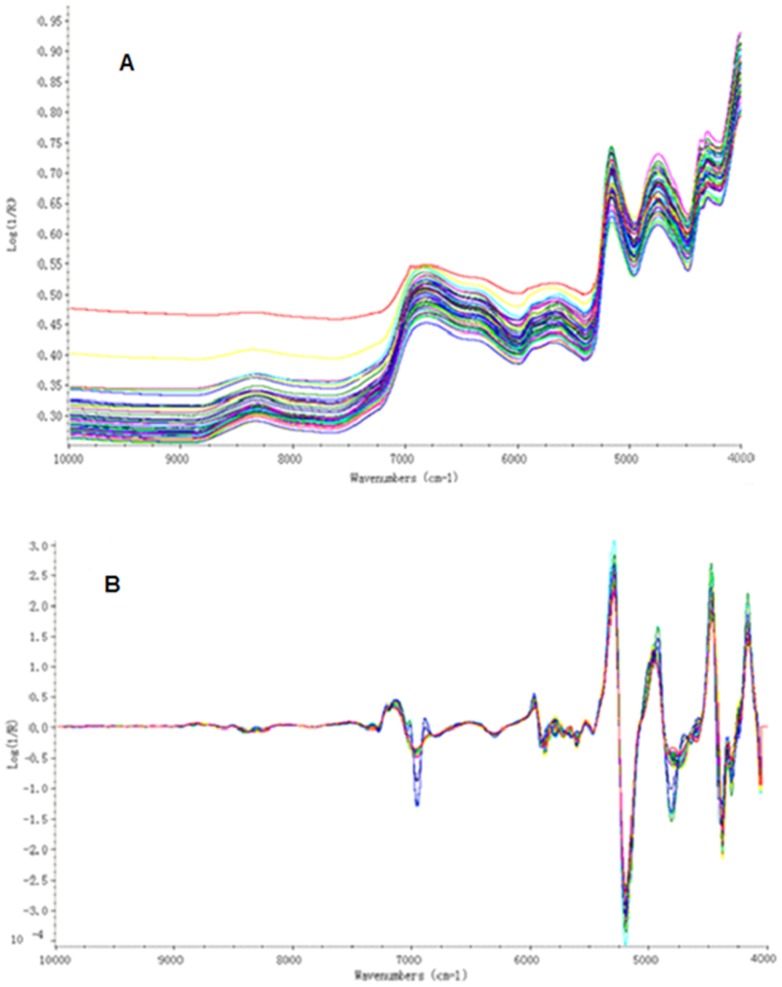
NIR spectrum and the chemical components contents of Paris were shown in Figure 4 and Table 2, respectively. Figure 4A showed the original spectra collected for the Paris samples, which illustrated the lowest molecular absorptivities were in the region 10000–7515 cm−1, with higher values in the region 7150–5436 cm−1 and still higher absorbance levels in the region 5326–4045 cm−1. The wavelength at 8380–8230 cm−1 corresponds to C–H second overtone stretch vibration modes in CH3 and CH2 groups, whereas the bands located between 6900 and 6800 cm−1 are the first overtone of O–H bands. In Figure 4B, the wavelengths at 7145 and 6953 cm−1 are related to C–H combination bands in CH2. The absorption band at 5181 cm−1 is assigned to polysaccharide combination band of O–H stretch vibration and the transformation of HOH. The wavelength at 4400 cm−1 is the combination band of O–H and C–O stretch vibration in glucose. In HPLC analysis, the retention time of polyphyllin I, polyphyllin II, polyphyllin VI and polyphyllin VII were at 34.828 min, 32.384 min, 23.048 min and 20.980 min, respectively. According to the results of HPLC, we found that polyphyllin VI only was detected in sample 17#. Based on this point, the compound polyphyllin VI was not used for discrimination analysis. Chemical components including polyphyllin I, polyphyllin II, polyphyllin VII, and total steroid saponins were employed in discrimination analysis, with “0” expressed the one could not be determined.
Figure 4. The original (A) and second derivative (B) NIR spectra of Paris.
Table 2. Contents of detected components in Paris (dry weight, mg·g−1).
| Sample number | polyphyllin I | polyphyllin II | polyphyllin VI | polyphyllin VII | Total steroid saponins |
| 1 | 8.61 | - | - | 0.49 | 9.11 |
| 2 | 11.53 | - | - | 0.14 | 11.67 |
| 3 | - | - | - | 0.15 | 0.15 |
| 4 | 21.56 | 5.06 | - | 0.56 | 27.18 |
| 5 | 3.32 | - | - | 1.63 | 4.95 |
| 6 | 4.45 | 1.23 | - | - | 5.67 |
| 7 | 12.57 | 0.90 | - | 0.15 | 13.63 |
| 8 | - | 2.66 | - | 0.43 | 3.09 |
| 9 | 10.03 | 1.34 | - | 0.43 | 11.81 |
| 10 | 15.76 | 2.55 | - | 0.16 | 18.47 |
| 11 | 8.41 | 0.91 | - | 1.28 | 10.60 |
| 12 | 9.67 | 1.69 | - | 0.83 | 12.19 |
| 13 | 27.04 | - | - | 4.32 | 31.36 |
| 14 | 11.00 | 1.67 | - | 0.25 | 12.91 |
| 15 | 12.09 | 1.24 | - | 0.33 | 13.66 |
| 16 | 31.03 | 1.91 | - | 0.40 | 33.34 |
| 17 | 3.34 | - | 2.97 | 0.15 | 6.55 |
| 18 | 2.90 | - | - | 0.43 | 3.33 |
| 19 | 9.24 | 1.49 | - | - | 10.73 |
| 20 | 5.00 | 1.65 | - | 0.57 | 7.22 |
| 21 | 6.92 | - | - | 0.68 | 7.60 |
| 22 | 12.41 | 1.59 | - | 0.15 | 14.15 |
| 23 | 13.04 | 4.69 | - | 0.69 | 18.80 |
| 24 | 16.37 | 2.27 | - | 0.17 | 18.80 |
| 25 | 2.91 | - | - | 0.25 | 3.16 |
| 26 | 13.44 | 3.41 | - | 0.51 | 17.36 |
| 27 | 19.80 | 2.04 | - | 0.24 | 22.07 |
| 28 | - | - | - | 0.16 | 0.16 |
| 29 | - | 3.75 | - | 0.42 | 4.18 |
| 30 | 18.35 | 1.90 | - | 0.42 | 20.66 |
| 31 | 14.52 | 1.47 | - | 0.25 | 16.24 |
| 32 | 3.81 | - | - | 0.62 | 4.43 |
| 33 | 3.43 | - | - | 1.54 | 4.97 |
| 34 | - | 2.59 | - | 0.30 | 2.89 |
| 35 | 11.63 | 3.24 | - | 0.87 | 15.74 |
| 36 | 4.99 | 1.74 | - | 0.17 | 6.90 |
| 37 | 11.04 | 2.93 | - | 0.74 | 14.71 |
| 38 | 9.85 | - | - | 0.43 | 10.28 |
| 39 | 4.39 | - | - | 0.54 | 4.93 |
| 40 | 15.60 | 4.37 | - | 0.25 | 20.22 |
| 41 | 10.57 | 3.85 | - | 0.15 | 14.56 |
| 42 | 15.02 | - | - | 0.21 | 15.23 |
| 43 | 12.93 | 1.30 | - | 0.52 | 14.75 |
| 44 | 3.63 | - | - | 0.54 | 4.18 |
| 45 | 9.15 | 5.53 | - | 0.40 | 15.08 |
| 46 | 20.16 | 3.16 | - | 0.15 | 23.46 |
| 47 | - | - | - | 0.25 | 0.25 |
| 48 | 16.57 | 1.75 | - | 0.32 | 18.64 |
Note: “-” means undetected.
Discriminant Analysis of Paris from Different Geographical Origins by NIR Spectrum and HPLC
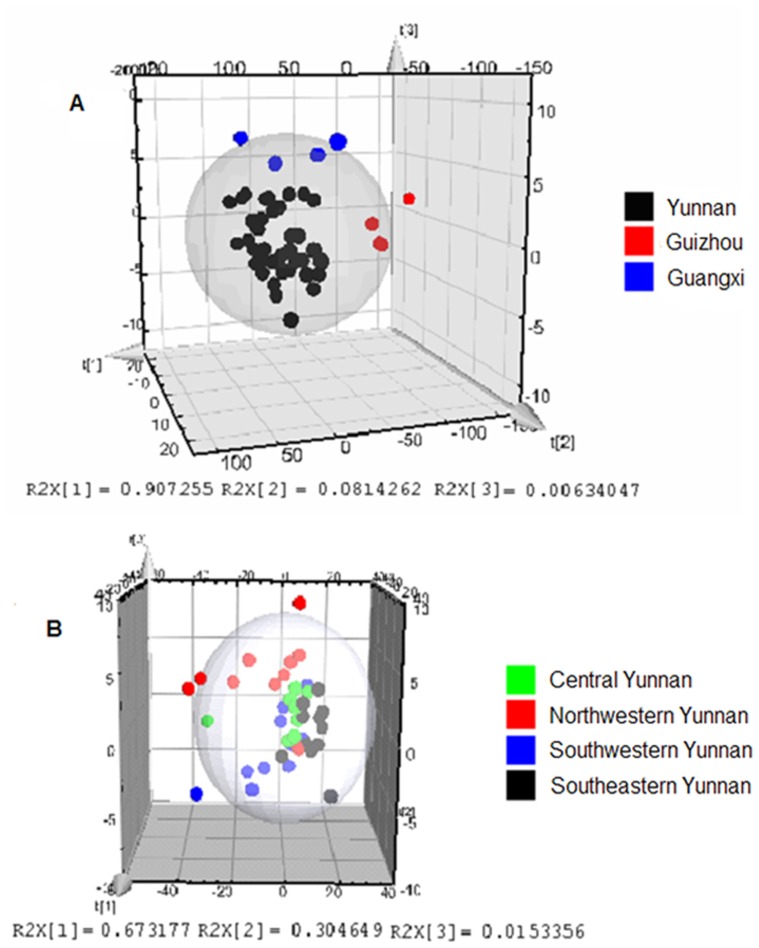
According to the diversity of NIR spectrum, stepwise discriminant analysis of PLS was utilized to analyze the samples from different geographical origins. In Figure 5A, forty eight collections of Paris samples were obviously separated into three groups according to the different geographical origins. The samples from Yunnan Province were clearly separated from the other two regions. The R2X and Q2Y described accumulative contribution rates were 99.50% and 94.03% of the total variance, respectively.
Figure 5. PLS model of Paris from Yunnan, Guizhou and Guangxi Provinces (A) and different geographical origins from Yunnan Provinces (B).
In further insight into samples from Yunnan Province for their multiple distribution areas, forty samples were separated into four groups. In Figure 5B, the R2X and Q2Y described accumulative contribution rates were 99.28% and 94.32% of the total variance, respectively. However, three samples 3#, 24# and 37# were classified incorrectly. The reason for that could not be found.
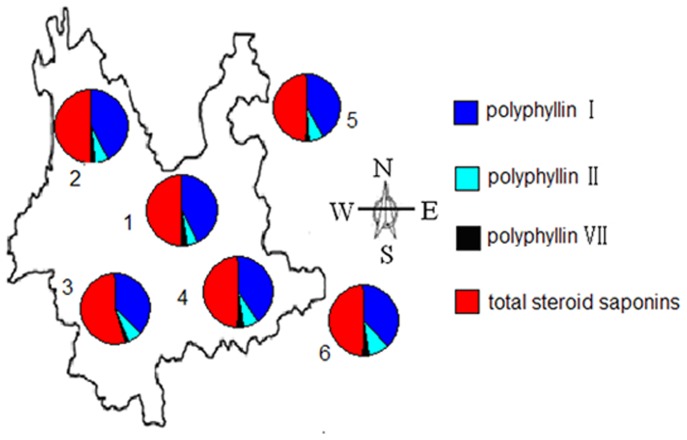
Furthermore, the average contents of chemical components (polyphyllin I, polyphyllin II, polyphyllin VII, and total steroid saponins) were used for the contribution of the geographical origins (Figure 6). More interestingly, the variation of chemical components coupling with the locations of wild Paris samples from Yunnan (Central, Northwestern, Southwestern and Southeastern), Guizhou and Guangxi Provinces in the pie charts showed the visualization of the major differences among the six geographical origins of samples. The samples from Southwestern Yunnan had the highest contents of polyphyllin I (11.147 mg·g−1) and total steroid saponins (13.363 mg·g−1), while samples collected from Guangxi Province and Southeastern Yunnan had the highest contents of polyphyllin II (2.110 mg·g−1) and polyphyllin VII (0.796 mg·g−1), respectively. The contents of polyphyllin I, polyphyllin II, polyphyllin VII, and total steroid saponins in samples from Guizhou Province were all the lowest. However, there was no significant difference among the contents of polyphyllin I, polyphyllin II, polyphyllin VII, and total steroid saponins in samples from Yunnan (Central, Northwestern, Southwestern and Southeastern), Guizhou and Guangxi Provinces (p>0.05).
Figure 6. The average contents of polyphyllin I, II, VII and total steroid saponins in Paris from different geographical regions: (1) Central Yunnan; (2) Northwestern Yunnan; (3) Southwestern Yunnan; (4) Southeastern Yunnan; (5) Guizhou; (6) Guangxi.
Based on the above analysis, samples from different geographical origins were different performance both in the NIR spectra and the chemical components, which might be effected by the main factors including geographical conditions, temperature, and rainfall capacity in different areas. Yunnan Province locates in southwest China and is influenced by a low latitude plateau, mountainous country monsoon climate [26]. Otherwise, Yunnan Province belongs to obvious characteristics of mountain climate with noticeable vertical climatic belt. Central and southeastern Yunnan are mainly the middle and north subtropical area, while northwest Yunnan belongs to the temperate zone, and southwestern Yunnan belongs to south subtropical [27]. In the recent years, the temperature of central, northwestern and southwestern Yunnan has increased remarkably, but the rainfall amount has decreased evidently [28]. Guizhou Province locates in northeast of Yunnan Province and is influenced by a subtropical plateau monsoon climate, the average temperature is not as stable as that of Yunnan. Guangxi Province locates in southeast of Yunnan Province and is influenced by a subtropical monsoon climate [26]. Su and Zhang [29] analyzed the relation between the photosynthesis of Paris polyphylla var. yunnanensis and the environmental factors and found that the leaf temperature increased from 11°C to 20°C, the net photosynthetic rate increased; but with the increase of temperature from 20°C to 35°C, the rate decreased. The optimal temperature was from 16°C to 28°C. With the increase of relative humidity from 20%–85%, the net photosynthetic rate increased. The optimal humidity was over 75% [29]. The results indicated the quality of Paris showed geographic and habitat dependencies to some extent.
Discriminant Analysis of Different Species by NIR Spectrum and HPLC
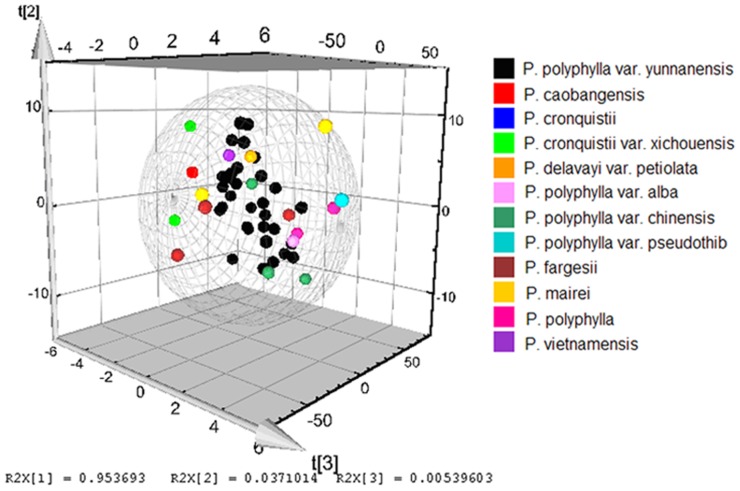
Utilized PLS-DA analysis to give us a preliminary overview of similarities and differences among the species, the results suggested that wild Paris species impose a significant effect on the NIR spectrum. In the established PLS-DA model (Figure 7), three significant spectra data described 99.62% of the variation in X (R2X = 0.9962) and predicted 95.23% in Y (Q2Y = 0.9523) according to cross-validation. Forty-eight collections including 12 species were partly separated into different groups, P. cronquisistii var. xichouensis, P. caobangensis, P. cronquistii, P. polyphylla var. alba and P. polyphylla var. pseudothib were obviously separated from the other species. Different species of Paris presented certain different information in the NIR spectra, which might be according to the different chemical components or chemical constituents in the samples for their different absorption band in NIR spectrum. Furthermore, we could find that different species of Paris contained different levels of chemical components from the Table 2. The results of analysis of variance showed the contents of total steroid saponins in different species of Paris were significantly different (p<0.05), while the levels of polyphyllin I, polyphyllin II, polyphyllin VII had no significant difference (p>0.05) among different species.
Figure 7. PLS model of different species of Paris.
Effects of Different Geographical Origins and Species for Classification
Based on above analysis, we knew that different geographical origins and species of wild Paris could be separated by PLS-DA model based on their NIR spectra and chemical components. Nevertheless, in order to understand either origin or species is the key factor to identify wild Paris, we have enthusiastically explored the same species from different geographical origins and different species from the same geographical origin.
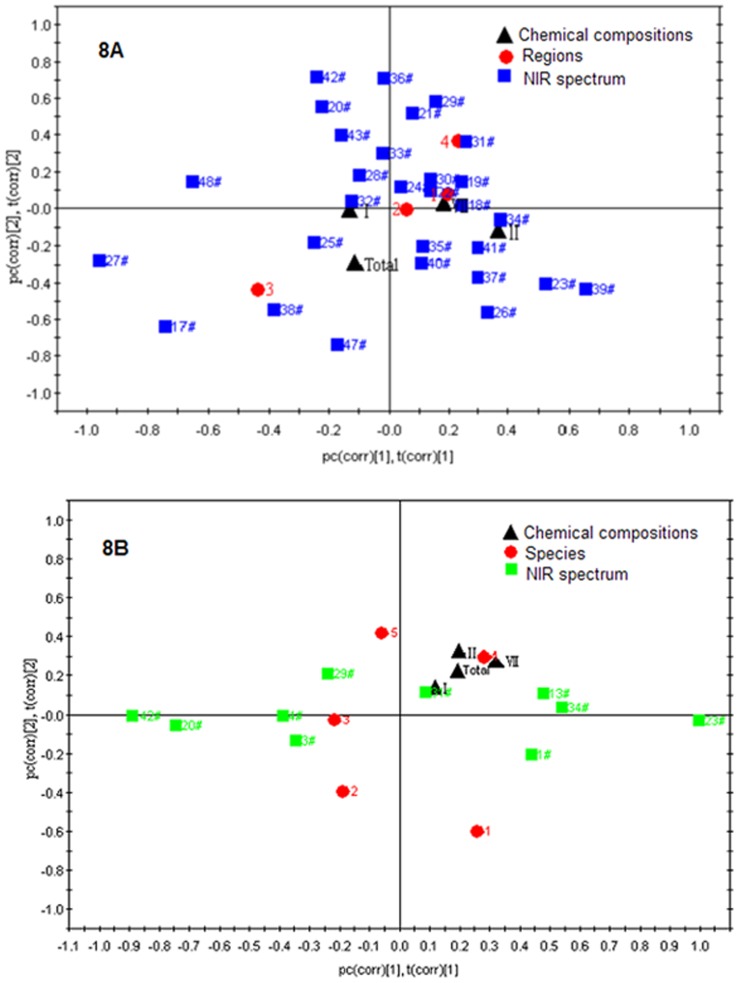
We selected 29 samples of P. polyphylla var. yunnanensis from four different geographical areas (central, northwestern, southwestern and southeastern) in Yunnan Province, and analyzed the effects of the geographical origins in discriminating Pairs by NIR spectra and chemical compositions. Loading Bi-plot of pc (corr) [1], t (corr) [1] and pc (corr) [2], t (corr) [2] generated from the loadings scaled as correlation and the scores scaled inside the correlation model of different geographical origins (Figure 8A) or different species (Figure 8B) of wild Paris.
Figure 8. Loading Bi-plot of PLS-DA model.
(A) P. polyphylla var. yunnanensis from different geographical origins. (1) Central Yunnan; (2) Northwestern Yunnan; (3) Southwestern Yunnan; (4) Southeastern Yunnan. (B) Different species of Paris from Southeastern Yunnan. (1) P. caobangensis; (2) P. cronquistii; (3) P. cronquistii var. xichouensis; (4) P. polyphylla var. chinensis; (5) P. polyphylla var. yunnanensis.
From Figure 8A, pc (corr) [1], t (corr) [1] played a significant role in discriminating samples of southwestern Yunnan from the others, while pc (corr) [2], t (corr) [2] had a comparatively weak impact on separating samples of northwestern Yunnan from central and southeastern Yunnan. More interesting, the locations of samples from southwestern and southeastern Yunnan were entirely opposite, while samples from central and northwestern Yunnan were located between them. The observations are in accordance with the climate of these areas as previously stated. Furthermore, the contribution of NIR spectrum and chemical compositions of samples was given a loading value. The NIR spectrum of samples 17#, 25#, 27#, 38#, 47# and chemical components polyphyllin I and total steroid saponins, had a negative contribution to pc (corr) [1], t (corr) [1], which separated samples of southwestern Yunnan from the others, with southwestern Yunnan having a negative loading value. The results could also be found in Table 3. Although samples 17# and 38# belong to northwestern Yunnan according to administrative division, they were close to southwestern Yunnan in geographically. The above showed samples 17#, 25#, 27#, 38#, 47#, chemical components polyphyllin I and total steroid saponins were the discriminating roles for P. polyphylla var. yunnanensis from southwestern Yunnan. It is consistent with the contents determined by HPLC that the levels of polyphyllin I and total steroid saponins were highest in southwestern Yunnan, 11.15 mg·g−1 and 13.36 mg·g−1, respectively.
Table 3. The total score of P. polyphylla var. yunnanensis from four different geographical areas (central, northwestern, southwestern and southeastern) in Yunnan Province.
| ID | t(corr)[1] | t(corr)[2] | Total score | ID | t(corr)[1] | t(corr)[2] | Total score |
| 47# | −0.171 | −0.744 | 19.358 | Total steroid saponins | −0.115 | −0.287 | 7.499 |
| 42# | −0.241 | 0.713 | 18.344 | 41# | 0.299 | −0.209 | 5.254 |
| 36# | −0.014 | 0.708 | 18.323 | 35# | 0.114 | −0.201 | 5.150 |
| 17# | −0.740 | −0.644 | 17.080 | 25# | −0.249 | −0.186 | 4.967 |
| 29# | 0.157 | 0.579 | 15.072 | 28# | −0.096 | 0.176 | 4.507 |
| 26# | 0.334 | −0.567 | 14.509 | 30# | 0.138 | 0.155 | 4.103 |
| 38# | −0.379 | −0.547 | 14.377 | 19# | 0.242 | 0.140 | 3.760 |
| 20# | −0.221 | 0.553 | 14.194 | 48# | −0.653 | 0.138 | 3.208 |
| 21# | 0.078 | 0.515 | 13.378 | 24# | 0.042 | 0.115 | 2.995 |
| 39# | 0.658 | −0.439 | 10.997 | polyphyllin II | 0.367 | −0.112 | 2.701 |
| 23# | 0.528 | −0.410 | 10.323 | 22# | 0.142 | 0.082 | 2.194 |
| 43# | −0.159 | 0.393 | 10.089 | 34# | 0.378 | −0.060 | 1.354 |
| 37# | 0.298 | −0.376 | 9.580 | polyphyllin VII | 0.184 | 0.029 | 0.849 |
| 31# | 0.262 | 0.358 | 9.411 | 32# | −0.124 | 0.033 | 0.789 |
| 27# | −0.958 | −0.284 | 7.882 | 18# | 0.247 | 0.016 | 0.544 |
| 40# | 0.108 | −0.299 | 7.674 | polyphyllin I | −0.130 | −0.009 | 0.295 |
| 33# | −0.019 | 0.294 | 7.594 |
Ten samples including 5 different species of Paris from southeastern Yunnan were selected to understand the difference among different species from the same geographical origins by PLS-DA model. In Figure 8B, pc (corr) [1], t (corr) [1] significantly discriminated P. caobangensis and P. polyphylla var. chinensis from P. cronquistii, P. cronquistii var. xichouensis and P. polyphylla var. yunnanensis, while pc (corr) [2], t (corr) [2] separated P. polyphylla var. chinensis and P. polyphylla var. yunnanensis from P. caobangensis, P. cronquistii, and P. cronquistii var. xichouensis. Five species were located in four different quadrants, while P. cronquistii var. xichouensis was close to P. cronquistii, which might be the reason that P. cronquistii var. xichouensis is the variety of P. cronquistii, the two species have much closer genetic relationship. The NIR spectrum of samples 13#, 31#, 34# and chemical components of polyphyllin I, polyphyllin II, polyphyllin VII and total steroid saponins had a positive contribution to pc (corr) [1], t (corr) [1] and pc (corr) [2], t (corr) [2], which separated P. polyphylla var. chinensis from the others. We could clearly understand the results from Table 4. From the NIR spectrum, we could find five species of Paris locate in the right corresponding quadrant except P. polyphylla var. yunnanensis. In the loading Bi-plot, the closer to the origin, the smaller contribution a chemical component makes to the discrimination. The contents of polyphyllin I and total steroid saponins in P. polyphylla var. chinensis were significantly higher than in other species, they could be considered as the discriminating components for P. polyphylla var. chinensis from the other species.
Table 4. The total score of 5 different species of Paris from southeastern Yunnan.
| ID | t(corr)[1] | t(corr)[2] | Total score |
| polyphyllin II | 0.200 | 0.331 | 12.154 |
| polyphyllin VII | 0.319 | 0.282 | 10.433 |
| Total steroid saponins | 0.192 | 0.223 | 8.226 |
| 29# | −0.237 | 0.209 | 7.501 |
| 1# | 0.442 | −0.208 | 7.363 |
| polyphyllin I | 0.121 | 0.141 | 5.203 |
| 3# | −0.341 | −0.137 | 5.148 |
| 31# | 0.089 | 0.110 | 4.048 |
| 13# | 0.481 | 0.104 | 4.039 |
| 20# | −0.744 | −0.056 | 2.424 |
| 34# | 0.541 | 0.032 | 1.429 |
| 23# | 0.999 | −0.032 | 0.667 |
| 42# | −0.879 | −0.006 | 0.663 |
| 4# | −0.386 | −0.008 | 0.470 |
From Table 3 and Table 4, we could calculate the average total score of different geographical origins (8.13) was much higher than different species (4.98) of Paris. The results suggested that different geographical origins had a much greater influence on Paris compared with different species. The complex geographical conditions, such as elevation, temperature, rainfall, sun exposure time, light quality and soil type are closely associated to different geographical origins environment.
Conclusions
In conclusion, the results demonstrated that the combination of NIR spectrum and HPLC- based active components with multivariate analysis could be a powerful method for discriminating Paris of different origins and different species. The PLS-DA model showed different origins had a greater effect on Paris than different species. The quality of Paris showed regional dependence. A further study using NIR and HPLC-based metabolic profiling coupled with multivariate analysis would extend the coverage of the metabolites of Paris and provide the authoritative biomarkers responsible for the discrimination of Paris from different geographical areas. On the other hand, the metabolic profiling of different species of Paris also needs further study for providing basis of extending source of medicine-botanical origins.
Acknowledgments
We would like to thank Dr. Jinyu Zhang at Institute of Medicinal Plants, Yunnan Academy of Agricultural Sciences for identifying the species of Paris.
Funding Statement
This work was supported by grants from National Natural Science Foundation of China (81260608 and 81260610), the Special Fund for Agro-Scientific Research in the Public Interest (201303117), the Yunnan Provincial Natural Science Foundation (2013FD066, 2013FZ150). The funders had no role in study design, data collection and analysis, decision to publish, or preparation of the manuscript.
References
- 1. Li XD, Chen HY, Jia W, Xie GX (2012) A metabolomics-based strategy for the quality control of traditional Chinese medicine: shengmai injection as a case study. Evid Based Complement Alternat Med 12: 1–8. [DOI] [PMC free article] [PubMed] [Google Scholar]
- 2. Yip PY, Chau CF, Mak CY, Kwan HS (2007) DNA methods for identification of Chinese medicinal materials. Chinese Med 9: 1–19. [DOI] [PMC free article] [PubMed] [Google Scholar]
- 3. Drăsar P, Moravcove J (2004) Recent advances in analysis of Chinese medical plants and traditional medicines. J? Chromatogr? B 812: 3–21. [DOI] [PubMed] [Google Scholar]
- 4. Elena C, Marisela T, Jianni X, Sucha S, Dale EJ (2010) Interactions between traditional Chinese medicines and Western therapeutics. Curr Opin Drug Discov Devel 13: 50–65. [PubMed] [Google Scholar]
- 5. Manukyan A (2011) Effect of growing factors on productivity and quality of lemon catmint, lemon balm and sage under soilless greenhouse production: I. drought stress. Med Aromatic Plant Sci Biotechnol 5: 119–125. [Google Scholar]
- 6. Xie CX, Suo FM, Jia GL, Song JY, Huang LF, et al. (2011) Correlation between ecological factors and ginsenosides. Acta Ecologica Sinica 31: 7551–7563. [Google Scholar]
- 7. Li H (1986) A study on the taxonomy of the genus Paris L. Bull Bot Res 6: 109–144. [Google Scholar]
- 8. Zhang JY, Wang YZ, Zhao YL, Yang SB, Zuo ZT, et al. (2011) Phytochemicals and bioactivities of Paris species. J? Asian Nat Prod Res 13: 670–681. [Google Scholar]
- 9. Zhao JL, Mou Y, Shan TJ, Li Y, Zhou LG, et al. (2010) Antimicrobial metabolites from the endophytic fungus Pichia guilliermondii isolated from Paris polyphylla var. yunnanensis . Molecules 15: 7961–7970. [DOI] [PMC free article] [PubMed] [Google Scholar]
- 10. Man SL, Gao WY, Zhang YJ, Jin XH, Ma CY, et al. (2009) Characterization of steroidal saponins in saponin extract from Paris polyphylla by liquid chromatography tandem multi-stage mass spectrometry. Anal Bioanal Chem 395: 495–505. [DOI] [PubMed] [Google Scholar]
- 11. Zhang JY, Shen T, Wang YZ, Zhang J, Shi YD, et al. (2012) Chemical assessment of wild Paris rhizome from Southwest China. Afr? J? Pharm Pharmaco 40: 2802–2870. [Google Scholar]
- 12. Lee MS, Chan YWJ, Kong SK, Yu B, Ooi ECV, et al. (2005) Effects of polyphyllin D, a steroidal saponin in Paris polyphylla, in growth inhibition of human breast cancer cells and in xenograft. Cancer Biol Ther 11: 1248–1254. [DOI] [PubMed] [Google Scholar]
- 13. Ong RCY, Lei J, Lee RKY, Cheung JYN, Fung KP, et al. (2008) Polyphyllin D induces mitochondrial fragmentation and acts directly on the mitochondria to induce apoptosis in drug-resistant HepG2 cells. Cancer Lett 261: 158–164. [DOI] [PubMed] [Google Scholar]
- 14. Siu FM, Ma DL, Cheung YW, Lok CN, Yan K, et al. (2008) Proteomic and transcriptomic study on the action of a cytotoxic saponin (polyphyllin D): induction of endoplasmic reticulum stress and mitochondria-mediated apoptotic pathways. Proteomics 15: 3105–3117. [DOI] [PubMed] [Google Scholar]
- 15. Xie L, Ying Y, Ying T (2007) Combination and comparison of chemometrics methods for identification of transgenic tomatoes using visible and near-infrared diffuse transmittance technique. J? Food Eng 82: 395–401. [Google Scholar]
- 16. Louw ED, Theron KI (2010) Robust prediction models for quality parameters in Japanese plums (Prunus salicina L.) using NIR spectroscopy. Postharvest Biol Tec 58: 176–184. [Google Scholar]
- 17. Huck CW, Guggenbichler W, Bonn GK (2005) Analysis of caffeine, theobromine and theophylline in coffee by near infrared spectroscopy (NIRS) compared to high-performance liquid chromatography (HPLC) coupled to mass spectrometry. Anal Chim Acta 538: 195–203. [Google Scholar]
- 18. Chen QS, Zhao JW, Chaitep SP, Guo ZM (2009) Simultaneous analysis of main catechins contents in green tea (Camellia sinensis (L.)) by Fourier transform near infrared reflectance (FT-NIR) spectroscopy. Food Chem 113: 1272–1277. [Google Scholar]
- 19. Yu HY, Niu XY, Lin HJ, Ying YB, Li BB, et al. (2009) A feasibility study on on-line determination of rice wine composition by Vis-NIR spectroscopy and least-squares support vector machines. Food Chem 113: 291–296. [Google Scholar]
- 20. Wu D, Chen JY, Lu BY, Xiong LN, He Y, et al. (2012) Application of near infrared spectroscopy for the rapid determination of antioxidant activity of bamboo leaf extract. Food Chem 135: 2147–2156. [DOI] [PubMed] [Google Scholar]
- 21. Otsuka M, Kato F, Matsuda Y (2001) Determination of indomethacin polymorphic contents by chemometric near-infrared spectroscopy and conventional powder X-ray diffractometry. Analyst 126: 1578–1582. [DOI] [PubMed] [Google Scholar]
- 22. Jiang Y, Li P, Li SP, Wang YT, Tu PF (2007) Optimization of pressurized liquid extraction of five major flavanoids from Lysimachia clethroide . J? Pharm Biomed Anal 43: 341–345. [DOI] [PubMed] [Google Scholar]
- 23. Qi LW, Yu QT, Li P, Li SL, Wang YX, et al. (2006) Quality evaluation of Radix Astragali through a simultaneous determination of six major active isoflavonoids and four main saponins by high-performance liquid chromatography coupled with diode array and evaporative light scattering detectors. J? Chromatogr? A 1134: 162–169. [DOI] [PubMed] [Google Scholar]
- 24. An HJ, Wang H, Lan YX, Hashi YK, Chen SZ (2013) Simultaneous qualitative and quantitative analysis of phenolic acids and flavonoids for the quality control of Apocynum venetum L. leaves by HPLC-DAD-ESI-IT-TOF-MS and HPLC-DAD. J? Pharm Biomed Anal 85: 295–304. [DOI] [PubMed] [Google Scholar]
- 25. Suberu J, Song LJ, Slade S, Sullivan N, Barker G, et al. (2013) A rapid method for the determination of artemisinin and its biosynthetic precursors in Artemisia annua L. crude extracts. J Pharm Biomed Anal 84: 269–277. [DOI] [PubMed] [Google Scholar]
- 26. Zhang L, Wang XY, Guo JZ, Xia QL, Zhao G, et al. (2013) Metabolic profiling of Chinese tobacco leaf of different geographical origins by GC-MS. J? Agric Food Chem 61: 2597–2605. [DOI] [PubMed] [Google Scholar]
- 27. Cheng JG, Wang XF, Fan LZ, Yang XP, Yang PW (2009) Variations of Yunnan climatic zone in recent 50 years. Prog Geog 28: 18–24. [Google Scholar]
- 28. Li M, Zhu Y, Huang W (2010) Influence of climate change on climate potential productivity in Yunnan. Chin? J? Agrometeorol 31: 442–446. [Google Scholar]
- 29. Su WH, Zhang GF (2003) Relation between the photosynthesis of Paris polyphylla var. yunnanensis and the environmental factors. J Yunnan Univ 25: 545–548. [Google Scholar]


