

Abstract
Low-frequency coding DNA sequence variants in the proprotein convertase subtilisin/kexin type 9 gene (PCSK9) lower plasma low-density lipoprotein cholesterol (LDL-C), protect against risk of coronary heart disease (CHD), and have prompted the development of a new class of therapeutics. It is uncertain whether the PCSK9 example represents a paradigm or an isolated exception. We used the “Exome Array” to genotype >200,000 low-frequency and rare coding sequence variants across the genome in 56,538 individuals (42,208 European ancestry [EA] and 14,330 African ancestry [AA]) and tested these variants for association with LDL-C, high-density lipoprotein cholesterol (HDL-C), and triglycerides. Although we did not identify new genes associated with LDL-C, we did identify four low-frequency (frequencies between 0.1% and 2%) variants (ANGPTL8 rs145464906 [c.361C>T; p.Gln121∗], PAFAH1B2 rs186808413 [c.482C>T; p.Ser161Leu], COL18A1 rs114139997 [c.331G>A; p.Gly111Arg], and PCSK7 rs142953140 [c.1511G>A; p.Arg504His]) with large effects on HDL-C and/or triglycerides. None of these four variants was associated with risk for CHD, suggesting that examples of low-frequency coding variants with robust effects on both lipids and CHD will be limited.
Introduction
Recently, a compelling new therapeutic target for lowering low-density lipoprotein cholesterol (LDL-C) emerged from human genetics: the proprotein convertase subtilisin/kexin type 9 gene (PCSK9 [MIM 607786]).1,2 PCSK9 protein-coding sequence variants that are low in frequency (defined here as allele frequencies from 0.1% to 5%) have been associated with lower plasma LDL-C3 and reduced risk for coronary heart disease (CHD).4 With the identification of low-frequency variants that protected against CHD, many pharmaceutical companies have established drug development programs targeting PCSK9. These observations have raised the question of whether the PCSK9 example is a paradigm for complex diseases like CHD or an exception.5
Low-frequency DNA sequence variants and rare alleles (defined here as <0.1% allele frequency) are poorly characterized by earlier generations of genome-wide association study (GWAS) genotyping arrays.6 Sequencing across the exome or genome can directly assay low-frequency and rare variants but such an approach is currently too costly to study tens of thousands of individuals. One proposed method for testing low-frequency and rare DNA variation is to first sequence the exome to discover variation and, subsequently, to genotype the discovered variants in a larger number of individuals from the same or similar populations to test for association with phenotype. Based on this principle, the Illumina HumanExome genotyping array (“the Exome Array” or “Exome Chip”) was designed based on coding sequence variants discovered from sequencing the exomes of ∼12,000 individuals.
Here, we set out to address two questions: (1) are there novel low-frequency nonsynonymous and splice site variants associated with lipid levels in the population? and (2) if so, will these coding sequence variants also associate with risk of clinical CHD? To address these questions, we first genotyped and analyzed the Exome Array in 42,208 European ancestry (EA) individuals and 14,330 African ancestry (AA) individuals from 13 cohorts with blood levels of fasting low-density lipoprotein cholesterol (LDL-C), high-density lipoprotein cholesterol (HDL-C), and fasting triglycerides (TG). We subsequently tested validated lipid variants for association with CHD. We discovered four variants associated with HDL-C and/or TG, but these variants did not associate with CHD.
Subjects and Methods
Estimation of Proportion of Variation Captured by Exome Array
We identified EA (n = 3,173) and AA (n = 2,408) participants from the Atherosclerosis Risk in Communities (ARIC) Study with available exome sequence who were not among the ∼12,000 individuals utilized to design the Exome Array. Separately by ancestry, we identified all variants with a minor allele frequency (MAF) >0.1% from exome sequencing of these independent ARIC individuals. These variants were compared with the variants available on the Illumina HumanExome v.1.0 array.
Study Participants
Thirteen studies genotyped the Exome Array on a total of 56,538 participants (Table S1 available online). 42,208 individuals were of European ancestry from ARIC, AGES, CHS, FHS, RS, MESA, WHI, CARDIA, Health ABC, FamHS, LBC1936, and Korcula. A total of 14,330 subjects were of African ancestry from ARIC, CHS, MESA, Health ABC, FamHS, JHS, WHI, and CARDIA. All participants provided informed consent and each study was approved by their governing ethics committee.
Genotyping and Quality Control
All study participants were genotyped on the HumanExome BeadChip v.1.0 (Illumina). ARIC, AGES, CHS, FHS, RS, MESA, CARDIA, Health ABC, FamHS, and JHS were jointly called7,8 at the University of Texas Health Science Center at Houston. LBC1936 and Korcula were called in GenomeStudio (Illumina) via the CHARGE Consortium joint calling cluster file. WHI used zCalls.9 Variant quality control (QC) was performed at the University of Texas Health Science Center and by the individual cohorts. QC involved checking concordance to GWAS data and excluding those individuals missing >5% genotypes, population clustering outliers, individuals with high inbreeding coefficients or heterozygote rates, individuals with gender mismatches, one individual from duplicate pairs, and individuals with an unexpectedly high proportion of identity-by-descent sharing, with consideration for family studies, based on high-quality variants. All contributing studies used an additive coding of variants to the minor allele observed in the jointly called data set.
Phenotypes
Association analyses were performed for three blood lipid traits in mg/dl: LDL-C, HDL-C, and TG. Fasting lipids values were used from the earliest available exam in each study. Studies with only nonfasting lipid levels contributed only to the HDL-C analysis. To account for lipid-lowering therapy in selected participants, we sought to estimate the untreated lipid value in each participant. Such an approach has been demonstrated to perform well in accounting for treatment effects in studies of quantitative traits.10 Statins are the most widely used treatment to lower plasma lipids and a statin at average dose reduces total cholesterol (TC) by 20% and LDL-C by 30%.11 Statins became routinely used after the publication of the seminal 4S randomized control trial in 1994.12
If the sample was collected after 1994, we accounted for lipid-lowering medication in the following manner: the treated TC value was divided by 0.8. No adjustment was done on data collected before 1994 unless specific information on statin use was available. LDL-C was calculated via the Friedewald equation13,14 (LDL-C = TC – HDL-C – (TG/5)) for those with TG <400 mg/dl. If TG >400 mg/dl, calculated LDL-C was set to missing. If TC was modified as described above for medication use, the modified total cholesterol was used to calculate LDL-C. If only measured LDL-C was available in a study, we accounted for lipid-lowering medication in the following manner: the treated LDL-C value was divided by 0.7. No adjustments for medication use were made for HDL-C and TG. TG was natural log transformed for analysis.
Statistical Analyses
Single-variant, conditional, and gene-based analyses were conducted with the seqMeta package in R. In brief, seqMeta implements efficient single-variant and gene-based meta-analysis. Each study computes association-specific statistics for each variant and trait assuming an additive model, and genotypic covariance matrices within predefined gene regions. Score statistics and genotypic covariance matrices are combined across studies to obtain an overall score statistic for each variant and a combined covariance matrix across studies. The combined score statistic is used for the single-variant results. For each gene, the score statistics for the variants within the gene along with the combined covariance matrix across those variants are used to construct the gene-based tests. An additive effect of each variant is assumed for individuals carrying more than one rare variant. All analyses were performed separately by race. We chose to meta-analyze EA and AA participants separately to minimize population biases and to increase the number of variants at specific MAF thresholds where there could be vastly different frequencies in the two ancestries.
Single-Variant Analysis
Though we defined low-frequency variants as having a MAF between 0.1% and 5%, we restricted single-variant tests to nonsynonymous and splice site variants with a MAF >0.02% in EA individuals (nvariants = 54,837) and >0.07% in AA individuals (nvariants = 90,218), corresponding to approximately 20 copies of the minor allele in each ancestry sample. Twenty copies of the minor allele provided stable estimates of the standard errors of the beta estimates and well-calibrated quantile-quantile plots.
Gene-Based Analysis
We constructed gene-based tests from the cohort-combined variant statistics and LD matrices. We only included nonsynonymous and splice site variants when producing the gene-based statistics. We performed three gene-based tests: (1) T1, where all variants with a MAF <1% were collapsed into gene-based score;15 (2) T0.1, where all variants with a MAF <0.1% were collapsed into gene-based score; and (3) sequence kernel association test (SKAT)16 at a MAF <5%. SKAT is more powerful than T1 when there are both protective and deleterious variants with different magnitudes in the same gene whereas T1 and T0.1 are more powerful when the magnitudes and directions of effect for the individual variants in a gene are consistent. We filtered gene-based results with a cumulative MAF <0.05% in the EA individuals and <0.14% in the AA individuals for SKAT analyses, corresponding to approximately 40 copies of the minor allele. For the T1 and T0.1 tests, we used a cumulative MAF >0.04% for the EA individuals and >0.11%, corresponding to 30 copies of the minor allele across all cohorts. Simulations under the null (i.e., no associations) were performed to determine the thresholds to control type I error for the burden tests (results not shown). The gene-based T1 and T0.1 analyses were limited to genes with at least two variants contributing to the test. For EA, T1 analysis included 12,351 genes with a cumulative MAF >0.04% and T0.1 with 8,357 genes; for AA participants, T1 analysis included 13,574 genes with a cumulative MAF >0.11% and T0.1 with 7,579 genes.
All analyses included age, age2, sex, and up to the first four principal components of ancestry as covariates. Cohort statistics were adjusted for related individuals, where appropriate. Beta coefficients were checked for consistency across the individual studies contributing to the meta-analysis. Hardy-Weinberg equilibrium p values were calculated and cluster plots from the joint calling were verified for the reported associations (Figure S1). Fasting glucose at baseline (between 1987 and 1989) in ARIC EA and exam 5 (between 1991 and 1995) in FHS was tested for association with rs145464906 in ANGPTL8 by linear regression adjusting for age, sex, and PCs.
Population Structure
Each study identified components to correct for population structure in their study and used these components as covariates in all association analyses.
Conditional Analysis
The allele dosages (0–2 copies) of the top previously identified GWAS variants in each region were used as additional covariates in the association model.
Statistical Significance
For single-variant association, we set the significance threshold to <3 × 10⁻⁸, corresponding to a Bonferroni correction for 1,485,864 tests (3 phenotypes × 247,644 variants on the array × 2 ancestries). For the gene-based association, we set the significance threshold to <2 × 10⁻⁷, corresponding to a Bonferroni correction for 316,332 tests (3 phenotypes × 17,574 genes on the array × 3 tests × 2 ancestries).
Annotation
We used dbNSFP v.2.0 to annotate the variants.17
Clinical CHD Association Analysis
Individuals from AGES, ARIC, CHS, FHS, MESA, Health ABC, RS1, WHI, MDC-CVA, IPM, ATVB/VHS, Ottawa, Procardis, Duke, and Penn contributed to the CHD analysis in EA. Individuals from ARIC, CHS, MESA, Health ABC, WHI, and IPM contributed to the CHD analysis in AA. All individuals were genotyped on the HumanExome BeadChip. Counts of number of CHD events in carriers and noncarriers of the four reported lipid variants were obtained from each available study. A Cochran-Mantel-Haenszel test was performed to associate the four reported lipid variants with CHD by using the R metafor package across the contributing studies.
Power Calculation
Power for the CHD association was calculated via the case-control for discrete traits option in the Genetic Power Calculator.
Mouse Studies Involving PCSK7
We created an adeno-associated virus 8 (AAV8) vector encoding the human PCSK7 coding region (cDNA) driven by the liver-specific thyroxine-binding globulin (TBG) promoter. An AAV8 vector lacking any transgene was used as a control. Separate groups of 10- to 12-week-old wild-type C57BL/6J male mice (six to seven per group) were injected via the peritoneal route with 1 × 10¹² vector genomes/mouse of the relevant vectors. Mice were fed a regular chow diet (Purina LabDiet 5010) throughout the study. Plasma samples after 4 hr of fasting were taken from the mice immediately prior to vector administration, as well as 7 and 14 days after AAV injection for analysis of lipids. Lipid measurements were performed on a Roche Cobas-Mira autoanalyzer (Roche Diagnostic Systems) with Wako Chemicals reagents. Mice were sacrificed at 14 days after AAV administration. All animal procedures were performed according to the regulations of, and with the prior approval of, the University of Pennsylvania Animal Care and Use Committee (IACUC). We repeated this experiment in a separate design comparing plasma lipids at baseline and 14 days after injection of an AAV8 vector encoding the mouse Pcsk7 cDNA versus control in wild-type C57BL/6J male mice (data not shown).
Results
Coverage of Exome Array
We evaluated the coverage of Exome Array in samples independent from those used to design the array. Based on exome sequences from 3,173 EA and 2,408 AA independent participants, we estimate that the Illumina Exome Array captures 78% of nonsynonymous coding and splice site variation with >1:1,000 allele frequency in EA individuals and 71% in AA individuals. Therefore, the array provides good coverage for low-frequency DNA variation and because of its low cost can be assayed in a large number of individuals.
Exome-sequencing variants not captured by the Exome Array may have been dropped during the design of the array. To address this possibility, we compared the variants discovered from exome sequencing to proposed content of the array (before variants failed design). We estimate that 95% of the variation in EA participants (and 85% of the variation in AA) with frequency >1:1,000 is captured by the proposed content of the array.
Study Participants and Genotypes
Clinical characteristics of the 56,538 analyzed study subjects are summarized in Table S1. Of the 247,644 variants that passed quality control criteria, 85% (n = 209,756) are polymorphic in the EA participants and 82% (n = 202,255) are polymorphic in the AA participants. Approximately 90% (n = 188,480) of the polymorphic variants are annotated17 as nonsynonymous (nonsense or missense) or splice variants in the EA participants, and 89% (n = 180,908) of the polymorphic variants are annotated as such in the AA participants (Table 1).
Table 1.
Number of Exome Array Variants Available for Analysis by Variant Type
| Variant Type | All Polymorphic Sites | MAF < 0.1% | MAF 0.1%–5% | MAF > 5% |
|---|---|---|---|---|
| 42,208 European Ancestry Samples | ||||
| Nonsynonymous | 175,444 | 130,553 | 32,501 | 12,390 |
| Nonsense/splice | 13,036 | 10,694 | 1,686 | 656 |
| Synonymous | 5,444 | 3,710 | 978 | 756 |
| Intronic/Intergenic | 14,205 | 139 | 1,186 | 12,880 |
| Other | 1,627 | 156 | 199 | 1,272 |
| 14,330 African Ancestry Samples | ||||
| Nonsynonymous | 169,140 | 91,083 | 61,809 | 16,248 |
| Nonsense/splice | 11,768 | 7,729 | 3,177 | 862 |
| Synonymous | 5,398 | 2,341 | 2,098 | 959 |
| Intronic/Intergenic | 14,169 | 56 | 650 | 13,463 |
| Other | 1,780 | 116 | 356 | 1,308 |
Variant type was determined based on dbNSFP v.2.0 annotations. Abbreviation is as follows: MAF, minor allele frequency. Other category includes variants labeled as downstream (n = 187), ncRNA_exonic (n = 111), ncRNA_intronic (n = 447), ncRNA_splicing (n = 1), ncRNA_UTR3 (n = 8), _UTR5 (n = 1), upstream (n = 181), upstream;downstream (n = 8), UTR3 (n = 518), UTR5 (n = 77).
Single-Variant Association
We tested each variant individually for association with blood lipid levels separately in each cohort and association summary statistics across cohorts were combined by fixed effects meta-analysis, separately within each ancestry group. There was no evidence of inflation in the association test statistics (Figure S2).
We replicated previously reported associations with common and low-frequency variants (Table 2) in both EA and AA participants. For example, we found that variants in PCSK9 (c.137G>T [p.Arg46Leu], [rs11591147] in EA and c.2037C>A [p.Cys679∗], [rs28362286] in AA) were associated with lower LDL-C (−17 mg/dl; p = 3 × 10−59 and −40 mg/dl; p = 2 × 10−57, respectively).
Table 2.
Top Association Results for Low-Frequency Variants Based on Level of Statistical Significance
| Gene | dbSNP ID | Mutation (Substitution) | Chr: Positiona | MAFb | Betac | p Value |
|---|---|---|---|---|---|---|
| HDL-C – EA (n = 42,208) | ||||||
| ANGPTL4 | rs116843064 | c.118G>A (p.Glu40Lys) | 19: 8,429,323 | 2.01% | 4 mg/dl | 1.7 × 10⁻²⁹ |
| LIPG | rs77960347 | c.1187A>G (p.Asn396Ser) | 18: 47,109,955 | 1.27% | 5 mg/dl | 5.1 × 10⁻²⁷ |
| LPL | rs268 | c.953A>G (p.Asn318Ser) | 8: 19,813,529 | 1.78% | −3 mg/dl | 2.4 × 10⁻¹⁹ |
| LDL-C – EA (n = 39,186) | ||||||
| PCSK9 | rs11591147 | c.137G>T (p.Arg46Leu) | 1: 55,505,647 | 1.54% | −17 mg/dl | 2.7 × 10−59 |
| APOB | rs5742904 | c.10580G>A (p.Arg3527Gln) | 2: 21,229,160 | 0.05% | 71 mg/dl | 5.6 × 10⁻³⁴ |
| CBLC | rs3208856 | c.1075C>T (p.His359Tyr) | 19: 45,296,806 | 3.43% | −8 mg/dl | 6.2 × 10⁻³⁰ |
| Triglycerides – EA (n = 39,859) | ||||||
| ANGPTL4 | rs116843064 | c.118G>A (p.Glu40Lys) | 19: 8,429,323 | 2.02% | −15% | 2.9 × 10−37 |
| LPL | rs268 | c.953A>G (p.Asn318Ser) | 8: 19,813,529 | 1.76% | 14% | 1.2 × 10⁻²² |
| MAP1A | rs55707100 | c.7046C>T (p.Pro2349Leu) | 15: 43,820,717 | 3.25% | 9% | 1.4 × 10⁻¹⁷ |
| HDL-C – AA (n = 14,330) | ||||||
| PCSK7 | rs142953140 | c.1511G>A (p.Arg504His) | 11: 117,089,205 | 0.2% | 17 mg/dl | 3.4 × 10⁻²⁰ |
| CETP | rs34119551 | c.17T>A (p.Val6Asp) | 16: 56,995,908 | 0.24% | 16 mg/dl | 2.0 × 10⁻¹⁹ |
| LCAT | rs35673026 | c.340G>A (p.Val114Met) | 16: 67,976,851 | 0.34% | 10 mg/dl | 2.0 × 10⁻¹⁰ |
| LDL-C – AA (n = 14,227) | ||||||
| PCSK9 | rs28362286 | c.2037C>A (p.Cys679∗) | 1: 55,529,215 | 0.87% | −40 mg/dl | 1.5 × 10−57 |
| PCSK9 | rs67608943 | c.426C>G (p.Tyr142∗) | 1: 55,512,222 | 0.30% | −35 mg/dl | 2.6 × 10⁻¹⁶ |
| APOE | rs769455 | c.487C>T (p.Arg163Cys) | 19: 45,412,040 | 1.93% | −12 mg/dl | 3.6 × 10⁻¹² |
| Triglycerides – AA (n = 14,351) | ||||||
| APOE | rs769455 | c.487C>T (p.Arg163Cys) | 19: 45,412,040 | 1.93% | 21% | 2.3 × 10⁻¹⁸ |
| COL18A1 | rs114139997 | c.331G>A (p.Gly111Arg) | 21: 46,875,775 | 1.93% | −16% | 1.6 × 10⁻¹¹ |
| ZNF259 | rs35120633 | c.791C>T (p.Ala264Val) | 11: 116,655,600 | 2.96% | 13% | 2.7 × 10⁻¹² |
Results are based on 42,208 European ancestry (EA) individuals and 14,330 African ancestry (AA) individuals.
Chr: Position is reported in UCSC Genome Browser build hg19.
MAF, minor allele frequency.
Beta is based on the geometric mean for triglycerides.
We discovered four associations of low-frequency variants with either HDL-C and/or TG that met our a priori significance threshold of p < 3 × 10⁻⁸ and not previously reported in the literature. Two signals emerged from EA participants and two from AA participants (Table 3). In contrast to HDL-C and TG, we did not discover any new genes where low-frequency or rare DNA sequence variants significantly associated with LDL-C. Below, we describe each of the four new associations.
Table 3.
Variant Associations with Blood Lipids that Have Not Been Previously Reported
| Trait | Gene | rsID | Mutation (Substitution) | Betaa | p Value | Conditional Variants | pconditional | EA MAF | AA MAF |
|---|---|---|---|---|---|---|---|---|---|
| Ancestry: EA | |||||||||
| HDL-C | ANGPTL8 | rs145464906 | c.361C>T (p.Gln121∗) | 10 mg/dl | 5.1 × 10⁻¹¹ | rs737337 | 5.5 × 10⁻¹³ | 0.1% | 0.01% |
| HDL-C | PAFAH1B2 | rs186808413 | c.482C>T (p.Ser161Leu) | 3 mg/dl | 2.2 × 10⁻¹⁰ | rs964184, rs3135506, rs2266788, rs76353203, rs14721066, rs140621530 | 2.1 × 10⁻¹¹ | 1.1% | 0.2% |
| Ancestry: AA | |||||||||
| TG | COL18A1 | rs114139997 | c.331G>A (p.Gly111Arg) | −16% | 1.6 × 10⁻¹⁶ | – | – | 0.003% | 1.9% |
| HDL-C | PCSK7 | rs142953140 | c.1511G>A (p.Arg504His) | 17 mg/dl | 4.9 × 10⁻²⁰ | rs964184, rs3135506, rs2266788, rs76353203, rs14721066, rs140621530 | 3.4 × 10⁻²⁰ | 0% | 0.2% |
Results are based on 42,208 European ancestry (EA) individuals and 14,330 African ancestry (AA) individuals. Abbreviations are as follows: TG, triglycerides; HDL-C, high-density lipoprotein cholesterol; MAF, minor allele frequency.
Effect estimate for triglycerides is based on the geometric mean.
First, in EA participants, we found an association of blood HDL-C with a 0.1% premature stop codon at the chromosome 19 open reading frame 80 gene (C19orf80, aliases include ANGPTL8, lipasin, and betatrophin; c.361C>T [p.Gln121∗]; rs145464906). Carriers of ANGPTL8 rs145464906 had 10 mg/dl higher HDL-C (p = 5 × 10⁻¹¹), lower TG (−15%; p = 0.003), and nonsignificantly lower LDL-C (−5.8 mg/dl; p = 0.13) than did noncarriers of this variant (Table 4). ANGPTL8 rs145464906 is seen at a 0.01% frequency in AA participants and we were not able to reliably estimate its effect on lipid measures in this group.
Table 4.
Association Results in Other Lipid Traits for the Reported Associations
| Gene | rsID | Trait | EA Beta | EA p Value | AA Beta | AA p Value |
|---|---|---|---|---|---|---|
| ANGPTL8 | rs145464906 | HDL-C | 10 mg/dl | 5.1 × 10⁻¹¹ | – | – |
| TG | −15% | 0.003 | – | – | ||
| LDL-C | −5.8 mg/dl | 0.13 | – | – | ||
| PAFAH1B2 | rs186808413 | HDL-C | 3 mg/dl | 2.2 × 10⁻¹⁰ | 1 mg/dl | 0.58 |
| TG | −10% | 2.3 × 10−09 | −4% | 0.48 | ||
| LDL-C | −3 mg/dl | 0.01 | −2.6 md/dl | 0.58 | ||
| COL18A1 | rs114139997 | HDL-C | – | – | 2.2 mg/dl | 4.1 × 10⁻⁴ |
| TG | – | – | −16% | 1.6 × 10⁻¹⁶ | ||
| LDL-C | – | – | −2.6 mg/dl | 0.12 | ||
| PCSK7 | rs142953140 | HDL-C | – | – | 17 mg/dl | 4.9 × 10⁻²⁰ |
| TG | – | – | −30% | 1.5 × 10−09 | ||
| LDL-C | – | – | −11.5 mg/dl | 0.02 |
Abbreviations are as follows: TG, triglycerides; HDL-C, high-density lipoprotein cholesterol; LDL-C, low-density lipoprotein cholesterol; EA, European ancestry; AA, African ancestry; Beta, effect size.
ANGPTL8 rs145464906 is located in a genomic region previously associated with lipid levels in GWASs (rs737337 at the DOCK6 [MIM 614194] locus; c.2136A>G [p.(=)]).18 An analysis conditioning on rs737337 in DOCK6 revealed rs145464906 to be an independent association (pconditional = 5.5 × 10⁻¹³). Another more common coding variant in ANGPTL8 (8% frequency; rs2278426; c.175C>T [p.Arg59Trp]) has been associated with low LDL-C and low HDL-C.19 This variant is not present on the exome array, but the correlation between rs2278426 and rs145464906 is low at 0.08 and conditional analyses confirm that rs2278426 and rs145464906 are independent association signals (data not shown).
Angplt8-null mice display lower blood TG and functional studies have suggested that ANGPTL8 may activate ANGPTL3 and thereby regulate lipoprotein metabolism.19,20 Of note, based on studies in mice, another proposed role for ANGPTL8 is as a hormone that promotes pancreatic β cell proliferation, expands β cell mass, and improves glucose tolerance.21 These studies raise the hypothesis that loss of ANGPTL8 function might worsen measures of glucose tolerance. We studied the association of ANGPTL8 rs145464906 with fasting plasma glucose levels among 10,642 EA participants in the ARIC study and 3,112 EA participants from FHS and observed no evidence for association in either study. In ARIC, plasma glucose did not differ between the carriers of the rs145464906 allele (n = 23) and noncarriers (n = 10,620) (beta = −3.3 mg/dl; SE = 5.8 mg/dl; p = 0.57). In FHS, carriers of rs145464906 (n = 13) had a mean fasting glucose of 88.2 mg/dl whereas noncarriers had mean glucose of 99.9 mg/dl (p = 0.13).
A second discovery among EA participants is a significant association between a 1% frequency variant in the Platelet-Activating Factor Acetylhydrolase 1b, Catalytic Subunit 2 gene (PAFAH1B2 [MIM 602508]; c.482C>T [p.Ser161Leu]; rs186808413) and HDL-C. Carriers of rs186808413 had 3 mg/dl higher HDL-C (p = 2.2 × 10⁻¹⁰), lower TG (−10%; p = 2.3 × 10⁻⁹), and marginally lower LDL-C (−3 mg/dl; p = 0.01) than did noncarriers (Table 4). In AA participants, the direction of association between HDL-C and PAFAH1B2 rs186808413 (0.2% frequency in AA participants) was consistent with the EA results, but not significant (1 mg/dl; p = 0.58). PAFAH1B2 is located near the chromosome 11 gene cluster involving APOA1/C3/A4/A5, a region where several genes regulate TG. Conditional analysis adjusting for six previously studied variants in this region (rs964184, rs3135506, rs2266788, rs76353203, rs147210663, rs140621530) showed PAFAH1B2 rs186808413 to be an independent association signal (pconditional = 2.1 × 10⁻¹¹). Platelet-activating factor (PAF) is a lipid messenger functioning in many cellular processes.22 Plasma platelet-activating factor-acetyl hydrolase (PAF-AH) belongs to a subfamily of phospholipases A2 that remove the sn-2 acetyl group and inactivate a number of oxidized lipids,23,24 but intracellular type I (PAF-AH-Ib) is structurally distinct and may form a part of a signal transduction pathway.22
Third, among AA participants, we found an association of blood TG with a 2% frequency variant in the Collagen, Type XVIII, Alpha 1 gene (COL18A1 [MIM 120328]; c.331G>A [p.Gly111Arg]; rs114139997), where carriers of rs114139997 had 16% lower TG than did noncarriers (p = 2 × 10⁻¹⁶). COL18A1 rs114139997 was also marginally associated with higher HDL-C (2 mg/dl; p = 4 × 10⁻⁴) (Table 4). The frequency of COL18A1 rs114139997 is 0.003% in EA participants and we were not able to reliably estimate the effect on lipid measures in this group. COL18A1 is a basement membrane proteoglycan with a recently established role in presenting the enzyme lipoprotein lipase to the luminal side of the vascular endothelium.25 Mice deleted for Col18a1 (Col18a1−/−) were shown to have hypertriglyceridemia resulting from decreased lipoprotein lipase activity, and humans with homozygous deficiency of COL18A1 (Knobloch syndrome [MIM 267750]) have been observed to have higher blood TG than do normal individuals.25
Finally, in AA participants, we also identified an association of blood HDL-C with a 0.2% frequency variant at the proprotein convertase subtilisin/kexin type 7 serine protease gene (PCSK7 [MIM 604874]; c.1511G>A [p.Arg504His]; rs142953140). Carriers of the PCSK7 rs142953140 mutation had 17 mg/dl higher HDL-C levels than did noncarriers (p = 5 × 10⁻²⁰). PCSK7 rs142953140 was also associated with lower TG (−30%; p = 2 × 10⁻⁹) and nominally associated with lower LDL-C (−11.5 mg/dl; p = 0.02) among the AA participants (Table 4). PCSK7 is located near the chromosome 11 gene cluster involving APOA1/C3/A4/A5, a region where several genes regulate HDL-C and TG. Conditional analysis adjusting for six known variants in this region (rs964184, rs3135506, rs2266788, rs76353203, rs147210663, rs140621530) showed PCSK7 rs142953140 to be an independent association signal (pconditional = 3.4 × 10⁻²⁰). PCSK7 rs142953140 was not polymorphic in individuals of European ancestry. PCSK7 belongs to the same family of serine proteases as does PCSK9, and a putative link between PCSK7 and lipoprotein metabolism was recently established in vitro.26,27 In cultured cells, PCSK7 cleaved angiopoietin-like protein 4 (ANGPTL4) and activated its ability to inhibit lipoprotein lipase.
We studied the functional consequence of overexpression of human PCSK7 in mice and found that mice overexpressing PCSK7 in liver have lower HDL-C and higher TG compared to controls (Figure 1), suggesting that gain of PCSK7 function decreases HDL-C and increases TG in vivo. Further studies are warranted to determine whether reduction of hepatic PCSK7, for example through Pcsk7 knockdown in mice, will result in the same lipid profile as that of human subjects with the PCSK7 rs142953140 mutation.
Figure 1.
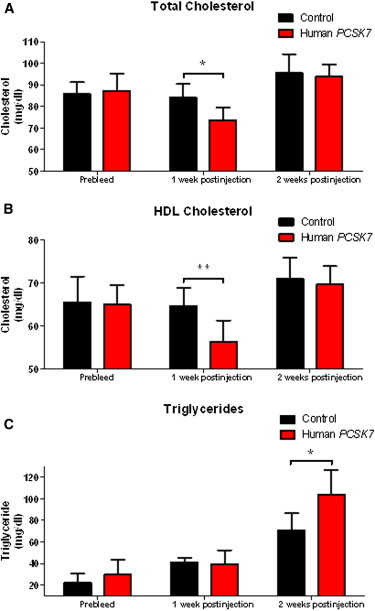
Effects of Human PCSK7 Overexpression in Mouse Liver on Plasma Lipids
Plasma TC (A), HDL-C (B), and TG (C) were measured at baseline and at 7 and 14 days after injection of the human PCSK7 or control AAV8 vectors in C57BL/6J male mice. Error bars show standard deviations. ∗p < 0.05 and ∗∗p < 0.01, Student’s unpaired t test.
Gene-Based Association
In contrast to low-frequency variants, the alternative alleles at rare variants occur too infrequently to be analyzed individually and must be evaluated by aggregating into sets. Here, typically, the unit of analysis is a gene. We used two methods to perform gene-based analyses incorporating variants annotated as nonsynonymous or splice site: the sum of the number of minor alleles15 including variants with a MAF <1% or MAF <0.1% and the sequence kernel association test (SKAT),16 a test that considers effect sizes in both directions, including variants with a MAF <5%. Gene-based association results were well calibrated (Figure S3). We were able to replicate genes previously reported to be associated with blood lipid levels (Table 5). For example, multiple rare alleles at LDLR (MIM 606945) were strongly associated with blood LDL-C (p = 5 × 10⁻¹⁰). No new genetic associations were identified through the gene-based analyses.
Table 5.
Top Gene-Based Association Results Based on Level of Statistical Significance
| Gene | p Value | Best Test | Betaa | SE | CMAFb | No. Variantsc |
|---|---|---|---|---|---|---|
| LDL-EA | ||||||
| PCSK9 | 1.81 × 10−62 | SKAT | – | – | 0.0626 | 22 |
| LDLR | 4.9 × 10⁻¹⁰ | T1 | 15.36 | 2.47 | 0.0027 | 28 |
| HDL-EA | ||||||
| APOC3 | 3.2 × 10⁻¹⁹ | T1 | 11.75 | 1.31 | 0.0035 | 4 |
| ANGPTL4 | 5.41 × 10⁻³⁰ | SKAT | – | – | 0.0283 | 11 |
| LIPG | 2.55 × 10⁻²⁹ | SKAT | – | – | 0.0162 | 12 |
| LPL | 5.76 × 10⁻²⁹ | SKAT | – | – | 0.0372 | 10 |
| Triglycerides-EA | ||||||
| APOC3 | 4.0 × 10⁻²⁹ | T1 | −0.41 | 0.05 | 0.0036 | 4 |
| ANGPTL4 | 2.70 × 10−37 | SKAT | – | – | 0.0286 | 11 |
| LPL | 1.56 × 10⁻³¹ | SKAT | – | – | 0.037 | 10 |
| LDL-AA | ||||||
| PCSK9 | 1.40 × 10−71 | SKAT | – | – | 0.1295 | 25 |
| APOE | 2.65 × 10⁻¹² | SKAT | – | – | 0.0205 | 3 |
| HDL-AA | ||||||
| APOC3 | 9.5 × 10⁻¹² | T1 | 10.14 | 1.49 | 0.0055 | 4 |
| CETP | 7.7 × 10−09 | T1 | 6.18 | 1.07 | 0.0065 | 7 |
| Triglycerides-AA | ||||||
| APOC3 | 2.9 × 10⁻¹⁹ | T1 | −0.34 | 0.05 | 0.0055 | 4 |
| APOE | 2.26 × 10⁻¹⁸ | SKAT | – | – | 0.0205 | 3 |
Abbreviations are as follows: TG, triglycerides; HDL-C, high-density lipoprotein cholesterol; LDL-C, low-density lipoprotein cholesterol; EA, European ancestry; AA, African ancestry; Beta, effect size; SE, standard error.
Beta is in mg/dl units for LDL and HDL and in percent change for triglycerides.
CMAF, cumulative minor allele frequency of the variants contributing to the test.
No. variants, number of variants contributing to the test.
Association with CHD
To assess whether the four newly associated low-frequency coding variants also relate to clinical cardiovascular disease, we tested association of each variant with CHD in 63,470 individuals from 15 EA studies and 13,772 individuals from 7 AA studies (Table S2). Of these participants, 14,201 EA and 2,380 AA individuals were affected with CHD.
As a positive control, we confirmed that the PCSK9 c.137T (c.137G>T [p.Arg46Leu]; rs11591147) allele leading to lower LDL-C was associated with reduced risk for CHD among EA participants (OR = 0.84, 95% CI = 0.74–0.95, p = 0.007) and PCSK9 c.2037A (c.2037C>A [p.Cys679∗]; rs28362286) allele leading to lower LDL-C was similarly associated with reduced risk for CHD among AA participants (OR = 0.40, 95% CI = 0.23–0.68, p = 5.4 × 10⁻⁴).
In contrast to the PCSK9 variants, none of the four coding sequence variants at ANGPTL8, PAFAH1B2, COL18A1, or PCSK7 were associated with risk for CHD (Table 6).
Table 6.
Association of Lipid Variants with Coronary Heart Disease
| Gene | Mutation (Substitution) | rsID | Case Frequency | Control Frequency | Odds Ratio | p Value |
|---|---|---|---|---|---|---|
| Ancestry: EA | ||||||
| ANGPTL8 | c.361C>T (p.Gln121∗l) | rs145464906 | 0.29% | 0.27% | 1.023 | 0.985 |
| PAFAH1B2 | c.482C>T (p.Ser161Leu) | rs186808413 | 2.05% | 2.23% | 0.905 | 0.170 |
| Ancestry: AA | ||||||
| PCSK7 | c.1511G>A (p.Arg504His) | rs142953140 | 0.53% | 0.47% | 1.258 | 0.592 |
| COL18A1 | c.331G>A (p.Gly111Arg) | rs114139997 | 3.39% | 3.38% | 0.996 | 0.971 |
Association with CHD was performed in a total of 63,470 EA individuals and 13,772 AA individuals. 14,201 EA and 2,380 AA individuals developed CHD.
Discussion
The contribution of low-frequency DNA sequence variation to complex phenotypes such as blood lipids and CHD has been the subject of much debate. Some have argued that low-frequency variants with large effects may be instrumental in discovering genes and that such discoveries can lead to novel therapeutic targets. By using the Exome Array in >42,000 EA individuals and >14,000 AA individuals, we discovered four low-frequency variants with large effects on lipids, but none of these variants associated with risk for CHD.
Several limitations of our study deserve mention. We were not able to evaluate extremely rare variants that may be unique to individuals; exome or whole-genome sequencing is needed to capture this type of variation. As such, it remains possible that a burden of such very rare mutations could contribute to plasma lipid variation. If so, the sample sizes required to yield new rare variant discoveries are likely to be extraordinarily large.
The Exome Array is constrained to the coding and splice site variation observed in the ∼12,000 individuals who comprised the initial exome sequencing discovery set. Furthermore, ∼20% of the content contributed for design failed to be converted into genotyping assays and thus these variants are not present on the Exome Array.
The lack of significant association of our reported low-frequency variants with CHD may be due to insufficient statistical power. For the CHD association testing among EA participants, we had >80% power at α = 0.05 to detect an odds ratio outside the range (0.86, 1.14) with a 2% frequency variant, and an odds ratio outside the range (0.74, 1.29) with a 0.5% frequency variant. Among AA participants, we had >80% power at α = 0.05 to detect an odds ratio outside the range (0.69, 1.35) with a 2% frequency variant, and an odds ratio outside the range (0.43, 1.73) with a 0.5% frequency variant.
Of note, all four of our reported loci were associated with HDL-C, which may not be a causal risk factor for clinical CHD, and this observation could explain the lack of association with CHD.28 Finally, we do not yet fully understand the biologic mechanism by which the genes reported here affect blood lipoproteins.
In summary, by using the Exome Array, we identified four low-frequency coding variants in ANGPTL8, PAFAH1B2, COL18A1, and PCSK7 that altered plasma HDL-C and/or TG but did not affect risk for CHD. These results suggest that the example of PCSK9 with low-frequency alleles that affect both plasma lipids and CHD is likely to be an exception rather than a paradigm.
Acknowledgments
The authors wish to acknowledge the support of the National Heart, Lung, and Blood Institute (NHLBI) and the contributions of the research institutions, study investigators, field staff, and study participants in creating this resource for biomedical research. Funding for GO ESP was provided by NHLBI grants RC2 HL-103010 (HeartGO), RC2 HL-102923 (LungGO), and RC2 HL-102924 (WHISP). The exome sequencing was performed through NHLBI grants RC2 HL-102925 (BroadGO) and RC2 HL-102926 (SeattleGO). Infrastructure for the CHARGE Consortium is supported, in part, by the National Heart, Lung, and Blood Institute (grant HL105756). G.M.P. is supported by award number T32HL007208 from the NHLBI. S.K. is supported by a Research Scholar award from the Massachusetts General Hospital (MGH), the Howard Goodman Fellowship from MGH, the Donovan Family Foundation, R01HL107816, and a grant from Fondation Leducq. Exome Array genotyping in case-control studies of coronary heart disease was supported by NIH RC2 HL-102925 and an investigator-initiated research grant from Merck to S.K. N.O.S. is supported, in part, by a career development award from the NIH/NHLBI K08-HL114642. A.D. is supported by NWO grant (veni, 916.12.154) and the EUR Fellowship. The content is solely the responsibility of the authors and does not necessarily represent the official views of the NHLBI or NIH. A full listing of acknowledgements is provided in Supplemental Data.
Contributor Information
Sekar Kathiresan, Email: skathiresan@partners.org.
L. Adrienne Cupples, Email: adrienne@bu.edu.
Supplemental Data
Web Resources
The URLs for data presented herein are as follows:
dbNSFP v.2.0, https://sites.google.com/site/jpopgen/dbNSFP
Exome Array site information, ftp://share.sph.umich.edu/exomeChip/
Exome Chip Design, http://genome.sph.umich.edu/wiki/Exome_Chip_Design
ExomeChip – Charge Consortium, http://www.chargeconsortium.com/main/exomechip
Genetic Power Calculator, http://pngu.mgh.harvard.edu/∼purcell/gpc/
Online Mendelian Inheritance in Man (OMIM), http://www.omim.org/
R metafor package, http://cran.r-project.org/web/packages/metafor/index.html
UCSC Genome Browser, http://genome.ucsc.edu
References
- 1.Stein E.A., Mellis S., Yancopoulos G.D., Stahl N., Logan D., Smith W.B., Lisbon E., Gutierrez M., Webb C., Wu R. Effect of a monoclonal antibody to PCSK9 on LDL cholesterol. N. Engl. J. Med. 2012;366:1108–1118. doi: 10.1056/NEJMoa1105803. [DOI] [PubMed] [Google Scholar]
- 2.Abifadel M., Varret M., Rabès J.P., Allard D., Ouguerram K., Devillers M., Cruaud C., Benjannet S., Wickham L., Erlich D. Mutations in PCSK9 cause autosomal dominant hypercholesterolemia. Nat. Genet. 2003;34:154–156. doi: 10.1038/ng1161. [DOI] [PubMed] [Google Scholar]
- 3.Cohen J., Pertsemlidis A., Kotowski I.K., Graham R., Garcia C.K., Hobbs H.H. Low LDL cholesterol in individuals of African descent resulting from frequent nonsense mutations in PCSK9. Nat. Genet. 2005;37:161–165. doi: 10.1038/ng1509. [DOI] [PubMed] [Google Scholar]
- 4.Cohen J.C., Boerwinkle E., Mosley T.H., Jr., Hobbs H.H. Sequence variations in PCSK9, low LDL, and protection against coronary heart disease. N. Engl. J. Med. 2006;354:1264–1272. doi: 10.1056/NEJMoa054013. [DOI] [PubMed] [Google Scholar]
- 5.Cohen J.C., Hobbs H.H. Genetics. Simple genetics for a complex disease. Science. 2013;340:689–690. doi: 10.1126/science.1239101. [DOI] [PMC free article] [PubMed] [Google Scholar]
- 6.Kiezun A., Garimella K., Do R., Stitziel N.O., Neale B.M., McLaren P.J., Gupta N., Sklar P., Sullivan P.F., Moran J.L. Exome sequencing and the genetic basis of complex traits. Nat. Genet. 2012;44:623–630. doi: 10.1038/ng.2303. [DOI] [PMC free article] [PubMed] [Google Scholar]
- 7.Psaty B.M., O’Donnell C.J., Gudnason V., Lunetta K.L., Folsom A.R., Rotter J.I., Uitterlinden A.G., Harris T.B., Witteman J.C., Boerwinkle E., CHARGE Consortium Cohorts for Heart and Aging Research in Genomic Epidemiology (CHARGE) Consortium: Design of prospective meta-analyses of genome-wide association studies from 5 cohorts. Circ Cardiovasc Genet. 2009;2:73–80. doi: 10.1161/CIRCGENETICS.108.829747. [DOI] [PMC free article] [PubMed] [Google Scholar]
- 8.Grove M.L., Yu B., Cochran B.J., Haritunians T., Bis J.C., Taylor K.D., Hansen M., Borecki I.B., Cupples L.A., Fornage M. Best practices and joint calling of the HumanExome BeadChip: the CHARGE Consortium. PLoS ONE. 2013;8:e68095. doi: 10.1371/journal.pone.0068095. [DOI] [PMC free article] [PubMed] [Google Scholar]
- 9.Goldstein J.I., Crenshaw A., Carey J., Grant G.B., Maguire J., Fromer M., O’Dushlaine C., Moran J.L., Chambert K., Stevens C., Swedish Schizophrenia Consortium. ARRA Autism Sequencing Consortium zCall: a rare variant caller for array-based genotyping: genetics and population analysis. Bioinformatics. 2012;28:2543–2545. doi: 10.1093/bioinformatics/bts479. [DOI] [PMC free article] [PubMed] [Google Scholar]
- 10.Tobin M.D., Sheehan N.A., Scurrah K.J., Burton P.R. Adjusting for treatment effects in studies of quantitative traits: antihypertensive therapy and systolic blood pressure. Stat. Med. 2005;24:2911–2935. doi: 10.1002/sim.2165. [DOI] [PubMed] [Google Scholar]
- 11.Baigent C., Keech A., Kearney P.M., Blackwell L., Buck G., Pollicino C., Kirby A., Sourjina T., Peto R., Collins R., Simes R., Cholesterol Treatment Trialists’ (CTT) Collaborators Efficacy and safety of cholesterol-lowering treatment: prospective meta-analysis of data from 90,056 participants in 14 randomised trials of statins. Lancet. 2005;366:1267–1278. doi: 10.1016/S0140-6736(05)67394-1. [DOI] [PubMed] [Google Scholar]
- 12.Scandinavian Simvastatin Survival Study Group Randomised trial of cholesterol lowering in 4444 patients with coronary heart disease: the Scandinavian Simvastatin Survival Study (4S) Lancet. 1994;344:1383–1389. [PubMed] [Google Scholar]
- 13.Friedewald W.T., Levy R.I., Fredrickson D.S. Estimation of the concentration of low-density lipoprotein cholesterol in plasma, without use of the preparative ultracentrifuge. Clin. Chem. 1972;18:499–502. [PubMed] [Google Scholar]
- 14.Warnick G.R., Knopp R.H., Fitzpatrick V., Branson L. Estimating low-density lipoprotein cholesterol by the Friedewald equation is adequate for classifying patients on the basis of nationally recommended cutpoints. Clin. Chem. 1990;36:15–19. [PubMed] [Google Scholar]
- 15.Li B., Leal S.M. Methods for detecting associations with rare variants for common diseases: application to analysis of sequence data. Am. J. Hum. Genet. 2008;83:311–321. doi: 10.1016/j.ajhg.2008.06.024. [DOI] [PMC free article] [PubMed] [Google Scholar]
- 16.Wu M.C., Lee S., Cai T., Li Y., Boehnke M., Lin X. Rare-variant association testing for sequencing data with the sequence kernel association test. Am. J. Hum. Genet. 2011;89:82–93. doi: 10.1016/j.ajhg.2011.05.029. [DOI] [PMC free article] [PubMed] [Google Scholar]
- 17.Liu X., Jian X., Boerwinkle E. dbNSFP v2.0: a database of human non-synonymous SNVs and their functional predictions and annotations. Hum. Mutat. 2013;34:E2393–E2402. doi: 10.1002/humu.22376. [DOI] [PMC free article] [PubMed] [Google Scholar]
- 18.Teslovich T.M., Musunuru K., Smith A.V., Edmondson A.C., Stylianou I.M., Koseki M., Pirruccello J.P., Ripatti S., Chasman D.I., Willer C.J. Biological, clinical and population relevance of 95 loci for blood lipids. Nature. 2010;466:707–713. doi: 10.1038/nature09270. [DOI] [PMC free article] [PubMed] [Google Scholar]
- 19.Quagliarini F., Wang Y., Kozlitina J., Grishin N.V., Hyde R., Boerwinkle E., Valenzuela D.M., Murphy A.J., Cohen J.C., Hobbs H.H. Atypical angiopoietin-like protein that regulates ANGPTL3. Proc. Natl. Acad. Sci. USA. 2012;109:19751–19756. doi: 10.1073/pnas.1217552109. [DOI] [PMC free article] [PubMed] [Google Scholar]
- 20.Zhang R., Abou-Samra A.B. Emerging roles of Lipasin as a critical lipid regulator. Biochem. Biophys. Res. Commun. 2013;432:401–405. doi: 10.1016/j.bbrc.2013.01.129. [DOI] [PubMed] [Google Scholar]
- 21.Yi P., Park J.S., Melton D.A. Betatrophin: a hormone that controls pancreatic β cell proliferation. Cell. 2013;153:747–758. doi: 10.1016/j.cell.2013.04.008. [DOI] [PMC free article] [PubMed] [Google Scholar] [Retracted]
- 22.Ho Y.S., Swenson L., Derewenda U., Serre L., Wei Y., Dauter Z., Hattori M., Adachi T., Aoki J., Arai H. Brain acetylhydrolase that inactivates platelet-activating factor is a G-protein-like trimer. Nature. 1997;385:89–93. doi: 10.1038/385089a0. [DOI] [PubMed] [Google Scholar]
- 23.Stafforini D.M., McIntyre T.M., Zimmerman G.A., Prescott S.M. Platelet-activating factor acetylhydrolases. J. Biol. Chem. 1997;272:17895–17898. doi: 10.1074/jbc.272.29.17895. [DOI] [PubMed] [Google Scholar]
- 24.Derewenda Z.S., Derewenda U. The structure and function of platelet-activating factor acetylhydrolases. Cell. Mol. Life Sci. 1998;54:446–455. doi: 10.1007/s000180050172. [DOI] [PMC free article] [PubMed] [Google Scholar]
- 25.Bishop J.R., Passos-Bueno M.R., Fong L., Stanford K.I., Gonzales J.C., Yeh E., Young S.G., Bensadoun A., Witztum J.L., Esko J.D., Moulton K.S. Deletion of the basement membrane heparan sulfate proteoglycan type XVIII collagen causes hypertriglyceridemia in mice and humans. PLoS ONE. 2010;5:e13919. doi: 10.1371/journal.pone.0013919. [DOI] [PMC free article] [PubMed] [Google Scholar]
- 26.Oexle K., Ried J.S., Hicks A.A., Tanaka T., Hayward C., Bruegel M., Gögele M., Lichtner P., Müller-Myhsok B., Döring A. Novel association to the proprotein convertase PCSK7 gene locus revealed by analysing soluble transferrin receptor (sTfR) levels. Hum. Mol. Genet. 2011;20:1042–1047. doi: 10.1093/hmg/ddq538. [DOI] [PMC free article] [PubMed] [Google Scholar]
- 27.Seidah N.G., Khatib A.M., Prat A. The proprotein convertases and their implication in sterol and/or lipid metabolism. Biol. Chem. 2006;387:871–877. doi: 10.1515/BC.2006.110. [DOI] [PubMed] [Google Scholar]
- 28.Voight B.F., Peloso G.M., Orho-Melander M., Frikke-Schmidt R., Barbalic M., Jensen M.K., Hindy G., Hólm H., Ding E.L., Johnson T. Plasma HDL cholesterol and risk of myocardial infarction: a mendelian randomisation study. Lancet. 2012;380:572–580. doi: 10.1016/S0140-6736(12)60312-2. [DOI] [PMC free article] [PubMed] [Google Scholar]
Associated Data
This section collects any data citations, data availability statements, or supplementary materials included in this article.