

Abstract
Background
Rats fed diets deficient in choline develop hepatocellular carcinoma (HCC). Tumor DNA from these animals is characteristically hypomethylated, suggesting that disruption of the one-carbon metabolism pathway is an underlying mechanism for hepatocarcinogenesis. Prospective studies in humans on circulating choline and other one-carbon metabolites and HCC risk have been lacking.
Methods
We prospectively examined the association between prediagnostic serum concentrations of one-carbon metabolites including betaine, choline, cystathionine, homocysteine, methionine, 5-methyltetrahydrofolate (5-MTHF), pyridoxal-5-phosphate (PLP, the bioactive form of vitamin B6) and S-adenosylmethionine (SAM), and risk of developing HCC based on a nested case-control study of 297 incident cases and 631 matched controls from a cohort of 18,244 men in Shanghai, China. Logistic regression methods were used to calculate odds ratios (OR) and 95% confidence intervals (CI) adjusted for established risk factors for HCC.
Results
Serum choline and PLP were associated with statistically significant reduced risk of HCC, while serum cystathionine, methionine and SAM were associated with increased HCC risk (all Ptrend<0.05). The inverse associations for HCC risk with choline and PLP remained statistically significant after adjusting for all potential confounders. The multivariate-adjusted ORs (95% CIs) for the highest versus lowest quintiles of serum choline and PLP were 0.35 (0.16, 0.78) (P=0.010) and 0.44 (0.25, 0.78) (P=0.005), respectively. There were no associations for HCC risk with 5-MTHF, betaine, or homocysteine.
Conclusion
The inverse associations between choline and vitamin B6 and the risk of HCC development are novel and warrant further investigation.
Impact
Identifying new modifiable factors for HCC prevention are warranted.
Keywords: choline, hepatocellular carcinoma, one-carbon metabolism, vitamin B6
INTRODUCTION
Liver cancer in men is the fifth most frequently diagnosed cancer worldwide and the second most frequent cause of cancer death (1). In high-risk populations, important risk factors for hepatocellular carcinoma (HCC) include chronic infection with hepatitis B virus (HBV) and dietary aflatoxin (2). In relatively lower-risk populations, hepatitis C, excessive alcohol intake, cigarette smoking, diabetes and obesity play a prominent role in HCC development (3-5).
The one-carbon metabolism pathway comprises a network of integrated biochemical pathways that donate and regenerate the one-carbon moieties needed for two critically important functions: nucleotide synthesis and methylation (Figure 1) (6). The one-carbon metabolism pathway is hypothesized to play an important role in hepatocellular carcinogenesis (7). For example, rats fed diets deficient in choline for one year develop HCC without the administration of carcinogens (8). In addition, global hypomethylation in hepatic tumor DNA (9), and methylation patterns that result in alterations of proto-oncogene and tumor suppressor gene expression are common features of liver tumor cells from rodents fed methyl-deficient diets (10, 11).
Figure 1. Schematic representation of one-carbon metabolism pathways of DNA synthesis and methylation.
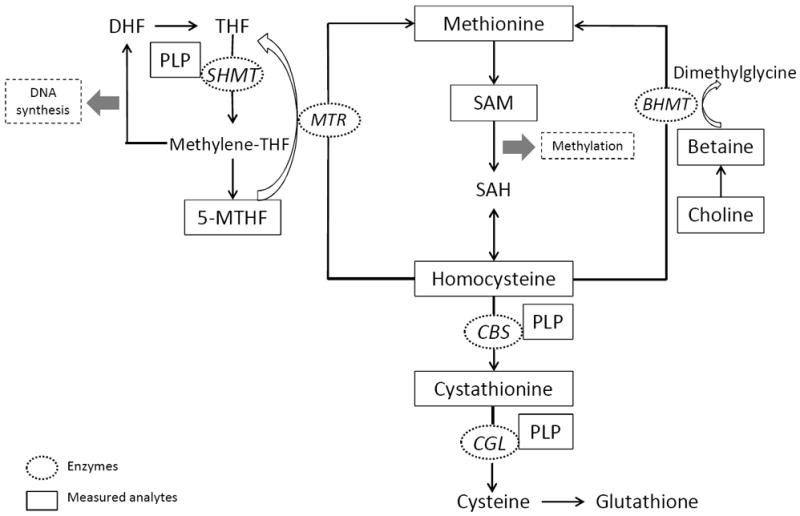
Abbreviations: BHMT, betaine homocysteine methyltransferate; CBS, cystathionine β-synthase; CGL, cystathione γ-lyase; DHF, dihydrofolate; MTHF, methyl-tetrahydrofolate; MTR, methionine synthase; PLP, pyridoxal-5-phosphate; SAH, S-adenosylhomocysteine; SAM, S-adenosylmethionine; SHMT, serine hydroxymethyltransferase; THF, tetrahydrofolate.
As the primary methyl donor, S-adenosylmethionine (SAM), derived from dietary sources of methionine or homocysteine (Figure 1), has tight control of the main features of hepatic one-carbon metabolism (12). Homocysteine is either remethylated to methionine by betaine-homocysteine methyltransferase (BHMT), or metabolized to cystathionine by vitamin B6 (pyridoxal-5-phosphate, PLP)-dependent cystathionine β-synthase (CBS) (13). Mice with inactive BHMT are prone to fatty livers and HCC (14). Decreased CBS activity, as a result of PLP deficiency, is associated with reduced methylation capacity in vivo (15) and is observed in humans with cirrhosis and HCC (16, 17).
Patients with cirrhosis, a precursor of HCC, had reduced plasma PLP levels (18). Prospective studies on circulating PLP and HCC risk are needed to confirm whether reduced PLP levels lead to the development of HCC or are the consequence of impaired liver function associated with cirrhosis. In the present study, we examined the relation between levels of several one-carbon metabolites in serum collected before cancer diagnosis, and the risk of developing HCC in a cohort of men in Shanghai, China after more than 20 years of follow-up. The metabolites measured are betaine, choline, cystathionine, total homocysteine, methionine, 5-methyltetrahydrofolate (5-MTHF), PLP, and SAM.
SUBJECTS AND METHODS
Study Population
The design of the Shanghai Cohort Study has been described in detail elsewhere (19). Briefly, 18,244 men (about 80% of eligible subjects) between 45 and 64 years of age and no history of cancer at recruitment were enrolled in the study between January 1986 and September 1989. Each participant was interviewed in person using a structured questionnaire to obtain information on demographic characteristics, use of tobacco and alcohol, usual adult diet, and medical history. Non-fasting blood samples were collected from each participant and stored at −70°C before analysis. The Institutional Review Boards at the University of Pittsburgh and the Shanghai Cancer Institute have approved this study.
Case Patients
Identification of incident cancer cases and deaths among cohort participants has been accomplished through routine reviews of reports from the population-based Shanghai Cancer Registry and from the Shanghai Municipal Vital Statistics Office, as well as by annual in-person interviews of all surviving cohort members. Cumulatively, only 985 (5.4%) cohort participants had been lost to follow-up by the end of 2008.
As of November 1, 2012, the study had accumulated 449,523 person-years of observation. Two hundred and ninety-seven cohort participants who were free of cancer at recruitment had developed HCC. Cases were diagnosed on the basis of histopathologic confirmation (n = 50), elevated serum α-fetoprotein with consistent clinical and radiologic history (n = 74), positive computerized axial tomography scan and/or ultrasonography with consistent clinical history (n = 153), or by death certificate only (n = 20).
Control Subjects
Five to ten control subjects among cohort participants without diagnosis of HCC were individually matched to an index case by date of birth (within two years), date of blood draw (within one month), and neighborhood of residence at recruitment in our previous studies (20-22). For the present study, matched pairs included the first two control subjects that were originally matched to each case. In addition, for the present study, an additional 39 control subjects were included who tested positive for hepatitis B surface antigen (HBsAg) in previous studies (20-22) to increase the sample size within this group (i.e., positive HBsAg controls).
Laboratory Tests
All serum samples of a given matched set (containing the samples from the case and the matched controls) of all 297 case-control sets were tested in the same batch for all laboratory measurements. Serum total homocysteine was determined by liquid chromatography-electrospray ionization (ESI) tandem mass spectrometry (LC-ESI-MS/MS) as previously described (23). Serum betaine, choline, methionine, cystathionine, PLP and SAM were quantified by the methods described previously (24, 25). Serum 5-MTHF was determined by LC-ESI-MS/MS. The samples were analyzed following injection of 20 μL of extract on a Synergi Hydro 4μ 150×3mm maintained at 30°C (Phenomenex) and eluted in a gradient with buffer A (100% water with 0.1% formic acid) and buffer B (100% Methanol with 0.1% formic acid). The flow rate was 0.5 mL/min, with a step-wise gradient over a total run time of 10 min: 0.0 – 5.5 min, 5% B; 5.6 min, 50% B (linear gradient 2); 7.5 min, 75% B (linear gradient); 7.6 min, 5% B (linear gradient). The observed (m/z) values of the fragment ions were 5-MTHF (m/z 460→313) and 13C55-MTHF (m/z 465→313). The inter-assay precision measures of all analytes included in the present study were below 10% coefficient of variation (Supplementary Table S1). All data were collected and processed using Analyst software version 1.4.2 (Applied Biosystems). The one-carbon metabolites were measured in the Bottiglieri Laboratory.
Seropositivity for the hepatitis B surface antigen (HBsAg) was determined using a standard radioimmunoassay (AUSRIA; Abbott Laboratories, Abbott Park, IL) in the Govindarajan Laboratory. The serological status of the antibodies to hepatitis C virus (anti-HCV) were determined on the first 76 HCC cases and their 410 matched controls using ELISA version 2.0 (Ortho, Raritan, NJ). Only one case and one control were positive for anti-HCV (26). We did not measure anti-HCV on the remaining cases and controls in the present study given its negligible role in HCC in this Chinese population and thus, to reserve precious serum specimens for future research.
Statistical analysis
Statistical testing was performed on logarithmically transformed values of metabolites due to their skewed distributions. The analysis of covariance (ANCOVA) method was used to examine the difference in the mean concentration levels of serum metabolites between subjects with and those without risk factors for HCC among controls only. In these analyses, the base 2 logarithm (log2) of serum concentrations of a given metabolite was the dependent variable. We present the back transformed values, i.e., the ratios of serum concentrations calculated as 2 raised to the power of the beta estimates (Supplementary Table S2).
We performed the same statistical analyses on matched and unmatched case-control sets with similar results (Supplementary Table S3). All results presented in this report were based on unmatched analyses with maximized sample size. In the unmatched analyses, we broke originally matched case-control sets and used unconditional logistic regression models including all matching factors to calculate odds ratios (ORs) and their corresponding 95% confidence intervals (CIs) and P values. Study subjects were grouped into quintile categories based on the distributions of serum micronutrients. To compute the linear trend tests we used ordinal variables for serum metabolites where each category was assigned the median value within each quintile of the corresponding metabolite. To adjust for potential confounding effects of established risk factors for HCC, the multivariate logistic regression models also included the following variables: cigarette smoking (ever versus never smokers), heavy alcohol consumption (≥4 drinks per day versus nondrinkers or <4 drinks per day), self-reported history of physician-diagnosed liver cirrhosis (yes versus no), and the presence of HBsAg in serum (yes versus no). Given the extremely low prevalence of anti-HCV in the study population (e.g., 1.3% in HCC cases and 0.2% in control subjects), serological status of anti-HCV was not determined on all study subjects included in the present study, and thus not included in the multivariate regression models. Statistical computing was conducted using the SAS version 9.2 statistical software package (SAS Institute Inc., NC). All P values quoted are two-sided and considered statistically significant if less than 0.05.
RESULTS
The mean age (± standard deviation) of cases at diagnosis of HCC was 66.3 (±7.3) years while the corresponding age of control subjects at the time of case’s diagnosis was 65.9 (±6.9) years. The average time interval between blood draw and cancer diagnosis among cases was 9.8 (± 5.8) years (range, 1 month to 22 years). Table 1 shows the distributions of selected baseline characteristics and risk factors for HCC in cases and control subjects. The prevalence of ever smokers, and positive test for HBsAg were higher among HCC cases than control subjects. Heavy alcohol consumption was slightly more prevalent in cases than controls. There were no differences by body mass index or prevalence of self-reported history of physician diagnosed type 2 diabetes between HCC cases and controls. Ten percent of HCC cases and one percent of controls reported a history of physician-diagnosed liver cirrhosis. Approximately 60% of HCC cases and 11% of controls tested positive for HBsAg in serum (Table 1). The prevalence of liver cirrhosis among HBsAg positive and negative cases was 12.5% and 7.5%, respectively. The corresponding values among controls were 1.9% and 1.1%, respectively.
Table 1.
Baseline demographic and lifestyle characteristics of study participants who developed hepatocellular carcinoma (cases) and those who remained cancer free (controls)
| Cases | Controls | P valuea | |
|---|---|---|---|
| Number of subjects | 297 | 631 | |
| Age (yr), mean ± SD | 56.5 ± 5.0 | 56.3 ± 5.0 | 0.59 |
| Body mass index (kg/m2), % | |||
| Mean ± SD | 22.1 ± 3.2 | 22.1 ± 3.0 | 0.84 |
| <18.5 | 8.4 | 9.0 | |
| 18.5 - <25.0 | 74.4 | 74.0 | |
| 25.0 - <30.0 | 15.5 | 15.7 | |
| ≥30.0 | 1.7 | 1.3 | 0.95 |
| Highest level of education, % | |||
| No formal education | 4.4 | 5.5 | |
| Primary | 30.3 | 28.7 | |
| Secondary and above | 65.3 | 65.8 | 0.70 |
| Cigarette smoking, % | |||
| Never smokers | 38.0 | 46.3 | |
| Former smokers | 8.8 | 6.5 | |
| Current smokers | 53.2 | 47.2 | 0.049 |
| Alcohol drinking, % | |||
| Nondrinkers | 60.3 | 56.9 | |
| <4 drinks/day | 31.0 | 36.0 | |
| ≥4 drinks/day | 8.7 | 7.1 | 0.28 |
| Self-reported history of physician-diagnosed type 2 diabetes, % | |||
| No | 99.7 | 99.0 | |
| Yes | 0.3 | 1.0 | 0.31 |
| Self-reported history of physician-diagnosed liver cirrhosis, % | |||
| No | 89.6 | 98.7 | |
| Yes | 10.4 | 1.3 | <0.001 |
| HBsAg serology, % | |||
| Negative | 40.4 | 89.0b | |
| Positive | 59.6 | 11.0b | <0.001 |
Abbreviation: HBsAg, hepatitis B surface antigen
2-sided P values were based on t test for continuous variables or chi-square test for categorical variables.
Serology of the hepatitis B surface antigen (HBsAg) was determined for a total of 592 controls after excluding 39 HBsAg positive controls from previous studies, as described in the Methods.
Among control subjects, serum levels of cystathionine, 5-MTHF and PLP were lower in current smokers than never smokers (Supplementary Table S2). Regular alcohol drinkers had elevated serum choline level but reduced serum levels of cystathionine and SAM. Compared with HBsAg-negative control subjects, HBsAg-positive individuals had elevated serum level of choline, but had comparable levels of all other analytes. Serum cystathionine level was approximately 50% higher in controls with a history of cirrhosis than in controls without a history of cirrhosis. Most of the measured analytes were weakly correlated with each other (Supplementary Table S4).
Table 2 shows geometric means of serum one-carbon metabolites among all HCC cases and control subjects, as well as among subgroups stratified by HBsAg status. Among total and HBsAg-negative subjects, cases had statistically significant higher levels of cystathionine than controls. Among HBsAg-positive subjects, cases had statistically significant lower levels of choline and PLP, and higher levels of methionine and SAM than controls. There were no statistically significant differences in serum levels of betaine, homocysteine and 5-MTHF between cases and controls among total subjects or subgroups stratified by HBsAg status.
Table 2.
Geometric meansa of prediagnostic serum concentrations of one-carbon metabolites in hepatocellular carcinoma cases and control subjects, overall and by HBsAg status
| Serum metaboliteb | Cases | Controls | P value |
|---|---|---|---|
| Betaine (μmol/L) | |||
| Total subjects | 66.3 | 65.4 | 0.51 |
| HBsAg-negative | 64.5 | 64.2 | 0.86 |
| HBsAg-positive | 68.0 | 66.0 | 0.44 |
| Choline (μmol/L) | |||
| Total subjects | 22.5 | 23.0 | 0.25 |
| HBsAg-negative | 22.9 | 22.5 | 0.58 |
| HBsAg-positive | 22.5 | 24.3 | 0.02 |
| Cystathionine (nmol/L) | |||
| Total subjects | 315.2 | 281.4 | 0.003 |
| HBsAg-negative | 322.5 | 287.1 | 0.02 |
| HBsAg-positive | 308.8 | 277.6 | 0.10 |
| Homocysteine (μmol/L) | |||
| Total subjects | 13.1 | 13.7 | 0.10 |
| HBsAg-negative | 13.4 | 13.9 | 0.35 |
| HBsAg-positive | 12.9 | 13.8 | 0.18 |
| Methionine (μmol/L) | |||
| Total subjects | 31.3 | 30.3 | 0.15 |
| HBsAg-negative | 29.0 | 29.5 | 0.63 |
| HBsAg-positive | 33.0 | 29.8 | 0.006 |
| 5-MTHF (nmol/L) | |||
| Total subjects | 20.2 | 20.8 | 0.29 |
| HBsAg-negative | 20.2 | 21.0 | 0.34 |
| HBsAg-positive | 20.1 | 20.6 | 0.64 |
| PLP (nmol/L) | |||
| Total subjects | 21.2 | 24.2 | 0.003 |
| HBsAg-negative | 22.2 | 25.0 | 0.05 |
| HBsAg-positive | 20.4 | 23.9 | 0.04 |
| SAM (nmol/L) | |||
| Total subjects | 36.3 | 35.4 | 0.50 |
| HBsAg-negative | 32.4 | 34.5 | 0.21 |
| HBsAg-positive | 39.3 | 33.6 | 0.01 |
Abbreviations: 5-MTHF, 5-methyltetrahydrofolate; HBsAg, hepatitis B surface antigen; PLP, pyridoxal-5-phosphate; SAM, S-adenosylmethionine
All geometric means were calculated using analysis of covariance regression models that retained a matched set consisting of 2 to 3 control subjects who were individually matched to the index case. Covariates were cigarette smoking (nonsmokers, ever smokers), heavy alcohol consumption (nondrinkers or <4 drinks/day, ≥4 drinks/day), self-reported history of physician-diagnosed liver cirrhosis at recruitment (no, yes), and serology of hepatitis B surface antigen (HBsAg) for total subjects.
The following number of subjects (n) were excluded from the analysis of specific metabolites: betaine (3 cases), choline (3 cases), cystathionine (3 cases), homocysteine (1 case), methionine (4 cases), 5-MTHF (1 cases and 1 control), and SAM (3 cases).
Table 3 shows the ORs for HCC in relation to quintile levels of serum one-carbon metabolites. Before adjustment for potential confounders, increased serum levels of homocysteine and PLP were associated with reduced risk of HCC, whereas increased serum levels of betaine, cystathionine, methionine, and SAM were associated with increased risk of HCC (all Ptrend <0.05). After adjustment for potential confounders including cigarette smoking, heavy consumption of alcohol, HBsAg status and history of cirrhosis, the inverse relation for HCC risk with serum choline levels strengthened and became statistically significant where as the positive association with betaine and homocysteine weakened considerably and became statistically nonsignificant. The statistical significance of the inverse association with PLP and the positive associations with cystathionine and SAM remained (all Ptrend<0.05).
Table 3.
Odds ratios (ORs) and 95% confidence intervals (CIs) of hepatocellular carcinoma in relation to prediagnostic serum levels of one-carbon metabolites
| Odds Ratios (95% CIs) by quintile level of serum metabolitea
|
Ptrend | |||||
|---|---|---|---|---|---|---|
| 1st (low) | 2nd | 3rd | 4th | 5th (high) | ||
| Betaine, μmol/L | <48.5 | 48.5-57.8 | 57.9-65.3 | 65.4-75.8 | >75.8 | |
| Cases/Controls | 47/128 | 56/126 | 58/125 | 56/126 | 77/126 | |
| Minimally-adjusted modelb | 1.00 (Referent) | 1.20 (0.76-1.91) | 1.25 (0.79-1.97) | 1.19 (0.75-1.89) | 1.63 (1.05-2.54) | 0.04 |
| Risk factor-adjusted modelc | 1.00 (Referent) | 1.09 (0.65-1.82) | 1.07 (0.64-1.80) | 0.89 (0.53-1.50) | 1.35 (0.82-2.22) | 0.36 |
| Metabolite-adjusted modeld | 1.00 (Referent) | 1.06 (0.62-1.81) | 0.96 (0.55-1.67) | 0.79 (0.45-1.40) | 1.37 (0.78-2.41) | 0.41 |
| Choline, μmol/L | <16.8 | 16.8-19.8 | 19.9-24.0 | 24.1-30.6 | >30.6 | |
| Cases/Controls | 63/127 | 58/128 | 68/127 | 53/123 | 52/126 | |
| Minimally-adjusted modelb | 1.00 (Referent) | 0.90 (0.58-1.39) | 1.06 (0.69-1.63) | 0.78 (0.49-1.24) | 0.62 (0.35-1.08) | 0.08 |
| Risk factor-adjusted modelc | 1.00 (Referent) | 0.80 (0.49-1.32) | 0.88 (0.54-1.44) | 0.67 (0.39-1.14) | 0.45 (0.23-0.85) | 0.02 |
| Metabolite-adjusted modeld | 1.00 (Referent) | 0.76 (0.45-1.30) | 0.83 (0.49-1.40) | 0.59 (0.32-1.08) | 0.35 (0.16-0.78) | 0.01 |
| Cystathionine, nmol/L | <176 | 176-223 | 224-281 | 282-360 | >360 | |
| Cases/Controls | 47/131 | 47/124 | 59/126 | 60/124 | 81/126 | |
| Minimally-adjusted modelb | 1.00 (Referent) | 1.05 (0.65-1.69) | 1.29 (0.82-2.04) | 1.36 (0.86-2.15) | 1.82 (1.18-2.81) | 0.003 |
| Risk factor-adjusted modelc | 1.00 (Referent) | 1.22 (0.72-2.08) | 1.42 (0.85-2.37) | 1.32 (0.78-2.23) | 2.03 (1.23-3.35) | 0.005 |
| Metabolite-adjusted modeld | 1.00 (Referent) | 1.23 (0.69-2.16) | 1.30 (0.74-2.27) | 1.00 (0.55-1.81) | 1.40 (0.76-2.57) | 0.43 |
| Homocysteine, μmol/L | <10.8 | 10.8-12.5 | 12.6-14.5 | 14.6-17.6 | >17.6 | |
| Cases/Controls | 79/136 | 62/121 | 55/125 | 45/126 | 55/123 | |
| Minimally-adjusted modelb | 1.00 (Referent) | 0.88 (0.58-1.34) | 0.75 (0.49-1.15) | 0.60 (0.38-0.94) | 0.74 (0.48-1.14) | 0.12 |
| Risk factor-adjusted modelc | 1.00 (Referent) | 0.80 (0.50-1.30) | 0.86 (0.53-1.40) | 0.61 (0.37-1.02) | 0.81 (0.49-1.33) | 0.38 |
| Metabolite-adjusted modeld | 1.00 (Referent) | 0.83 (0.50-1.39) | 0.95 (0.57-1.58) | 0.61 (0.34-1.07) | 0.78 (0.44-1.37) | 0.37 |
| Methionine, μmol/L | <23.0 | 23.0-26.3 | 26.4-29.4 | 29.5-34.3 | >34.3 | |
| Cases/Controls | 50/130 | 40/125 | 45/124 | 67/126 | 91/126 | |
| Minimally-adjusted modelb | 1.00 (Referent) | 0.84 (0.51-1.35) | 0.94 (0.59-1.51) | 1.39 (0.89-2.17) | 1.89 (1.23-2.90) | <0.001 |
| Risk factor-adjusted modelc | 1.00 (Referent) | 0.70 (0.41-1.22) | 0.80 (0.47-1.37) | 1.25 (0.76-2.06) | 1.49 (0.92-2.43) | 0.01 |
| Metabolite-adjusted modeld | 1.00 (Referent) | 0.67 (0.38-1.19) | 0.77 (0.44-1.37) | 1.50 (0.85-2.63) | 1.51 (0.84-2.74) | 0.03 |
| 5-MTHF, nmol/L | <15.2 | 15.2-19.5 | 19.6-23.4 | 23.5-29.4 | >29.4 | |
| Cases/Controls | 82/126 | 57/127 | 56/126 | 39/129 | 62/122 | |
| Minimally-adjusted modelb | 1.00 (Referent) | 0.68 (0.44-1.03) | 0.67 (0.44-1.02) | 0.46 (0.29-0.73) | 0.76 (0.50-1.15) | 0.17 |
| Risk factor-adjusted modelc | 1.00 (Referent) | 0.72 (0.44-1.15) | 0.60 (0.36-0.97) | 0.46 (0.27-0.77) | 0.85 (0.53-1.38) | 0.43 |
| Metabolite-adjusted modeld | 1.00 (Referent) | 0.78 (0.47-1.30) | 0.61 (0.36-1.04) | 0.41 (0.23-0.73) | 0.85 (0.50-1.46) | 0.45 |
| PLP, nmol/L | <17.7 | 17.7-22.2 | 22.3-27.6 | 27.7-37.0 | >37.0 | |
| Cases/Controls | 103/128 | 58/125 | 47/126 | 54/126 | 35/126 | |
| Minimally-adjusted modelb | 1.00 (Referent) | 0.58 (0.38-0.86) | 0.46 (0.30-0.70) | 0.53 (0.35-0.81) | 0.34 (0.22-0.55) | <0.001 |
| Risk factor-adjusted modelc | 1.00 (Referent) | 0.63 (0.40-1.01) | 0.56 (0.34-0.90) | 0.66 (0.41-1.06) | 0.45 (0.26-0.76) | 0.009 |
| Metabolite-adjusted modeld | 1.00 (Referent) | 0.64 (0.39-1.04) | 0.56 (0.33-0.94) | 0.69 (0.41-1.15) | 0.44 (0.25-0.78) | 0.02 |
| SAM, nmol/L | <21.2 | 21.2-37.1 | 37.2-46.8 | 46.9-56.8 | >56.8 | |
| Cases/Controls | 53/127 | 57/126 | 42/126 | 56/127 | 86/125 | |
| Minimally-adjusted modelb | 1.00 (Referent) | 1.34 (0.80-2.23) | 1.06 (0.59-1.90) | 1.38 (0.79-2.41) | 2.16 (1.26-3.73) | 0.003 |
| Risk factor-adjusted modelc | 1.00 (Referent) | 1.41 (0.78-2.56) | 1.21 (0.62-2.35) | 1.23 (0.65-2.32) | 2.31 (1.23-4.32) | 0.01 |
| Metabolite-adjusted modeld | 1.00 (Referent) | 1.06 (0.54-2.08) | 0.86 (0.41-1.84) | 0.73 (0.34-1.55) | 1.25 (0.58-2.68) | 0.60 |
Abbreviations: 5-MTHF, 5-methyltetrahydrofolate; PLP, pyridoxal-5-phosphate; SAM, S-adenosylmethionine
See Supplementary Table S3 for the quintile cut points of serum concentrations of various one-carbon metabolites and number of cancer patients and control subjects in each category of a given biomarker.
In the minimally-adjusted model, odds ratios were calculated using unconditional logistic regression models adjusted for matching factors.
In the risk factor-adjusted model, odds ratios were calculated using unconditional logistic regression models adjusted for matching factors, in addition to cigarette smoking (nonsmokers, ever smokers), heavy alcohol consumption (nondrinkers or <4 drinkers/day, ≥4 drinks/day), self-reported history of physician-diagnosed liver cirrhosis at recruitment (no, yes), and seropositivity for hepatitis B surface antigen (negative, positive).
In the metabolite-adjusted model, odds ratios were calculated using unconditional logistic regression models adjusted for matching factors, HCC risk factors (listed under c), in addition to all one-carbon metabolites shown in the table.
Given the inter-relationship of the measured one-carbon metabolites, we examined whether the metabolite-HCC risk associations were independent of each other (Table 3). The additional adjustment considerably attenuated the association for HCC risk with levels of cystathionine and SAM (both Ptrend ≥0.49). Although the trend test for the association between methionine and HCC risk was statistically significant (Ptrend=0.03), the odds ratios for individual quintile levels were not statistically significant. The inverse associations with PLP and choline remained statistically significant after adjustment for all other one-carbon metabolites (Table 3).
We further examined the inverse associations between serum levels of all one-carbon metabolites and HCC risk in subgroups defined by HBsAg status and history of cirrhosis. Among HBsAg-negative individuals who had no history of cirrhosis at recruitment, the inverse associations for HCC risk with serum choline and PLP remained and the magnitude of the odds ratios were comparable to those observed in total subjects although the test for trend for choline was statistically borderline significant (Ptrend = 0.06) (Table 4). On the other hand, a statistically significant positive association between serum methionine levels and HCC risk was only present in men with positive HBsAg and/or liver cirrhosis (Table 4). Cigarette smoking or alcohol consumption did not significantly modify the association for HCC risk with serum levels of choline, PLP or methionine (Supplementary Table S5). Similar to the results from all subjects, there were no statistically significant associations between serum levels of betaine, cystathionine, homocysteine, 5-MTHF and SAM and risk of HCC in subgroups stratified by HBsAg status and history of cirrhosis, as well as by smoking and alcohol consumption (data not shown).
Table 4.
Odds ratios (ORs) and 95% confidence intervals (CIs) of hepatocellular carcinoma (HCC) in relation to prediagnostic serum levels of choline, methionine and pyridoxal phosphate by hepatitis B surface antigen (HBsAg) status and self-reported history of physician-diagnosed cirrhosis at recruitment
| Quintile level of serum metabolite
|
Ptrend | |||||
|---|---|---|---|---|---|---|
| 1st (low) | 2nd | 3rd | 4th | 5th (high) | ||
| HBsAg (-) and no cirrhosisa | ||||||
| Choline | ||||||
| Cases/controls | 21/109 | 21/106 | 27/101 | 19/106 | 21/98 | |
| Adjusted OR (95% CI)b | 1.00 (Referent) | 0.75 (0.36-1.58) | 0.90 (0.44-1.84) | 0.54 (0.24-1.20) | 0.38 (0.13-1.06) | 0.06 |
| Methionine | ||||||
| Cases/controls | 29/105 | 15/105 | 15/103 | 26/104 | 24/103 | |
| Adjusted OR (95% CI)b | 1.00 (Referent) | 0.49 (0.23-1.01) | 0.42 (0.19-0.90) | 0.87 (0.42-1.79) | 0.77 (0.36-1.67) | 0.92 |
| PLP | ||||||
| Cases/controls | 36/102 | 19/105 | 21/100 | 21/104 | 12/109 | |
| Adjusted OR (95% CI)b | 1.00 (Referent) | 0.55 (0.28-1.07) | 0.70 (0.35-1.39) | 0.67 (0.33-1.36) | 0.37 (0.17-0.83) | 0.03 |
| HBsAg (+) and/or no cirrhosisa | ||||||
| Choline | ||||||
| Cases/controls | 42/17 | 37/22 | 41/26 | 34/17 | 30/28 | |
| Adjusted OR (95% CI)b | 1.00 (Referent) | 0.60 (0.24-1.51) | 0.51 (0.20-1.34) | 0.55 (0.18-1.66) | 0.18 (0.04-0.84) | 0.04 |
| Methionine | ||||||
| Cases/controls | 21/24 | 25/20 | 30/21 | 41/22 | 67/23 | |
| Adjusted OR (95% CI)b | 1.00 (Referent) | 1.13 (0.44-2.92) | 1.35 (0.51-3.58) | 3.31 (1.23-8.91) | 4.10 (1.52-11.03) | 0.002 |
| PLP | ||||||
| Cases/controls | 65/26 | 39/20 | 25/25 | 32/22 | 23/17 | |
| Adjusted OR (95% CI)b | 1.00 (Referent) | 0.69 (0.30-1.58) | 0.32 (0.13-0.76) | 0.66 (0.28-1.56) | 0.58 (0.22-1.50) | 0.30 |
Abbreviation: PLP, pyridoxal-5-phosphate
Subgroups were defined by serum HBsAg status (positive or negative) and self-reported history of physician diagnosed liver cirrhosis at recruitment (yes or no).
Odds ratios were calculated from one unconditional logistic model that included matching factors and the following established risk factors: cigarette smoking (nonsmokers, ever smokers), heavy alcohol consumption (nondrinkers or <4 drinkers/day, ≥4 drinks/day), and all one-carbon metabolites (e.g., betaine, choline, cystathionine, homocysteine, methionine, 5-methyltetrahydrofolate, pyridoxal-5-phosphate, and S-adenosylmethionine).
We conducted sensitivity analyses for choline and PLP in relation to the risk of developing HCC after excluding individuals with diagnosis of HCC within five years post-blood draw. The independent associations with choline and PLP remained. Compared with the lowest quintiles, the multivariate-adjusted ORs (95% CIs) of HCC for the 2nd, 3rd, 4th, and 5th quintiles of choline were 0.78 (0.44, 1.37) (P=0.38), 0.75 (0.43, 1.33) (P=0.33), 0.46 (0.23, 0.90) (P=0.02) and 0.31 (0.13, 0.77) (P=0.01), and for PLP they were 0.60 (0.34, 1.04) (P=0.07), 0.64 (0.36, 1.12) (P=0.12), 0.73 (0.42, 1.27) (P=0.26) and 0.45 (0.24, 0.84) (P=0.01) (both Ptrend<0.05). Additional analyses among HCC cases that occurred more than 10 years post-blood collection showed similar results; the corresponding odds ratios for choline were 1.09 (0.53, 2.24) (P=0.81), 0.98 (0.47, 2.03) (P=0.95), 0.78 (0.34, 1.79) (P=0.55) and 0.42 (95% CI: 0.14, 1.29) (P=0.13), and for PLP they were 0.52 (0.25, 1.05) (P=0.07), 0.72 (0.36, 1.41) (P=0.34), 0.81 (0.40, 1.62) (P=0.55), and 0.44 (95% CI: 0.20, 1.00) (P=0.049). We conducted similar sensitivity analyses for methionine among individuals with positive HBsAg and/or history of liver cirrhosis, because these individuals were at increased HCC risk with increasing methionine levels. The positive association between serum methionine levels and HCC risk was stronger when the analyses were restricted to cases diagnosed within the first five years post-blood collection than cases diagnosed after five years post-blood collection. Compared with the lowest quintile of methionine, the odds ratios (95% CIs) for the 2nd, 3rd, 4th, and 5th quintiles were 3.28 (0.66, 16.33) (P=0.15), 7.09 (1.42, 35.38) (P=0.02), 5.89 (0.95, 36.43) (P=0.06), and 10.83 (1.88, 62.49) (P=0.008), respectively, for developing HCC within the first five years post-blood draw (Ptrend = 0.008). The corresponding odds ratios (95% CIs) for the development of HCC after five or more years post-blood draw were 1.51 (0.55, 4.15) (P=0.43), 1.04 (0.36, 3.00) (P=0.94), 3.27 (1.18, 9.05) (P=0.02), and 2.87 (1.01, 8.13) (P=0.048) (Ptrend = 0.02). We repeated all analyses described above after excluding HCC cases identified through death certificates only (n=20). The results did not change materially (data not shown).
DISCUSSION
Using prospective data from a cohort of Chinese men living in a HCC high-risk region, we evaluated the relationship between prediagnostic serum levels of one-carbon metabolites and HCC risk. Our main finding was an inverse association with higher serum levels of PLP, the bioactive form of vitamin B6, and choline on HCC risk. High serum choline and PLP were associated with a statistically significant 65% and 56% decrease in HCC risk, respectively. These novel data strongly support an important role for these one-carbon metabolites in hepatocarcinogenesis. Vitamin B6 and choline should be further evaluated for their potential to protect against the development of HCC.
Data on PLP in relation to HCC risk from prior prospective studies have been lacking. Previous cross-sectional studies have consistently shown lower serum PLP levels in patients with liver cirrhosis, a precursor of HCC, than healthy individuals (27). The major concern of these prior studies was that the lower PLP levels observed among cirrhotic patients may have been the consequence of compromised liver function. In the present study, the inverse association between serum PLP and HCC risk among individuals without hepatitis B (i.e., HBsAg negative) and without a history of cirrhosis ruled out the possibility that the association was confounded by compromised liver function. Furthermore, the observed inverse PLP-HCC risk association for the development of HCC more than 10 years after blood draw further supports the notion that the association is not likely to be due to compromised liver function or other underlying conditions related to hepatocarcinogenesis.
Our finding for an inverse association with higher serum PLP levels on HCC development is consistent with recent data from large longitudinal cohort studies that showed statistically significant strong inverse associations between circulating PLP and incidence of lung cancer (28), colorectal cancer (29) and breast cancer (30). The mechanism(s) by which vitamin B6 protects against development of these cancers, and HCC in particular, is unknown. PLP-dependent enzymes are involved in over 150 biologic enzyme reactions (31) and thus PLP’s role as a co-factor likely affects numerous cellular mechanisms that may be directly or indirectly related to carcinogenesis (32). For example, PLP is a cofactor for cystathionine β-synthase and cystathionine γ-lyase in the two initial steps in the synthesis of glutathione (33), a major antioxidant and redox regulator (34). In addition, as a cofactor for serine hydroxymethyltransferase (15), PLP deficiencies may cause aberrant DNA methylation such as global hypomethylation (35) and promoter hypermethylation (36). Experimental studies are warranted to elucidate the biological mechanism(s) underlying vitamin B6’s possible protective role in hepatocarcinogenesis.
The present study, for the first time, demonstrated a statistically significant inverse association between serum choline levels and HCC risk in humans. It is well established that rodents fed choline-deficient diets spontaneously developed liver tumors (8). Methyl-deficient diets can lead to rapid fat accumulation in the liver, increased lipid peroxidation, necrotic and apoptotic cell death, increased cell proliferation, depletion of intracellular methyl pool that could lead to uracil misincorporation into DNA and DNA strand breakage (37). Additionally, feeding rats a methyl-deficient diet results in global hypomethylation of liver DNA (9) and promoter hypermethylation of tumor suppressor genes (38). Sixty-eight percent of 57 healthy adults fed a diet low in choline for up to 42 days developed fatty liver and/or liver damage (39). The findings of the present study are consistent with previous animal and human studies.
The present study showed a statistically significant positive association between serum levels of methionine and HCC risk among individuals with chronic HBV infection and/or cirrhosis. Methionine is a nutritionally indispensable amino acid with major roles in human metabolism as a substrate for protein synthesis, a methyl donor for SAM synthesis, and as a source of sulfur for the formation of cysteine and glutathione via the transsulfuration pathway (40). Rats fed methionine-deficient diets, either with or without choline spontaneously develop liver tumors (41, 42), and methionine metabolism flux is associated with development of HCC and liver disease in humans (12). Patients with cirrhosis have reduced SAM synthetase activity, thus leading to the accumulation of methionine (43). Among men with chronic hepatitis B virus and/or cirrhosis, the observed association between serum methionine and risk of HCC within a relatively short time interval after blood draw (e.g., <5 years) was stronger than the association observed with risk of HCC within a longer time interval after blood draw (e.g., ≥5 years). This result further supports the hypothesis that the liver with compromised function or underlying conditions related to HCC development could result in elevated levels of methionine. Experimental studies in humans are warranted to confirm this hypothesis.
In the present study, we showed a positive association between serum cystathionine or SAM and HCC risk. Clinical studies have shown that patients with cirrhosis had elevated serum level of SAM (44). Given the attenuation of these associations with HCC risk after adjustment for the other one-carbon metabolites, the role of cystathionine and SAM in the development of HCC may depend on other one-carbon metabolites.
Serum 5-MTHF levels did not differ between HCC cases and controls in our study, nor did we observe an association between serum total homocysteine and HCC risk. Our results of a null association between serum homocysteine and HCC risk is consistent with the findings of previous studies on any cancer (45) and specific cancers including the lung (28), prostate (46), breast (47) and pancreas (48).
During subject recruitment at baseline, blood samples were kept on ice (at ~4°C) for approximately 3 to 4 hours before serum was separated. To evaluate the potential impact of the blood collection procedures on the levels of the metabolites quantified in the present study, we conducted a study of 10 healthy individuals who each donated multiple vials of a blood sample that were each kept at room temperature and 4°C for 0, 2, 4, 6, 24, and 48 hours before their plasma was separated. PLP levels were remarkably stable, with negligible differences between measurements of plasma that was separated immediately after blood draw and those kept in either room temperature or 4°C for 4 hours. Similar results were observed for betaine, cystathionine and methionine (all changes were less than 5%). SAM levels were relatively stable with approximately 12% increase in samples with a 4-hour delay in separation. Less stable metabolites were observed for 5-MTHF with 21% decrease, homocysteine with 25% increase, and choline with 26% increase. The least stable metabolite was SAH (53% increase). For this reason, we did not include SAH in our analysis. The weak or null associations for SAM, 5-MTHF and homocysteine with HCC risk may be due in part to these variations that would have occurred to a similar degree in HCC cases and control subjects. Similarly, these variations may have also contributed to an observed association between choline levels and HCC risk that was an underestimate of the true association.
There are notable strengths and limitations of our study. The strengths of the present study included the prospective study design, allowing for the measurement of one-carbon metabolites in serum specimens collected up to 22 year prior to the clinical diagnosis of HCC. Although we cannot completely rule out the possibility that the disease progress influenced circulating one-carbon metabolite levels, our main findings for PLP and choline remained after restricting our analyses to men without chronic HBV infection or history of cirrhosis. A limitation of our study is that we only had single time-point serum specimens. If any changes in diet or lifestyle during follow up had influenced circulating one-carbon metabolite levels, these changes would result in an observed exposure-disease risk association that was biased toward the null.
In summary, we have shown that higher prediagnostic serum levels of PLP, the bioactive form of vitamin B6, and serum choline were associated with statistically significant reduced risk of HCC. These results suggest a protective role of these one-carbon metabolites in the development of HCC in humans. Future studies are warranted to confirm these novel findings in other study populations and to evaluate their potential chemopreventive effect on hepatocarcinogenesis.
Supplementary Material
Acknowledgments
We thank Ms. Xue-Li Wang of the Shanghai Cancer Institute for their assistance in data collection and management, and the staff of the Shanghai Cancer Registry for their assistance in verifying cancer diagnoses in study participants.
Grant support: This work was supported by the United States National Cancer Institute at the National Institutes of Health (grant numbers R01 CA43092 and R01 CA144034).
Footnotes
Disclosures: The authors disclose no potential conflicts of interest.
References
- 1.Jemal A, Bray F, Center MM, Ferlay J, Ward E, Forman D. Global cancer statistics. CA Cancer J Clin. 2011;61:69–90. doi: 10.3322/caac.20107. [DOI] [PubMed] [Google Scholar]
- 2.Yeh FS, Yu MC, Mo CC, Luo S, Tong MJ, Henderson BE. Hepatitis B virus, aflatoxins, and hepatocellular carcinoma in southern Guangxi, China. Cancer Res. 1989;49:2506–9. [PubMed] [Google Scholar]
- 3.Caldwell SH, Crespo DM, Kang HS, Al-Osaimi AM. Obesity and hepatocellular carcinoma. Gastroenterology. 2004;127:S97–103. doi: 10.1053/j.gastro.2004.09.021. [DOI] [PubMed] [Google Scholar]
- 4.Yuan J-M, Govindarajan S, Arakawa K, Yu MC. Synergism of alcohol, diabetes, and viral hepatitis on the risk of hepatocellular carcinoma in blacks and whites in the U.S. Cancer. 2004;101:1009–17. doi: 10.1002/cncr.20427. [DOI] [PubMed] [Google Scholar]
- 5.Donato F, Boffetta P, Puoti M. A meta-analysis of epidemiological studies on the combined effect of hepatitis B and C virus infections in causing hepatocellular carcinoma. Int J Cancer. 1998;75:347–54. doi: 10.1002/(sici)1097-0215(19980130)75:3<347::aid-ijc4>3.0.co;2-2. [DOI] [PubMed] [Google Scholar]
- 6.Das PM, Singal R. DNA methylation and cancer. J Clin Oncol. 2004;22:4632–42. doi: 10.1200/JCO.2004.07.151. [DOI] [PubMed] [Google Scholar]
- 7.Pogribny IP, James SJ, Beland FA. Molecular alterations in hepatocarcinogenesis induced by dietary methyl deficiency. Molecular nutrition & food research. 2012;56:116–25. doi: 10.1002/mnfr.201100524. [DOI] [PubMed] [Google Scholar]
- 8.Brunaud L, Alberto JM, Ayav A, Gerard P, Namour F, Antunes L, et al. Effects of vitamin B12 and folate deficiencies on DNA methylation and carcinogenesis in rat liver. Clin Chem Lab Med. 2003;41:1012–9. doi: 10.1515/CCLM.2003.155. [DOI] [PubMed] [Google Scholar]
- 9.Pogribny IP, Ross SA, Wise C, Pogribna M, Jones EA, Tryndyak VP, et al. Irreversible global DNA hypomethylation as a key step in hepatocarcinogenesis induced by dietary methyl deficiency. Mutat Res. 2006;593:80–7. doi: 10.1016/j.mrfmmm.2005.06.028. [DOI] [PubMed] [Google Scholar]
- 10.Zapisek WF, Cronin GM, Lyn-Cook BD, Poirier LA. The onset of oncogene hypomethylation in the livers of rats fed methyl-deficient, amino acid-defined diets. Carcinogenesis. 1992;13:1869–72. doi: 10.1093/carcin/13.10.1869. [DOI] [PubMed] [Google Scholar]
- 11.Christman JK, Sheikhnejad G, Dizik M, Abileah S, Wainfan E. Reversibility of changes in nucleic acid methylation and gene expression induced in rat liver by severe dietary methyl deficiency. Carcinogenesis. 1993;14:551–7. doi: 10.1093/carcin/14.4.551. [DOI] [PubMed] [Google Scholar]
- 12.Mato JM, Martinez-Chantar ML, Lu SC. Methionine metabolism and liver disease. Annu Rev Nutr. 2008;28:273–93. doi: 10.1146/annurev.nutr.28.061807.155438. [DOI] [PubMed] [Google Scholar]
- 13.Mayfield JA, Davies MW, Dimster-Denk D, Pleskac N, McCarthy S, Boydston EA, et al. Surrogate genetics and metabolic profiling for characterization of human disease alleles. Genetics. 2012;190:1309–23. doi: 10.1534/genetics.111.137471. [DOI] [PMC free article] [PubMed] [Google Scholar]
- 14.Teng YW, Mehedint MG, Garrow TA, Zeisel SH. Deletion of betaine-homocysteine S-methyltransferase in mice perturbs choline and 1-carbon metabolism, resulting in fatty liver and hepatocellular carcinomas. J Biol Chem. 2011;286:36258–67. doi: 10.1074/jbc.M111.265348. [DOI] [PMC free article] [PubMed] [Google Scholar]
- 15.Martinez M, Cuskelly GJ, Williamson J, Toth JP, Gregory JF., 3rd Vitamin B-6 deficiency in rats reduces hepatic serine hydroxymethyltransferase and cystathionine beta-synthase activities and rates of in vivo protein turnover, homocysteine remethylation and transsulfuration. J Nutr. 2000;130:1115–23. doi: 10.1093/jn/130.5.1115. [DOI] [PubMed] [Google Scholar]
- 16.Avila MA, Berasain C, Torres L, Martin-Duce A, Corrales FJ, Yang H, et al. Reduced mRNA abundance of the main enzymes involved in methionine metabolism in human liver cirrhosis and hepatocellular carcinoma. J Hepatol. 2000;33:907–14. doi: 10.1016/s0168-8278(00)80122-1. [DOI] [PubMed] [Google Scholar]
- 17.Kim J, Hong SJ, Park JH, Park SY, Kim SW, Cho EY, et al. Expression of cystathionine beta-synthase is downregulated in hepatocellular carcinoma and associated with poor prognosis. Oncol Rep. 2009;21:1449–54. doi: 10.3892/or_00000373. [DOI] [PubMed] [Google Scholar]
- 18.Bosy-Westphal A, Petersen S, Hinrichsen H, Czech N, M JM. Increased plasma homocysteine in liver cirrhosis. Hepatol Res. 2001;20:28–38. doi: 10.1016/s1386-6346(00)00119-4. [DOI] [PubMed] [Google Scholar]
- 19.Yuan J-M, Ross RK, Wang XL, Gao YT, Henderson BE, Yu MC. Morbidity and mortality in relation to cigarette smoking in Shanghai, China. A prospective male cohort study. JAMA. 1996;275:1646–50. [PubMed] [Google Scholar]
- 20.Yuan J-M, Gao YT, Ong CN, Ross RK, Yu MC. Prediagnostic level of serum retinol in relation to reduced risk of hepatocellular carcinoma. J Natl Cancer Inst. 2006;98:482–90. doi: 10.1093/jnci/djj104. [DOI] [PubMed] [Google Scholar]
- 21.Qian GS, Ross RK, Yu MC, Yuan J-M, Gao YT, Henderson BE, et al. A follow-up study of urinary markers of aflatoxin exposure and liver cancer risk in Shanghai, People’s Republic of China. Cancer Epidemiol Biomarkers Prev. 1994;3:3–10. [PubMed] [Google Scholar]
- 22.Ross RK, Yuan J-M, Yu MC, Wogan GN, Qian GS, Tu JT, et al. Urinary aflatoxin biomarkers and risk of hepatocellular carcinoma. Lancet. 1992;339:943–6. doi: 10.1016/0140-6736(92)91528-g. [DOI] [PubMed] [Google Scholar]
- 23.Ducros V, Belva-Besnet H, Casetta B, Favier A. A robust liquid chromatography tandem mass spectrometry method for total plasma homocysteine determination in clinical practice. Clin Chem Lab Med. 2006;44:987–90. doi: 10.1515/CCLM.2006.178. [DOI] [PubMed] [Google Scholar]
- 24.Midttun O, Hustad S, Solheim E, Schneede J, Ueland PM. Multianalyte quantification of vitamin B6 and B2 species in the nanomolar range in human plasma by liquid chromatography-tandem mass spectrometry. Clin Chem. 2005;51:1206–16. doi: 10.1373/clinchem.2005.051169. [DOI] [PubMed] [Google Scholar]
- 25.Inoue-Choi M, Nelson HH, Robien K, Arning E, Bottiglieri T, Koh WP, et al. One-carbon metabolism nutrient status and plasma S-adenosylmethionine concentrations in middle-aged and older Chinese in Singapore. Int J Mol Epidemiol Genet. 2012;3:160–73. [PMC free article] [PubMed] [Google Scholar]
- 26.Yuan J-M, Ross RK, Stanczyk FZ, Govindarajan S, Gao YT, Henderson BE, et al. A cohort study of serum testosterone and hepatocellular carcinoma in Shanghai, China. Int J Cancer. 1995;63:491–3. doi: 10.1002/ijc.2910630405. [DOI] [PubMed] [Google Scholar]
- 27.Merrill AH, Jr, Henderson JM. Vitamin B6 metabolism by human liver. Ann N Y Acad Sci. 1990;585:110–7. doi: 10.1111/j.1749-6632.1990.tb28047.x. [DOI] [PubMed] [Google Scholar]
- 28.Johansson M, Relton C, Ueland PM, Vollset SE, Midttun O, Nygard O, et al. Serum B vitamin levels and risk of lung cancer. JAMA. 2010;303:2377–85. doi: 10.1001/jama.2010.808. [DOI] [PubMed] [Google Scholar]
- 29.Larsson SC, Orsini N, Wolk A. Vitamin B6 and risk of colorectal cancer: a meta-analysis of prospective studies. JAMA. 2010;303:1077–83. doi: 10.1001/jama.2010.263. [DOI] [PubMed] [Google Scholar]
- 30.Lurie G, Wilkens LR, Shvetsov YB, Ollberding NJ, Franke AA, Henderson BE, et al. Prediagnostic plasma pyridoxal 5’-phosphate (vitamin b6) levels and invasive breast carcinoma risk: the multiethnic cohort. Cancer Epidemiol Biomarkers Prev. 2012;21:1942–8. doi: 10.1158/1055-9965.EPI-12-0717-T. [DOI] [PMC free article] [PubMed] [Google Scholar]
- 31.Swiss Institute of Bioinformatics. ENZYME. [May 10, 2013];Enzyme nomenclature database. Release as of May 01, 2013. http://enzyme.expasy.org/
- 32.Choi SW, Friso S. Vitamins b6 and cancer. Subcell Biochem. 2012;56:247–64. doi: 10.1007/978-94-007-2199-9_13. [DOI] [PubMed] [Google Scholar]
- 33.Corrales FJ, Ruiz F, Mato JM. In vivo regulation by glutathione of methionine adenosyltransferase S-nitrosylation in rat liver. J Hepatol. 1999;31:887–94. doi: 10.1016/s0168-8278(99)80291-8. [DOI] [PubMed] [Google Scholar]
- 34.Yuan L, Kaplowitz N. Glutathione in liver diseases and hepatotoxicity. Mol Aspects Med. 2009;30:29–41. doi: 10.1016/j.mam.2008.08.003. [DOI] [PubMed] [Google Scholar]
- 35.Figueiredo JC, Grau MV, Wallace K, Levine AJ, Shen L, Hamdan R, et al. Global DNA hypomethylation (LINE-1) in the normal colon and lifestyle characteristics and dietary and genetic factors. Cancer Epidemiol Biomarkers Prev. 2009;18:1041–9. doi: 10.1158/1055-9965.EPI-08-0926. [DOI] [PMC free article] [PubMed] [Google Scholar]
- 36.de Vogel S, Bongaerts BW, Wouters KA, Kester AD, Schouten LJ, de Goeij AF, et al. Associations of dietary methyl donor intake with MLH1 promoter hypermethylation and related molecular phenotypes in sporadic colorectal cancer. Carcinogenesis. 2008;29:1765–73. doi: 10.1093/carcin/bgn074. [DOI] [PubMed] [Google Scholar]
- 37.James SJ, Pogribny IP, Pogribna M, Miller BJ, Jernigan S, Melnyk S. Mechanisms of DNA damage, DNA hypomethylation, and tumor progression in the folate/methyl-deficient rat model of hepatocarcinogenesis. J Nutr. 2003;133:3740S–7S. doi: 10.1093/jn/133.11.3740S. [DOI] [PubMed] [Google Scholar]
- 38.Herath NI, Leggett BA, MacDonald GA. Review of genetic and epigenetic alterations in hepatocarcinogenesis. J Gastroenterol Hepatol. 2006;21:15–21. doi: 10.1111/j.1440-1746.2005.04043.x. [DOI] [PubMed] [Google Scholar]
- 39.Fischer LM, daCosta KA, Kwock L, Stewart PW, Lu TS, Stabler SP, et al. Sex and menopausal status influence human dietary requirements for the nutrient choline. Am J Clin Nutr. 2007;85:1275–85. doi: 10.1093/ajcn/85.5.1275. [DOI] [PMC free article] [PubMed] [Google Scholar]
- 40.Mato JM, Corrales FJ, Lu SC, Avila MA. S-Adenosylmethionine: a control switch that regulates liver function. FASEB J. 2002;16:15–26. doi: 10.1096/fj.01-0401rev. [DOI] [PubMed] [Google Scholar]
- 41.Sawada N, Poirier L, Moran S, Xu YH, Pitot HC. The effect of choline and methionine deficiencies on the number and volume percentage of altered hepatic foci in the presence or absence of diethylnitrosamine initiation in rat liver. Carcinogenesis. 1990;11:273–81. doi: 10.1093/carcin/11.2.273. [DOI] [PubMed] [Google Scholar]
- 42.Ghoshal AK, Farber E. The induction of liver cancer by dietary deficiency of choline and methionine without added carcinogens. Carcinogenesis. 1984;5:1367–70. doi: 10.1093/carcin/5.10.1367. [DOI] [PubMed] [Google Scholar]
- 43.Duce AM, Ortiz P, Cabrero C, Mato JM. S-adenosyl-L-methionine synthetase and phospholipid methyltransferase are inhibited in human cirrhosis. Hepatology. 1988;8:65–8. doi: 10.1002/hep.1840080113. [DOI] [PubMed] [Google Scholar]
- 44.Medici V, Peerson JM, Stabler SP, French SW, Gregory JF, 3rd, Virata MC, et al. Impaired homocysteine transsulfuration is an indicator of alcoholic liver disease. J Hepatol. 2010;53:551–7. doi: 10.1016/j.jhep.2010.03.029. [DOI] [PMC free article] [PubMed] [Google Scholar]
- 45.Zacho J, Yazdanyar S, Bojesen SE, Tybjaerg-Hansen A, Nordestgaard BG. Hyperhomocysteinemia, methylenetetrahydrofolate reductase c.677C>T polymorphism and risk of cancer: cross-sectional and prospective studies and meta-analyses of 75,000 cases and 93,000 controls. Int J Cancer. 2011;128:644–52. doi: 10.1002/ijc.25375. [DOI] [PubMed] [Google Scholar]
- 46.Weinstein SJ, Hartman TJ, Stolzenberg-Solomon R, Pietinen P, Barrett MJ, Taylor PR, et al. Null association between prostate cancer and serum folate, vitamin B(6), vitamin B(12), and homocysteine. Cancer Epidemiol Biomarkers Prev. 2003;12:1271–2. [PubMed] [Google Scholar]
- 47.Zhang SM, Willett WC, Selhub J, Hunter DJ, Giovannucci EL, Holmes MD, et al. Plasma folate, vitamin B6, vitamin B12, homocysteine, and risk of breast cancer. J Natl Cancer Inst. 2003;95:373–80. doi: 10.1093/jnci/95.5.373. [DOI] [PubMed] [Google Scholar]
- 48.Schernhammer E, Wolpin B, Rifai N, Cochrane B, Manson JA, Ma J, et al. Plasma folate, vitamin B6, vitamin B12, and homocysteine and pancreatic cancer risk in four large cohorts. Cancer Res. 2007;67:5553–60. doi: 10.1158/0008-5472.CAN-06-4463. [DOI] [PubMed] [Google Scholar]
Associated Data
This section collects any data citations, data availability statements, or supplementary materials included in this article.