Abstract
Objectives
Collagen fiber content and orientation affect the viscoelastic properties of the vocal folds, determining oscillation characteristics during speech and other vocalization. The investigation and reconstruction of the collagen network in vocal folds remains a challenge, because the collagen network requires at least micron-scale resolution. In this study, we used polarized light microscopy to investigate the distribution and alignment of collagen fibers within the vocal folds.
Methods
Data were collected in sections of human and rhesus monkey (Macaca mulatta) vocal folds cut at 3 different angles and stained with picrosirius red.
Results
Statistically significant differences were found between different section angles, implying that more than one section angle is required to capture the network’s complexity. In the human vocal folds, the collagen fiber distribution continuously varied across the lamina propria (medial to lateral). Distinct differences in birefringence distribution were observed between the species. For the human vocal folds, high birefringence was observed near the thyroarytenoid muscle and near the epithelium. However, in the rhesus monkey vocal folds, high birefringence was observed near the epithelium, and lower birefringence was seen near the thyroarytenoid muscle.
Conclusions
The differences between the collagen networks in human and rhesus monkey vocal folds provide a morphological basis for differences in viscoelastic properties between species.
Keywords: collagen fiber, fiber orientation, lamina propria
INTRODUCTION
The microscale orientation of collagen fibers affects the macroscale mechanical properties and functional morphology of the vocal folds.1,2 Detailed knowledge of collagen fiber alignment may allow more effective reconstruction of damaged vocal fold tissue and aid in our understanding of normal and abnormal physiological changes within the vocal folds across the life span. However, the reconstruction of the 3-dimensional morphology of collagen fibers remains a challenge, because the vocal folds are relatively large in comparison with micron-scale collagen fibers.
The layered structure of the vocal folds (Fig 1A) is an adaptation that is important in producing sounds of different frequencies, amplitudes, and spectral contents.3,4 Variable amounts of vocal fold tissue are drawn into oscillation, depending on the vocal fold tension and the magnitude of the lung pressure applied, thereby creating sounds of different quality.4,5 Collagen fiber orientation is one important component determining the mechanical properties of the lamina propria, which in turn affects shape, flexibility, and dynamic factors such as impact stress.6,7 Differences in material properties affect the quality of voicing, contribute to vocal differences between individuals and species, and contribute to vocal changes with age.1,3,4,8
Fig 1.
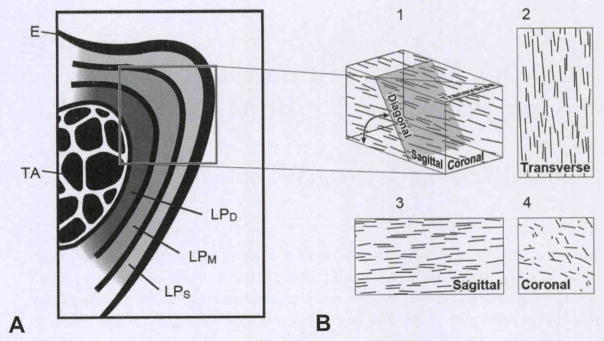
Schematic illustrations of vocal fold. A) Coronal view of vocal fold indicates 3 layers of lamina propria, epithelium (E), and thyroarytenoid muscle (TA). Different lamina propria layers are characterized by specific proportions of collagen, elastin, and hyaluronan, as well as different fiber orientation. B) Depending on sectioning angle, collagen fibers are cut along their longitudinal axis or in cross section. In current investigation, we used transverse, coronal, and “diagonal” section angles. Diagonal section lies at 45° angle between coronal and transverse planes. LPS — superficial layer of lamina propria; LPM — medial layer of lamina propria; LPD — deep layer of lamina propria.
Various techniques allow investigation of the collagen fiber orientation in the lamina propria. Scanning electron microscopy (SEM) can be used to obtain high-magnification (approximately 1,000×) images of individual collagen fibers and fiber bundles. However, the cost and the labor-intensive nature of this approach prevent sampling at a large number of points across multiple tissue samples. The collagen fiber orientation in the lamina propria has been considered to be in the anterior-posterior direction on the basis of SEM studies,6,9 as well as light microscopy studies.7,10 However, these studies were qualitative in nature. The phrase “primarily oriented in the anterior-posterior direction” provides insufficient information about the degree of alignment. An alternative to SEM is histologic staining, which is a simple, cost-effective method of quantifying the amount of collagen in vocal fold tissue. This provides quantitative data on collagen density and allows analysis of multiple vocal fold samples.3 However, quantitative information about the collagen fiber orientation is not fully accessible with routine histology.
Picrosirius-stained polarized light microscopy (PPLM) uses standard picrosirius-stained slides, multiple images of which are captured under a circular polarized light.11–13 An automated system for analyzing these images14,15 enables the collection of large amounts of data (millions of data points) regarding collagen fiber orientation and tissue birefringence. The drawback of PPLM is that it provides a 2-dimensional projection of the 3-dimensional collagen fiber orientation (Fig 1B). Theoretically, fibers oriented perpendicular to the section plane (plane of observation) will be difficult to detect. This effect is illustrated in Fig 1B, which shows various projections resulting from a representative section of tissue. The observed birefringence (depicting fiber content and orientation) and angular deviation (depicting fiber orientation) can both change dramatically, depending on the tissue section angle. In Fig 1B, the sagittal and transverse sections would provide large values for fiber content and orientation, whereas an analysis of the coronal section would provide very small values for fiber orientation and probably also smaller values for fiber content. Although PPLM has been previously used to study vocal fold tissue, relationships among fiber content, fiber orientation, and section angle have not been investigated.
The purpose of this study was threefold. First, we meant to investigate the effect of section angle on birefringence (collagen orientation and content) and angular deviation (collagen orientation). On the basis of prior research,9,12 we expected that birefringence would be substantially higher in transverse sections than in coronal sections and that intermediate values would be observed for intermediate angles (Fig 1B). Second, we wanted to quantify the degree of alignment of collagen fibers within the lamina propria. The need for such work has been recommended in prior studies.1 Third, we sought to determine patterns of collagen fiber orientation within the lamina propria, thus improving upon the localized results reported in prior studies. To accomplish these objectives, we applied PPLM to human and rhesus monkey (Macaca mulatta) vocal folds. For the human vocal folds, we expected a primary collagen orientation in the anterior-posterior direction and an increasing fiber organization from medial to lateral, according to earlier studies.7,9
MATERIALS AND METHODS
Sample Preparation and Visualization
Three human larynges (60 to 66 years of age) were obtained through the National Human Tissue Resource Center (Philadelphia, Pennsylvania). Tissue was collected within 24 hours after death and was frozen in saline solution and kept at −30°C until the experiment. Four male rhesus monkey (Macaca mulatta, Zimmermann 1780) larynges were procured through the Wisconsin National Primate Research Center (WNPRC, Nonhuman Primate Tissue Distribution Program, Madison, Wisconsin). The tissue had been collected immediately after the animal was sacrificed. The tissue had been quickly frozen in saline solution in liquid nitrogen and kept at −30°C until the experiment.
After thawing the tissue over a 24-hour period, we fixed the whole larynx in 10% buffered formalin phosphate (SF100-4; Fisher Scientific, Waltham, Massachusetts). The vocal fold tissue was fixed in situ before it was dissected from the larynx. The vocal fold’s free edge and its anterior-posterior orientation were identified before dissection and used for orientation during the paraffin embedding. Three sectioning angles were used in this study: transverse, diagonal, and coronal. “Transverse” refers to a horizontal plane that divides the body into superior and inferior parts, “coronal” refers to a vertical plane that divides the body into ventral and dorsal parts, and “diagonal” refers to a plane oriented at 45° to both these planes. Bisecting the vocal folds allowed sectioning at at least one of these angles. Sectioning the vocal folds at 1 or 2 angles resulted in 4 tissue samples for each angle and for each species. The tissue samples were sectioned at 5-μm thickness and stained with picrosirius red (Polysciences, Inc, Warrington, Pennsylvania).
Image Analysis
In this study, a modified Metripol circular polarized light microscope was used as described in prior studies.14,15 All data presented in this paper were obtained from the lamina propria regions of each image. All images were thresholded to remove background (non-collagen) information. Birefringence is a function of the sample thickness, difference in refractive indices, and wavelength of the light, where highly oriented fibers and/or a high collagen content will lead to higher birefringence.12 The resulting data consisted of more than 33 million individual values of collagen birefringence (range, 0 to 1) and an equal number of angular orientation values (range, 0° to 180°).
The variance of collagen orientation data in each section angle was used to quantify the degree of alignment. However, because typical definitions of variance are not applicable to angular measurements, angular deviation was used as a measure of angular variance.16 The Metripol system presents alignment values in the range 0° to 180°. However, angular deviation methods are based on a range of 0° to 360°.17 A conversion factor was applied to the Metripol angular values, and the unitless angular deviation value was converted to degrees by the same conversion factor. Under this methodology, the maximum possible angular deviation is 0.707 radians, or 40.5°. Highly organized tissue would be expected to exhibit low variation in the orientation data, resulting in a low angular deviation. The angular deviation was calculated for each of the images taken from each section angle. (Three images were taken for each tissue section, and 3 tissue sections were analyzed for each tissue sample.) Because previous studies suggested that collagen fibers are highly aligned in the anterior-posterior direction and poorly aligned perpendicular to this direction, we expected to find significantly lower variance in transverse sections as compared to coronal sections. Birefringence data were used to create relative frequency histograms for each section angle and each species. The hypothesis of higher birefringence in transverse versus diagonal versus coronal section angles was tested by performing 1-way analysis of variance and Tamhane’s post hoc tests to determine the significance (p < 0.05) of the mean values (SPSS statistics 19).
Coronal and diagonal sections were used to examine the distribution of birefringence and angular deviation values across the lamina propria. To allow comparison between regions having different lamina propria thicknesses, we normalized spatial locations of birefringence and angular orientation data points such that d = 0 represented the vocal fold epithelium–lamina propria boundary and d = 1 represented the thyroarytenoid muscle–lamina propria boundary (Fig 2).
Fig 2.
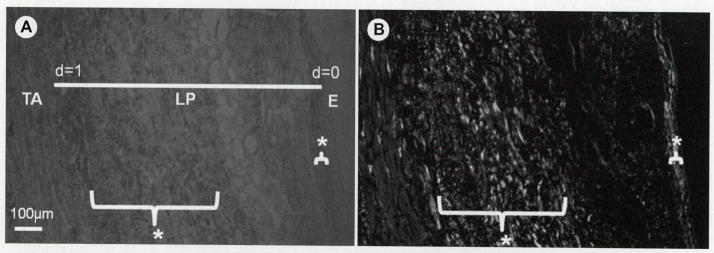
A) Coronal section of human vocal fold observed under circularly polarized light. TA — thyroarytenoid muscle; LP — lamina propria; E — epithelial layer; d — normalized depth of LP; d=0 — E/LP boundary; d=1 — TA/LP boundary. B) Birefringence values of image in A obtained from Metripol system, where white indicates strong birefringence. Bracketed areas and asterisks indicate regions with high birefringence within LP.
RESULTS
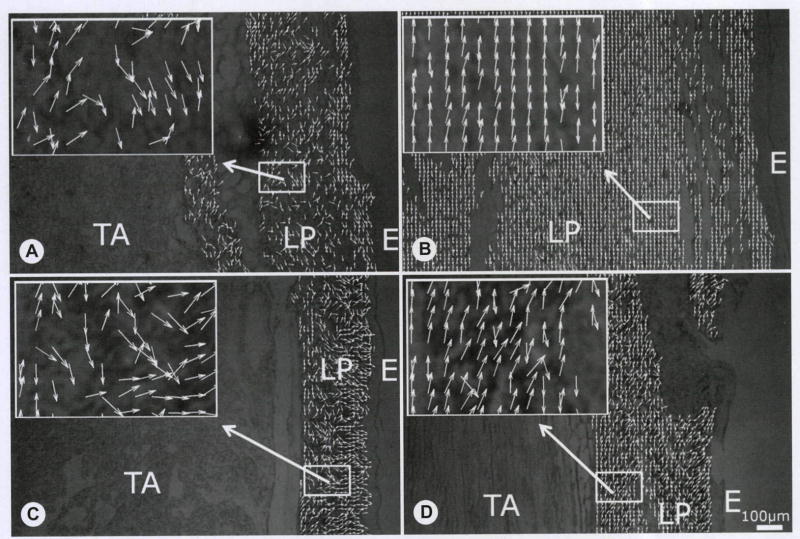
Figure 3 provides an example of the collagen orientation data collected in this study, with collagen orientation indicated by small arrows superimposed onto tissues collected in the coronal and transverse planes for human and rhesus monkey tissues. In order to preserve clarity, we show only one eighth of the collagen orientation arrows. Randomized collagen orientation was frequently observed in the coronal sections, whereas the collagen orientation in the transverse sections tended to be somewhat more organized. The distributions of all fiber orientation data from the images of Fig 3 are presented in Fig 4. The high degree of fiber alignment observed in the human transverse slide (Fig 3B) is represented by a low angular deviation in Fig 4A. In contrast, the human coronal slide (Fig 3A) has a much higher angular deviation in Fig 4A. This pattern represents the type and magnitude of differences that were expected on the basis of prior research, with the angular deviation of the transverse section being 68% lower than that of the coronal section.
Fig 3.
Coronal (A,C) and transverse (B,D) sections of human (A,B) and rhesus monkey (C,D) vocal folds. Fiber orientation is indicated by arrows. Coronal sections showed more randomized orientation. TA — thyroarytenoid muscle; LP — lamina propria; E — epithelial layer. For purposes of clarity, only one eighth of orientation arrows are shown. Insets) Boxed regions at magnification 4 times that of original.
Fig 4.

Distributions of fiber orientation for data of Fig 3 for both human (A) and rhesus monkey (B) samples. Narrow distribution indicates smaller angular deviation (AD). AD of zero indicates perfectly aligned fibers. At 40.5°, fibers are completely randomized.
For testing the hypothesis that lower angular deviations would be obtained in both diagonal and transverse sections, Tamhane’s post hoc test was used to determine whether differences existed between sectioning angles. In both humans and rhesus monkeys, the angular deviation of the transverse sections was significantly lower (N = 36; p < 0.05) than the angular deviation of the diagonal and coronal sections (Fig 5). However, no significant difference was observed between the angular deviations of the diagonal and coronal sections for either species (N = 36; p = 0.222 and p = 0.835). The angular deviation of the human samples was found to be lower than that of the rhesus monkey samples in all cases. This finding suggests that the collagen fibers within human vocal folds are organized differently from those in rhesus monkey vocal folds.
Fig 5.
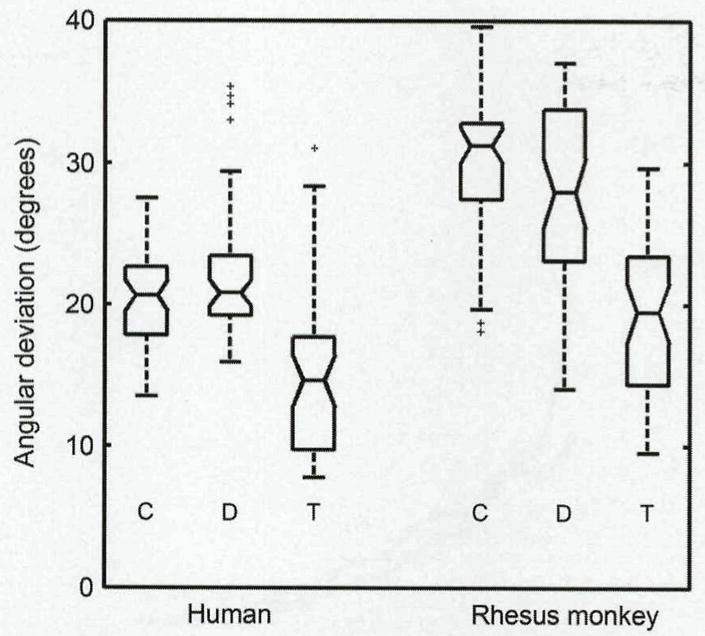
Box plot depicts distribution of angular deviation values for each sectioning angle. In both human and rhesus monkey samples, transverse (T) sections had significantly smaller angular deviation than did diagonal (D) and coronal (C) sections (p < 0.05). No significant differences were seen between diagonal and coronal sections (p = 0.222 and p = 0.835). Rhesus monkey samples had significantly higher angular deviation, in all respective sectioning angles, than did human samples (p < 0.05). Angular deviation of zero indicates perfectly aligned fibers. At 40.5°, fibers are completely randomized. Midlines within boxes indicate median value, notches indicate standard error, and box edges indicate 25th and 75th percentiles. Whiskers cover 99% of data, whereas plus symbols represent outliers.
Birefringence Levels
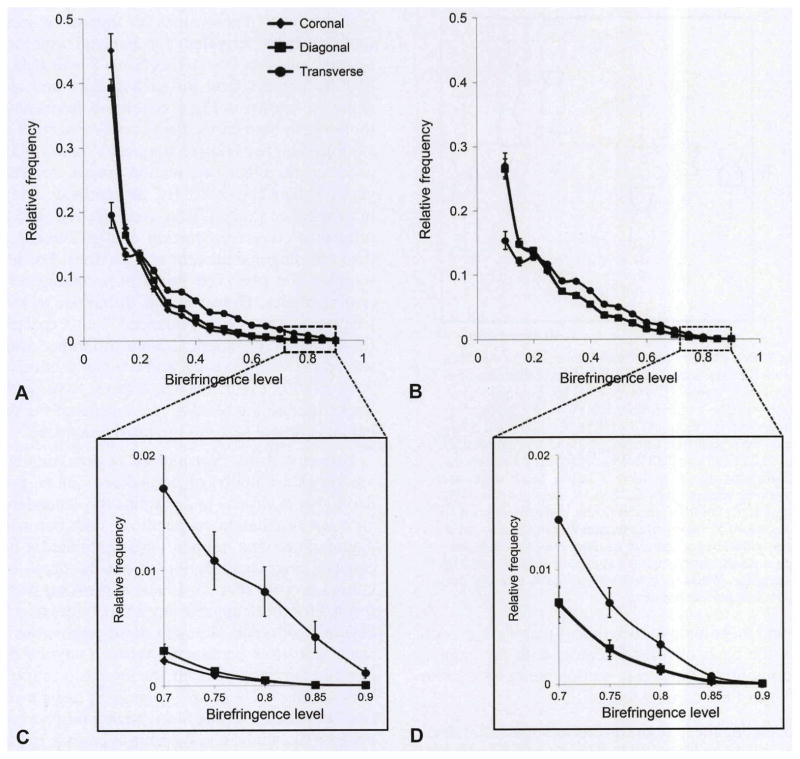
As mentioned above, fibers perpendicular (or nearly perpendicular) to the sectioning angle are expected to have a reduced projection as compared to fibers oriented parallel to the sectioning angle. As a consequence, we expected higher birefringence values for transverse sections, moderately higher values for diagonal sections, and lowest values for coronal sections. The distributions of birefringence data for each species and section angle are shown in Fig 6 as relative frequency histograms. In both cases, the transverse section angle exhibited higher relative frequency values than did either of the other two section angles for birefringence values above 0.2 (ie, all moderate and high birefringence values). Transverse sections had a significantly greater proportion of high birefringence than did diagonal and coronal sections. For human samples, we observed differences among all sectioning angles. However, this difference in relative frequency was less pronounced than expected. In rhesus monkeys, no significant difference was observed between diagonal and coronal sections (N = 36; p > 0.99). Figure 6B thus appears to show only 2 lines, because the relative frequencies of the diagonal and coronal sections are nearly identical.
Fig 6.
Relative frequency (mean ± standard error) of different birefringence levels within human (A,C) and rhesus monkey (B,D) vocal folds sectioned at different sectioning angles. C and D are zoomed-in regions at higher birefringence levels. In both species, transverse sections had higher relative frequency of birefringence level above 0.2. Significant difference was observed between all sectioning angles in human samples (p < 0.05). In rhesus monkey samples, no significant difference was observed between diagonal and coronal sections (p > 0.99).
Variation Along Normalized Depth
Angular deviation as a function of normalized lamina propria depth was examined to determine the dependence of collagen orientation on depth. In both coronal and diagonal sections, human tissue exhibited a nearly constant angular deviation across the depth of the lamina propria (Fig 7). Linear regression was performed for mean angular deviation values as a function of depth, and although these regressions indicated a positive correlation between angular deviation and normalized depth, the regression curves exhibited only a 7% to 16% change in angular deviation between the epithelium–lamina propria boundary (d = 0) and the lamina propria–muscle boundary (d = 1). The highest alignment was found near the epithelium, whereas the region near the muscle was less organized. Thus, contrary to our expectations, the degree of alignment actually decreased slightly with increasing depth into the lamina propria. The rhesus monkey tissue exhibited the opposite pattern, with the highest organization near the muscle, low organization near the epithelium, and much larger differences across the thickness of the lamina propria. (The maximum angular deviation was nearly twice the lowest angular deviation values.)
Fig 7.
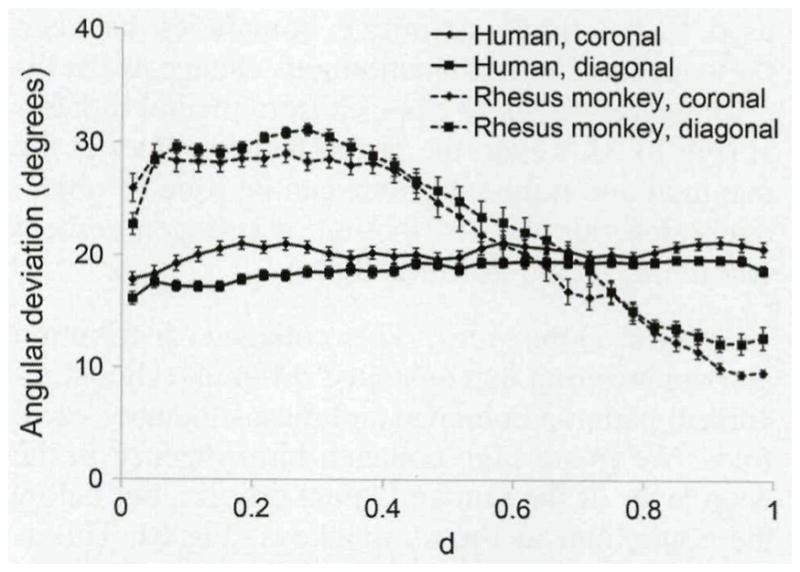
Mean (±SD) angular deviations at various depths within lamina propria. Fiber organization was more consistent throughout thickness of human samples. In rhesus monkey samples, fibers were much more disorganized closer to epithelial layer. Angular deviation of zero indicates perfectly aligned fibers. At 40.5°, fibers are completely randomized. TA — thyroarytenoid muscle; LP — lamina propria; E — epithelial layer; d — normalized depth of LP; d=0 — E/LP boundary; d=l — TA/LP boundary.
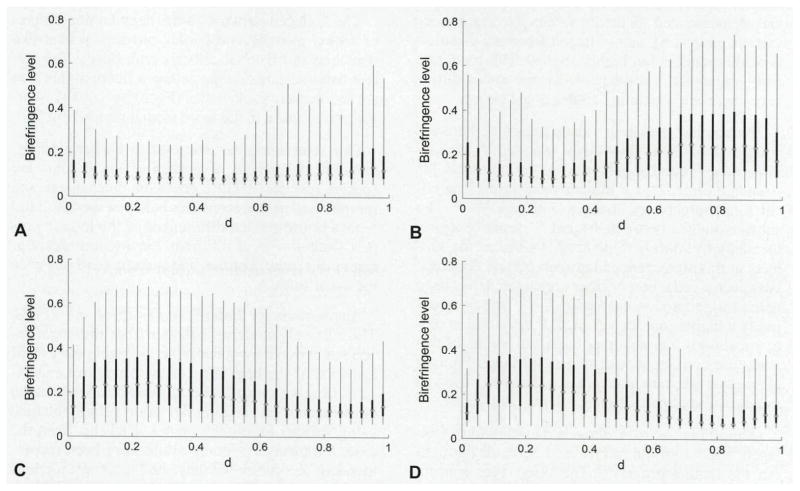
On the basis of prior research, we expected that the birefringence values of the human samples would increase with normalized depth, because a higher collagen content has been reported in the deep layer close to the muscle.7 The distributions of birefringence levels at the normalized lamina propria depth values are shown for coronal and diagonal section angles of a single individual in Fig 8. These distributions are representative of a distinct pattern observed in all samples. A narrow birefringence peak was typically observed in the region 0 < d < 0.15. This region is usually referred to as the superficial layer (Fig 2). A trough region was also observed, with a minimum value typically occurring in the range 0.15 < d < 0.50. Beyond d = 0.5, birefringence values typically rise gradually to a peak located near the boundary between muscle and lamina propria. The relative locations and height of peaks and minimum birefringence values relative to the minimum value are summarized in the Table. The birefringence signals varied somewhat from one individual to another, but generally followed the pattern shown in Fig 8. One individual exhibited a region of high birefringence in the range of 0.35 to 0.5, but this appeared to be an anomaly.
Fig 8.
Distribution of collagen birefringence observed in coronal (A,C) and diagonal (B,D) sections at various depths within lamina propria of human (A,B) and rhesus monkey (C,D) vocal folds. Human samples had pattern very different from rhesus monkey samples in terms of birefringence level throughout thickness; ie, rhesus monkey samples had high birefringence level closer to epithelial layer, whereas in human samples, high birefringence was mostly at region closer to muscle. TA — thyroarytenoid muscle; LP — lamina propria; E — epithelial layer; d — normalized depth of LP; d=0 — E/LP boundary; d=1 — TA/LP boundary.
TABLE 1.
LOCATIONS (NORMALIZED DEPTH) AND NORMALIZED BIREFRINGENCE LEVELS OF PEAKS IDENTIFIED IN MEAN BIREFRINGENCE CURVES ACROSS DEPTH OF HUMAN LAMINA PROPRIA
| Superficial Layer | Intermediate Layer | Deep Layer | |
|---|---|---|---|
| Birefringence | Maximum | Minimum | Maximum |
| Location (d) | 0.031 ± 0.018 | 0.297 ± 0.099 | 0.913 ± 0.087 |
| Normalized birefringence* | 1.731 ± 0.238 | 1 | 1.839 ± 0.457 |
Values are mean ± standard deviation.
Birefringence level normalized against each sample’s minimum birefringence level, which was found mostly in intermediate region. Average minimum birefringence level (shown as “1”) was 0.0986 ± 0.014.
Surprisingly, the pattern described above was found to be reversed for the rhesus monkey samples. The collagen content was commonly lower in the region 0.60 < d < 1.0 because of fat pockets in the area close to the thyroarytenoid muscle. Unlike in human samples, a difference between coronal and diagonal sections was not apparent.
DISCUSSION
The results presented here provide a description of collagen content and organization within the lamina propria for human and rhesus monkey vocal folds. Several findings contribute to our understanding of the microscale vocal fold morphology in the two species.
Sectioning Angle
One purpose of this study was to examine the effect of section angle on collagen alignment and birefringence data. Two parameters were determined: birefringence and angular deviation. Birefringence describes fiber organization and fiber content, and angular deviation describes only fiber organization.12,18 Two extreme cases — perfectly random collagen fibers and perfectly aligned collagen fibers — may be used to help visualize the relationships among section angle, collagen fiber content and alignment, and the two parameters. In the case of random distribution, the angular deviation will show no differences in different section angles, and will take on a maximum value of 40.5°.17 Birefringence levels would also be uniform in all section angles. In the case of aligned distribution, the angular deviation would be near zero when the section angle is aligned with the collagen fibers, and it would reach a maximum (40.5°) when the section angles are perpendicular to the fiber orientation. Similarly, the birefringence would be maximum when the section angle is aligned with the collagen fibers, and it would be minimum for section angles perpendicular to the fiber orientation.
For the human vocal folds, the median angular deviation was statistically (p < 0.05) lower in transverse sections (14.7°) than in coronal (20.6°) or diagonal (20.8°) sections (Fig 5). However, the substantial overlap between these distributions indicates a substantial amount of similarity between the section angles. A similar pattern was found in the rhesus monkey vocal folds. The angular deviation was lower in transverse (19.4°) sections than in coronal (31.2°) and diagonal (27.9°) sections. For both species, the birefringence values were typically higher in the transverse sections (Fig 6).
The data support prior reports that the overall collagen fiber orientation was in the anterior-posterior direction.9,19 However, the prior studies did not quantify the variation of collagen fiber orientation, which is presented here. The vocal folds of both species demonstrated moderate values for angular deviation, indicating that collagen fiber organization is neither random nor highly aligned. This moderate fiber alignment is responsible for the minor differences between sectioning angles noted above.
The angular deviation values presented here are smaller than those previously reported.18 Muñoz-Pinto et al18 found angular deviations of around 28° (standard error, 2°) for human vocal folds. The vocal fold morphology changes with age.2,6,7,20 The subjects ranged between 40 and 57 years of age in the study by Muñoz-Pinto et al,18 whereas the subjects in this study ranged between 60 and 66 years. However, a reduction of fiber organization has been noted for geriatric vocal folds,7,10,20,21 which would imply a higher (not lower) angular deviation in older vocal folds. On the other hand, the results of this study are consistent with those of Muñoz-Pinto et al18 in that constant angular deviation was observed as a function of medial-lateral depth (Fig 7).
Quantification of Collagen Distribution
Collagen fibers form an intertwined network throughout the lamina propria.22 The three-layer concept suggests that the lamina propria can be differentiated into superficial, intermediate, and deep layers2,6,7,9,10,18,21–23 according to collagen orientation and content. The data presented here indicate that neither collagen distribution nor alignment can be used to determine definitive boundaries between these layers. There is a continuous change as the birefringence gradually changes from medial to lateral (Fig 8). However, the birefringence values at the maximal and minimal points can be used to objectively describe the distribution of collagen content within the vocal folds (see Table).
Species Differences
The collagen distribution and organization demonstrated different (almost reversed) patterns in human and rhesus monkey vocal folds. We found high collagen birefringence in the deep layer of the human lamina propria, but below the epithelium in rhesus monkeys (Fig 8). This is most likely due to use-related differences. The mucosal wave is critical for normal human speech and depends on the organization of extracellular matrix below the epithelium.24 In contrast, vocalizations in rhesus monkeys encompass loud utterances (eg, screams and barks), which are likely associated with large-amplitude vocal fold oscillations. A similar densely packed lamina propria below the epithelium was also described in the vocal folds of lions and tigers,25 two species that are well known for loud and powerful vocalizations that engage the vocal folds in large-amplitude oscillations.
The collagen network in the deep lamina propria of rhesus monkey vocal folds provides pocket-like structures in which fat cells are embedded.4 The current data indicate that the collagen fibers in this area are less densely packed than (Fig 8) but equally as organized as those in the more medial region (Fig 7).
Our morphological data add to earlier findings that the mechanical properties of vocal folds are species-specific.26 Differences in mechanical and morphological characteristics between species could represent use-related differences of the lamina propria structure,6,27 as different vocal repertoires represent different qualities and quantities of stress to the vocal folds.
Suggestions for Future Studies Involving PPLM
The relatively moderate collagen fiber alignment described above may actually be favorable for PPLM analysis. At the beginning of this study, we expected to observe much higher differences between the birefringence and angular deviation values obtained using various sectioning angles. Had this been the case, a transverse section would have been recommended for future studies, and coronal sections would be an inappropriate choice for using PPLM. Although coronal sections are approximately perpendicular to the primary orientation of collagen fibers, these sections can be effectively used to examine collagen distribution because of the moderate alignment of collagen fibers within the vocal folds.
The reconstruction of the 3-dimensional collagen network remains a challenge because of the necessity for high resolution and the relatively large size of the vocal fold. Speer and Dahners summarized the problem: “… SEM and TEM [transmission electron microscopy] directly visualize bits and pieces of the trees in a forest. PLM [picrosirius light microscopy] on the other hand provides high resolution of the whole forest.”13(p274) Picrosirius-stained polarized light microscopy provides additional features. It can be used to determine the distribution of collagen types I and III. However, it is necessary to complement the study with immunohistochemical techniques. It has been noted by previous users18,28 that using fiber hue to distinguish collagen type distribution is not sufficient. Green fibers may not necessarily be type III (thinner fibers). Artifacts due to smearing or immature fibers may cause thick fibers (type I) to show up as green, leading to possible misidentification.
Finally, anyone studying the vocal fold collagen network must consider the relationship between fiber orientation and tissue strain. Collagen fibers align differently in relaxed tissues and strained tissues. In the current study, the vocal folds were formalin-fixed while still positioned within the larynx. The vocal folds within the laryngeal cartilaginous framework are under a certain preexisting strain — about 10% to 15% in humans3 and up to 20% in rhesus monkeys.4 The investigation of collagen fibers under different strains can reveal how strain affects the whole collagen network.
CONCLUSIONS
The degree of collagen fiber organization within the lamina propria can best be described as moderate. Collagen fiber organization was found to be relatively constant across the thickness of the lamina propria for human samples. Because of collagen’s moderate organization, PPLM demonstrates differences between sectioning angles in both birefringence and fiber orientation. Use of more than one sectioning angle is suggested for future studies to fully capture important aspects of the collagen network. The collagen networks of vocal folds of humans and rhesus monkeys are different, providing a morphological basis for the differences in viscoelastic properties and vocal production.
Acknowledgments
Funding for this work was provided in part by National Institutes of Health grants R01 DC008612 (A Simulator for Sound Production in Airways; principal investigator, Ingo R. Titze) and R01 DC04390. This publication was also made possible in part by grant P51 RR000167 from the National Center for Research Resources, a component of the National Institutes of Health, to the Wisconsin National Primate Research Center, University of Wisconsin–Madison. Use of human tissues was provided by the National Disease Research Interchange, with support from National Institutes of Health grant 5 U42 RR006042.
The authors are grateful to Dr Bart Kahr (New York University, New York, New York) for allowing access to the Metripol system. The authors also acknowledge the initial staining contribution of Dr Jeffrey Wolchok (previously at National Center for Voice and Speech, Salt Lake City, Utah).
References
- 1.Gray SD, Titze IR, Alipour F, Hammond TH. Biomechanical and histologic observations of vocal fold fibrous proteins. Ann Otol Rhinol Laryngol. 2000;109:77–85. doi: 10.1177/000348940010900115. [DOI] [PubMed] [Google Scholar]
- 2.Hammond TH, Gray SD, Butler JE. Age- and gender-related collagen distribution in human vocal folds. Ann Otol Rhinol Laryngol. 2000;109:913–20. doi: 10.1177/000348940010901004. [DOI] [PubMed] [Google Scholar]
- 3.Chan R, Fu M, Young L, Tirunagari N. Relative contributions of collagen and elastin to elasticity of the vocal fold under tension. Ann Biomed Eng. 2007;35:1471–83. doi: 10.1007/s10439-007-9314-x. [DOI] [PubMed] [Google Scholar]
- 4.Riede T. Elasticity and stress relaxation of rhesus monkey (Macaca mulatta) vocal folds. J Exp Biol. 2010;213:2924–32. doi: 10.1242/jeb.044404. [DOI] [PMC free article] [PubMed] [Google Scholar]
- 5.Riede T, Lingle S, Hunter EJ, Titze IR. Cervids with different vocal behavior demonstrate different viscoelastic properties of their vocal folds. J Morphol. 2010;271:1–11. doi: 10.1002/jmor.10774. [DOI] [PMC free article] [PubMed] [Google Scholar]
- 6.Ishii K, Yamashita K, Akita M, Hirose H. Age-related development of the arrangement of connective tissue fibers in the lamina propria of the human vocal fold. Ann Otol Rhinol Laryngol. 2000;109:1055–64. doi: 10.1177/000348940010901112. [DOI] [PubMed] [Google Scholar]
- 7.Sato K, Hirano M, Nakashima T. Age-related changes of collagenous fibers in the human vocal fold mucosa. Ann Otol Rhinol Laryngol. 2002;111:15–20. doi: 10.1177/000348940211100103. [DOI] [PubMed] [Google Scholar]
- 8.Hammond TH, Gray SD, Butler J, Zhou R, Hammond E. Age- and gender-related elastin distribution changes in human vocal folds. Otolaryngol Head Neck Surg. 1998;119:314–22. doi: 10.1016/S0194-5998(98)70071-3. [DOI] [PubMed] [Google Scholar]
- 9.Hirano M. Phonosurgery. Basic and clinical investigations. Otologia (Fukuoka) 1975;21:239–440. [Google Scholar]
- 10.Roberts T, Morton R, Al-Ali S. Microstructure of the vocal fold in elderly humans. Clin Anat. 2011;24:544–51. doi: 10.1002/ca.21114. [DOI] [PubMed] [Google Scholar]
- 11.Bullough P, Goodfellow J. The significance of the fine structure of articular cartilage. J Bone Joint Surg Br. 1968;50:852–7. [PubMed] [Google Scholar]
- 12.Király K, Hyttinen MM, Lapveteläinen T, et al. Specimen preparation and quantification of collagen birefringence in unstained sections of articular cartilage using image analysis and polarizing light microscopy. Histochem J. 1997;29:317–27. doi: 10.1023/a:1020802631968. [DOI] [PubMed] [Google Scholar]
- 13.Speer DP, Dahners L. The collagenous architecture of articular cartilage. Correlation of scanning electron microscopy and polarized light microscopy observations. Clin Orthop Relat Res. 1979 Mar-Apr;(139):267–75. [PubMed] [Google Scholar]
- 14.Glazer AM, Lewis JG, Kaminsky W. An automatic optical imaging system for birefringent media. Proc R Soc London Ser A. 1996;452:2751–65. [Google Scholar]
- 15.Jin L-W, Claborn KA, Kurimoto M, et al. Imaging linear birefringence and dichroism in cerebral amyloid pathologies. Proc Natl Acad Sci U S A. 2003;100:15294–8. doi: 10.1073/pnas.2534647100. [DOI] [PMC free article] [PubMed] [Google Scholar]
- 16.Whittaker P, Romano T, Silver MD, Boughner DR. An improved method for detecting and quantifying cardiac muscle disarray in hypertrophic cardiomyopathy. Am Heart J. 1989;118:341–6. doi: 10.1016/0002-8703(89)90195-6. [DOI] [PubMed] [Google Scholar]
- 17.Berens P. CircStat: A Matlab toolbox for circular statistics. J Statistical Software. 2009;31:1–21. [Google Scholar]
- 18.Muñoz-Pinto D, Whittaker P, Hahn MSP. Lamina propria cellularity and collagen composition: an integrated assessment of structure in humans. Ann Otol Rhinol Laryngol. 2009;118:299–306. doi: 10.1177/000348940911800411. [DOI] [PubMed] [Google Scholar]
- 19.Hirano M, Kakita Y, Ohmaru K, Kurita S. Structure and mechanical properties of the vocal fold. In: Lass NJ, editor. Speech and language: advances in basic research and practice. Vol. 7. New York, NY: Academic Press; 1982. pp. 271–97. [Google Scholar]
- 20.Hirano M, Kurita S, Sakaguchi S. Ageing of the vibratory tissue of human vocal folds. Acta Otolaryngol. 1989;107:428–33. doi: 10.3109/00016488909127535. [DOI] [PubMed] [Google Scholar]
- 21.Sakae FA, Imamura R, Sennes LU, Mauad T, Saldiva PH, Tsuji DH. Disarrangement of collagen fibers in Reinke’s edema. Laryngoscope. 2008;118:1500–3. doi: 10.1097/MLG.0b013e3181770955. [DOI] [PubMed] [Google Scholar]
- 22.Madruga de Melo EC, Lemos M, Aragão Ximenes Filho J, Sennes LU, Nascimento Saldiva PH, Tsuji DH. Distribution of collagen in the lamina propria of the human vocal fold. Laryngoscope. 2003;113:2187–91. doi: 10.1097/00005537-200312000-00027. [DOI] [PubMed] [Google Scholar]
- 23.Prades JM, Dumollard JM, Duband S, et al. Lamina propria of the human vocal fold: histomorphometric study of collagen fibers. Surg Radiol Anat. 2010;32:377–82. doi: 10.1007/s00276-009-0577-9. [DOI] [PubMed] [Google Scholar]
- 24.Krausert CR, Olszewski AE, Taylor LN, McMurray JS, Dailey SH, Jiang JJ. Mucosal wave measurement and visualization techniques. J Voice. 2011;25:395–405. doi: 10.1016/j.jvoice.2010.02.001. [DOI] [PMC free article] [PubMed] [Google Scholar]
- 25.Klemuk SA, Riede T, Walsh EJ, Titze IR. Adapted to roar: functional morphology of tiger and lion vocal folds. PLoS One. 2011;6:e27029. doi: 10.1371/journal.pone.0027029. [DOI] [PMC free article] [PubMed] [Google Scholar]
- 26.Kurita S, Nagata K, Hirano M. A comparative study of the layer structure of the vocal fold. In: Bless DM, Abbs JH, editors. Vocal fold physiology, contemporary research and clinical issues. San Diego, Calif: College Hill Press; 1983. pp. 3–21. [Google Scholar]
- 27.Sato K, Umeno H, Nakashima T, Nonaka S, Harabuchi Y. Histopathologic investigations of the unphonated human child vocal fold mucosa. J Voice. 2012;26:37–43. doi: 10.1016/j.jvoice.2010.10.006. [DOI] [PubMed] [Google Scholar]
- 28.Junqueira LC, Montes GS, Sanchez EM. The influence of tissue section thickness on the study of collagen by the Picrosirius-polarization method. Histochemistry. 1982;74:153–6. doi: 10.1007/BF00495061. [DOI] [PubMed] [Google Scholar]


