

Abstract
In the past few years, there have been many exciting advances in the field of molecular programming, reaching a point where implementation of non-trivial systems, such as neural networks or switchable bistable networks, is a reality. Such systems require nonlinearity, be it through signal amplification, digitalization or the generation of autonomous dynamics such as oscillations. The biochemistry of DNA systems provides such mechanisms, but assembling them in a constructive manner is still a difficult and sometimes counterintuitive process. Moreover, realistic prediction of the actual evolution of concentrations over time requires a number of side reactions, such as leaks, cross-talks or competitive interactions, to be taken into account. In this case, the design of a system targeting a given function takes much trial and error before the correct architecture can be found. To speed up this process, we have created DNA Artificial Circuits Computer-Assisted Design (DACCAD), a computer-assisted design software that supports the construction of systems for the DNA toolbox. DACCAD is ultimately aimed to design actual in vitro implementations, which is made possible by building on the experimental knowledge available on the DNA toolbox. We illustrate its effectiveness by designing various systems, from Montagne et al.'s Oligator or Padirac et al.'s bistable system to new and complex networks, including a two-bit counter or a frequency divider as well as an example of very large system encoding the game Mastermind. In the process, we highlight a variety of behaviours, such as enzymatic saturation and load effect, which would be hard to handle or even predict with a simpler model. We also show that those mechanisms, while generally seen as detrimental, can be used in a positive way, as functional part of a design. Additionally, the number of parameters included in these simulations can be large, especially in the case of complex systems. For this reason, we included the possibility to use CMA-ES, a state-of-the-art optimization algorithm that will automatically evolve parameters chosen by the user to try to match a specified behaviour. Finally, because all possible functionality cannot be captured by a single software, DACCAD includes the possibility to export a system in the synthetic biology markup language, a widely used language for describing biological reaction systems. DACCAD can be downloaded online at http://www.yannick-rondelez.com/downloads/.
Keywords: molecular programming, computer-assisted design, in silico to in vitro
1. Introduction
1.1. Generality
Computer-assisted design (CAD) has helped many fields reach their full potential by scaling up designs, making error-prone or repetitive tasks automated and allowing easy simulation and verification of systems. As such CAD has proved to be a necessary tool to develop any advanced technology, examples of which include areas as varied as integrated circuits, aeronautics or programming. The case of DNA computing, a field that uses the interactions between various DNA molecules and enzymes to perform meaningful operations, is no exception: while DNA computing systems have shown great promise [1–4], advances are still considerably limited by the trial-and-error process, and many such systems are often left at the proof-of-concept stage. Computer assistance could remove this limitation and help designers take the next step towards actual applications. In this study, we present DNA Artificial Circuits Computer-Assisted design (DACCAD), a CAD program for designing systems using Montagne et al.'s [3] dynamic networks assembly (DNA) toolbox, a set of DNA-and-enzyme-based modules that can be arbitrarily combined into chemical reaction networks (CRNs).
CRNs are assemblies of cross-interacting chemical reactions where each molecular compound can affect the formation and degradation rate of the others. CRNs, when kept out of equilibrium, can display a variety of nonlinear behaviours, including oscillations and multistability. They are very powerful systems in terms of information processing, as shown by the variety of complex cellular processes that are controlled by CRNs in vivo [5]. The recent demonstrations that they possess Turing universality [1,6–9] also advocates for their use in a variety of control tasks at the molecular level. However, CRNs tend to resist rational design. A link between the properties of the network and its dynamic functions can be obtained from dynamical systems theory, including linear stability analysis [10], Lyapunov stability analysis [11] or CRN theory [12], but such analytical approaches are generally restricted to idealized systems with simple mathematical models. Actual implementations are generally much more intricate in terms of chemical kinetics.
In recent years, great efforts have been invested in the exploration of the class of reaction networks relying on in vitro DNA chemistry and biochemistry. These systems are based on the predictability of DNA–DNA interactions using simple Watson–Crick base-pairing rules as well as on the rich repertoire of possible enzymatic transformations. Using DNA-based molecular programming, it is possible to build simple computing systems based on Boolean logic [6,13,14] but also neural networks [2] and CRNs [7]. Enzymatic systems are of particular interest because they can be maintained out of equilibrium for an extended period of time (for instance by having a large amount of deoxyribonucleotide triphosphate or nucleoside 5′-triphosphate in the solution, acting as a generic fuel) and thus are suited to explore emergent behaviours. We focus on the DNA toolbox, a recent framework to assemble out-of-equilibrium networks of arbitrary topology, whose dynamics are powered by three enzymes (polymerase, exonuclease and nickase). This framework has been used to build oscillators [3], bistable systems [4], a push–push memory circuit [4] or even molecular ecosystems reproducing predator–prey cycles in bulk [15], spatially [16,17] or in droplets [18]. Spatial implementations of those systems display waves [16,17], showing they can be used for two-dimensional reaction–diffusion systems. All these circuits were simple enough to be designed and tuned by hand, but doing so was still an arduous process of trial and error that cannot be extended to larger systems. Indeed, in well-mixed solutions, any molecular element can potentially interact with many others at any given time, and keeping track of all of these interactions and their kinetic consequences quickly becomes impossible for a human. It gets worse when counterintuitive effects, such as competition and saturation [19–21], have to be taken into account.
However, a quite unique feature of DNA as a molecular material is the possibility to find simple rules and kinetic parameters describing its global behaviour [7,22,23]. The dependence of each nucleotide on the global environmental conditions (salt concentration, temperature) is thus averaged through those parameters. While those rules are simple in essence, complexity emerges from their intrinsic nonlinearity. Similarly, the biochemistry of DNA can be described by simple models, such as the Michaelis–Menten equation or competitive inhibition. Therefore, DNA-based CRNs can be both implemented in test tubes and described by quantitative or semi-quantitative ordinary differential equation (ODE) models based on standard kinetics. Compared with previous experimental studies on CRNs, the availability of such mathematical models is the true benefit of DNA systems. It puts the molecular programming approach in stark contrast to ‘classic’ nonlinear reaction networks, such as those observed in chemistry (such as the Belousov–Zhabotinsky reaction [24]) and in biology (gene regulation networks [25,26], signalling cascades in metabolic networks [27], etc.). Note that in these last two cases, it is generally possible to infer high-level models of interaction among the molecular members of the reaction network, such as Hill equation for the cooperative binding of ligands [28]. However, it is much more difficult to obtain precise mathematical forms describing these interactions, let alone accurate numerical parameters needed for predictive simulations. This last point thus makes those systems harder to use in an engineering context.
DNA-based systems thus provide the chemical tools to implement any computation or dynamic behaviour at the molecular scale. While the construction of complex systems quickly becomes intractable for the human brain, these accurate mechanistic models allow us to numerically simulate them with reasonable accuracy, justifying CAD. For those reasons, we expect that this approach will be the only way to push the complexity of experimentally accessible systems further. In DACCAD, the services offered by the machine are fourfold:
— it provides a straightforward graphical interface to create the network and assess its dynamic behaviour;
— it eliminates routine and error-prone tasks such as ODE writing and solving;
— it helps in simple optimization tasks such as adjusting the parameters to tune the behaviour of the network towards a quantitative target, once a qualitative agreement has been obtained; and
— it can display an animated version of the network, giving a better understanding of the evolution of the system over time.
DACCAD was written entirely in Java1 to make it as easy to deploy as possible. This software allows the user to set the reaction parameters, such as enzymatic activities, to be as close as possible to real-life experiment. Users can also refer to the electronic supplementary material of Montagne et al. [3] to fit these parameters to their own experimental settings. It comes with preset parameters from Padirac et al.'s work, so that only a general knowledge of CRNs is necessary to start designing complex systems. DACCAD thus makes it quick to test designs based on the user's intuition. Designed systems can then be built in vitro, using Baccouche et al.'s [29] protocol. Finally, DACCAD can convert any such designed system to synthetic biology markup language (SBML) to ensure compatibility with other simulation tools that the user would like to use.
1.2. Related work
The basic operations that can be executed by DNA, such as two complementary strands attaching to form a double helix, toehold-mediated strand displacement and enzymatic transformations, are well known. However, there are multiple paradigms that use those mechanisms in very different ways. One such paradigm, DNA strand displacement (DSD), already benefits from its own software for CAD, VisualDSD [30], demonstrating the effectiveness of the CAD approach. Recently, Kwiatkowska and co-workers [31] were able to prove the incorrectness of a basic DSD system by coupling VisualDSD with a verification software and then propose a corrected version. VisualDSD is also useful to highlight counterintuitive phenomena such as the winner-take-all effect [19,32,33].
DSD is also the foundation of Qian and Winfree's seesaw gate [1,2], which they used to build complex logical circuits. However, the translation is hard to do by hand, and so is the design of the actual hundreds of DNA sequences making up the system. This is why they designed a compiler (http://www.dna.caltech.edu/SeesawCompiler/) which takes a description of a logical circuit and outputs the DNA sequences to implement it. The compiler can also export the system in the Mathematica and SBML [34,35] format for simulation of the system at the molecular level, and VisualDSD format for simulation at the toehold level.
The motivation to automatically design DNA sequences is that unwanted interactions at the molecular level are very common. While simulation might show no problem with abstract sequences, actual implementation, if done incorrectly, can lead to unexpected secondary structures. In particular, because sequences are made up of only four nucleotides, it is hard to prevent partial complementarity. NUPACK [36] and DINAMelt [37,38] are online tools designed to check how specific sequences will interact together and output the most stable configurations. They also compute many characteristics of such structures, such as melting temperature. NUPACK focuses more on the secondary structures of systems with multiple kinds of DNA strands, whereas DINAMelt provides various data on the interaction of two sequences.
For broader applications, COPASI [39] is a very complete tool for analysing and simulating biological systems. It has the advantage of being able to perform mass action, stochastic and hybrid simulations of any system described in SBML and is also able to handle parameter fitting and optimization, which makes it very powerful. However, it has the inconvenience of requiring the user to provide the SBML file describing the system, or input each and every single molecules, interactions and reaction rates by hand through the graphical user interface, a long process for realistic systems. For this reason, we gave the option to export systems designed with DACCAD in the SBML format, so that the user can perform additional operations with COPASI, or any other software supporting this format.
Furthermore, DNA possibilities are not limited only to computation. Because DNA molecules can be considered flexible when long enough, but locally rigid, they can be used to build complex structures, for instance by using a long scaffold strand held in place by short ‘staple’ strands [40], or by using directly specific short strands [41,42]. Such approaches have to rely heavily on CAD software, such as caDNAno [43] and CanDo [44], as the number of different sequences necessary to create complex structures is very large.
Note that those programs work at different levels, ranging from abstract species in COPASI to DNA strands in VisualDSD or DACCAD to actual DNA sequences in NUPACK or DINAMelt, depending on the application.
1.3. The dynamic networks assembly toolbox
The DNA toolbox was introduced by Montagne et al. [3] to help rationally design DNA-based molecular programs, and demonstrated its effectiveness through multiple systems such as the Oligator. It has the advantage of using very simple modules (activation and inhibition) which can be combined to form, in theory, arbitrarily complex systems. Moreover, it was described both from the theoretical [45] and experimental point of view [29]. In the toolbox, two kinds of DNA strands have to be distinguished: short DNA strands are used as signals, and longer strands are used as templates to generate new strands (figure 1). Activation is done by short strands being extended by a DNA polymerase enzyme along a compatible template, after which both signal and output strands are cleaved apart by nickase. Both signal and output are too short to form stable duplexes and are eventually released. Inhibition is done by slightly longer strands that are complementary to most of their target, but do not trigger polymerization or nicking, thus inactivating the template. Both signal and inhibition strands are degraded over time by the action of an exonuclease enzyme, to keep the system out of equilibrium. Templates are chemically protected against such degradation.
Figure 1.
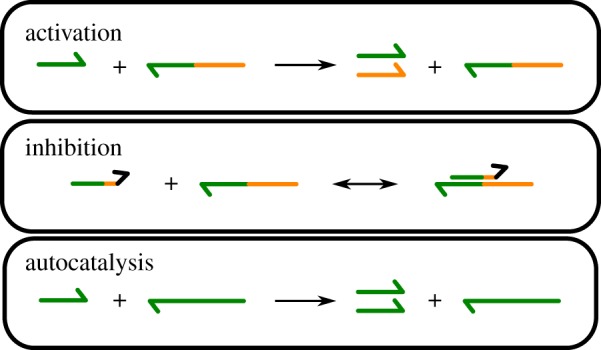
Modules of the DNA toolbox: activation, inhibition and the special case of autocatalysis. The black domain in the inhibition strand represents the final mismatch preventing the action of the polymerase. (Online version in colour.)
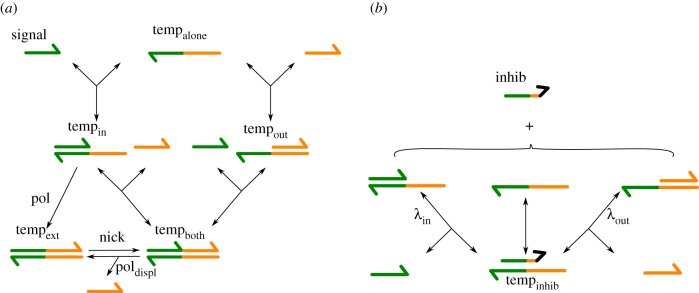
Any system using this paradigm can be easily represented as a graph: signal and inhibition strands are the nodes while templates are represented by an arrow from their signal to their output. A second kind of arrow (‘bar-headed’ arrow) is also used to represent which template is inhibited by a given inhibition strand. Simple examples of such representation are shown in figure 2. Conversely, any such graph can be directly converted to a DNA implementation.
Figure 2.
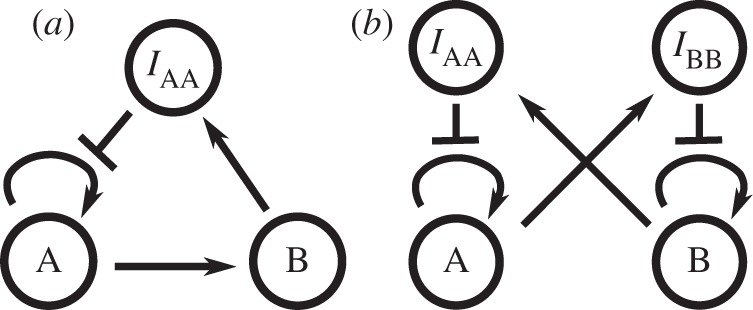
Examples of graph representation of the DNA toolbox: (a) Montagne et al.'s Oligator [3] and (b) Padirac et al.'s bistable system [4].
DACCAD can simulate both autonomous and non-autonomous systems. The latter are simulated by adding a given amount of a specific species to the system at a set time in the simulation. This allows us to simulate inputs coming from outside the system, such as injections made by the experimenter or signal coming from another DNA system present in the environment. Spikes, either unique or periodic, can be added through the interface. Arbitrary inputs can also be loaded from an external file.
However, despite the simplicity of the DNA toolbox paradigm, many effects are very hard to take into account for a human designer. For instance, replacing a direct activation (A promotes B) by an indirect one (A promotes C which promotes B) will result in more than just some latency in the activation: there will also be a latency in all responses of the strand B, meaning that its concentration will also decrease slower (figure 3). Additionally, enzymes may get saturated, which would change the reaction rates of other parts of the system in ways difficult to apprehend for the human mind [21,33]. Those problems can be avoided by modifying parameters in the system (strand stability, template concentrations, enzyme activities, etc.), or making additional changes in the structure, operations that are easily carried out with DACCAD.
Figure 3.
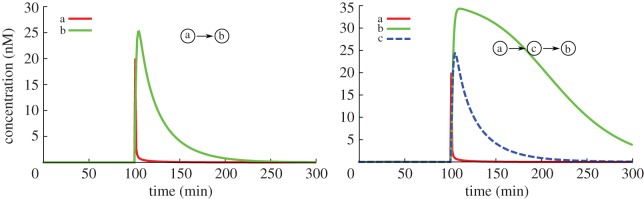
Impact of indirect activation of a given species. (Online version in colour.)
2. Methods
2.1. Mathematical model
To keep the model simple, yet descriptive enough, we model reactions at the domain level. Such level abstracts actual DNA sequences and instead considers only meaningful interactions, from the designer's point of view. In particular, in the DNA toolbox, signal and inhibition strands are composed of only one domain, so we consider they are either completely free or completely attached to their target. Similarly, templates are composed of two domains, because they have both an activation and an output site. This approach has proved itself over time in DSD systems [2,30,31], and can be extended to the DNA toolbox if we consider that enzyme activity is carried out as a single step. This means that no intermediate product of an enzymatic reaction, such as a partially extended DNA strand, can interact with other parts of the system. This also means that the evolution of the state of a module (activation or autocatalysis) over time can be derived only from the current concentrations of the relevant species and its current state (figure 4). With those restrictions, the set of possible reactions taking place is large, but straightforward: both signal and output strands can attach or detach to the template and an inhibition strand can displace them if there is a toehold [46] available, the polymerase enzyme will extend the signal strand, displacing the output if it was attached and so on. Possible reactions for a single template are shown in figure 5. This demonstrates one of the advantages of DACCAD: in a generic biochemical simulation program such as COPASI, the user would need to add all those species and reactions by hand, setting the kinetic rates of each reaction based on enzymatic saturation. DACCAD generates all those elements by implicitly referring to a precise biochemical context, allowing the user to design systems much faster. Generating a template takes one click in DACCAD, whereas it generates for COPASI five new species, 11 reactions and requires one to update carefully the Michaelis–Menten equation of each enzyme. It gets even worse for COPASI if the template is inhibited, as an additional species and six new reactions have to be added to the mathematical model. Figure 6 shows the size difference between the representation of the same reaction network in DACCAD and COPASI.
Figure 4.
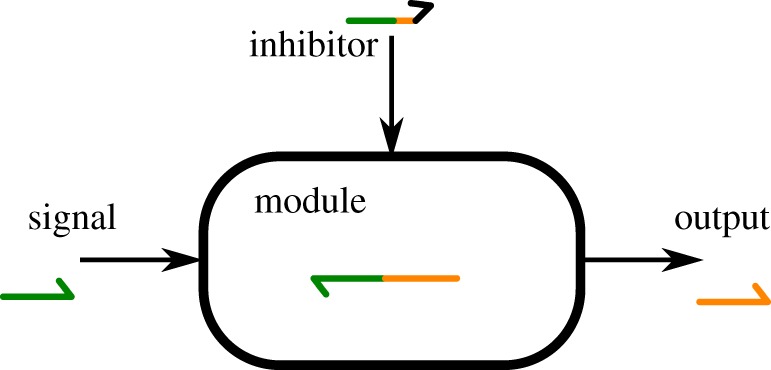
An activation module from figure 1 as a black box, with its three external components: the signal, inhibition and output strands. Based only on the current concentrations of those three elements and the module current state, it is possible to compute the module's impact on said elements, as well as the derivative of its state. (Online version in colour.)
Figure 5.
All the possible reactions between a template and its various inputs. The respective concentrations of the different configurations of template represent the state of a module: temp, noted tempalone (template alone), tempin (signal strand attached), tempout (output strand attached), tempboth (both signal and output strands attached), tempext (template completely double-stranded) and tempinhib (inhibited template). (a) Working of an activation template without inhibition. (b) Reactions related to inhibition. Toe represents the fact that signal and output strands invade an inhibited template at a slower rate, because they have a very short toehold. (Online version in colour.)
Figure 6.
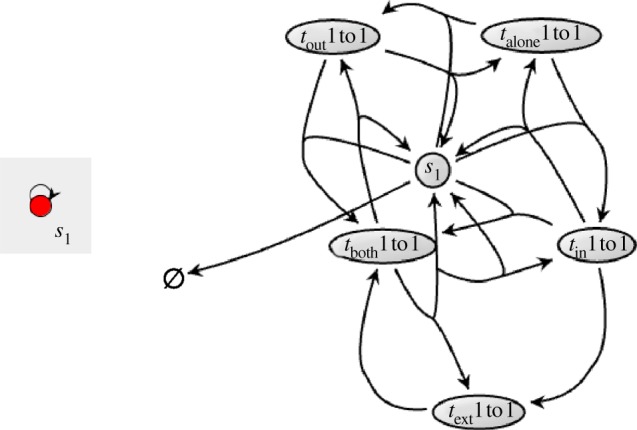
Comparison between the representation of a simple DNA toolbox autocatalytic module in DACCAD, and the same chemical system in COPASI. The latter graph was created through the interface of COPASI from the SBML file exported by DACCAD. (Online version in colour.)
The derivative of the concentration of a signal strand s is deduced from its interactions with all compatible modules as follows:
| 2.1 |
where I is the set of all modules accepting s as activator, O is the set of all modules generating s,  is the flow of s as input of a template temp,
  is its contribution as the output of a template temp and exos(t) is the activity of the exonuclease enzyme respectively to s at time t, which is a constant depending only on s if enzymatic saturation is not taken into account. Furthermore, based on the measures of Montagne et al. [3], we assume that exos mostly depends on the length of s, which means it can take only two values: one for the signal strands and one for the inhibition strands. Except for this strand-specific variation, enzymatic activity is considered first order in the basic model, meaning in particular that exos does not change over time. Also note that a given module can be both in I and O in the case of autocatalysis.
The derivatives for inhibition strands are similar, but the input term is replaced by an inhibition term:
| 2.2 |
Note that there is only one flux for the inhibition term, because a given inhibition strand targets a specific module temp.  ,
,  and
and  can be directly derived from the current state of the module temp. Their expressions are given in the electronic supplementary material.
While the basic model does not take into account enzyme saturation, using first-order activity, such assumption is not realistic for a complex system. Specifically, all modules are sharing the same three enzymes, which is expected to have an impact on their activity. The usual way to model such burden is to use a Michaelis–Menten term to quantify the enzymatic activity. Such term is further modified to take into account that multiple modules are competing for those resources [21]. Coaxial stacking, the collaborative stabilization that happens at a nick, and dangle are also considered by the model, as it affects the release speed of input and output. Explicit saturation expressions and a discussion on coaxial stacking are given in the electronic supplementary material.
It is possible to toggle the saturation for part or all of the enzymes (polymerase, nicking enzyme and exonuclease) to obtain results closer to reality at a (light) cost in computation time.
It is also possible to toggle some additional effects: removing enzymatic coupling, in which case saturation terms from substrates other than s are neglected; taking free templates into account in the saturation term of the exonuclease (even though they are not degraded, they can still bind to the enzyme and act as competitive inhibitors); allowing signal and output strands to invade inhibited templates; allowing the polymerase to generate output at a very slow rate from templates without primer (phenomenon called leak). Saturation is toggled on by default, both to be closer to the actual in vitro behaviour and to help design systems specifically using this phenomenon, such as in a winner-take-all system [19,32,33].
2.2. Implementation
2.2.1. Graphical interface and graph manipulation
The main graphical interface of DACCAD is separated into two areas (figure 7): a display panel showing the graphical representation of the system being designed and a data panel showing context-dependent information.
Figure 7.

1. Display panel. 2. Data panel. 3. Parameters area. Sets species and template-relative parameters. 4. Graph of the system. Selected nodes are displayed in blue. 5. File menu. 6. Species menu. 7. Options. Sets general and enzymatic parameters. 8. Plot. Simulates and displays the behaviour of the system. (Online version in colour.)
As mentioned before, DNA toolbox systems can be represented as a graph, with a minor modification to allow inhibitors to target templates. The Graph class from the JUNG library [47] was extended to store this information, as well as additional sequences and template-relative parameters, such as stability and concentration. The display is done by the JUNG library, with a modified renderer able to draw inhibition arrows. The plotting of time traces is done by the JFreeChart library [48]. It is also possible to obtain an animated version of the graph, displaying the evolution of species concentrations and enzyme saturation, using a second renderer supporting size and colour changes.
2.2.2. Equation generation and solving
In §2.1, we have explained how to reduce a given graph to a system of differential equations. This system is actually never explicitly generated by the simulator. Instead, rewriting rules are applied to deduce all the flux affecting a given part of the system on the fly, generating the value of the derivatives of the various parts of the DNA system. Those derivatives are passed on demand to the Gragg–Bulirsch–Stoer integrator [49] from the Apache Commons Mathematics Library, generating the time trace. This algorithm was chosen for its high precision and step adaptability, useful to solve systems such as the bistable switch [4] where two excluding parts of a system get very close in concentration and requires careful integration to obtain the correct dynamics. Default parameters are given in the electronic supplementary material.
The system of differential equations is only actually generated for export as a Mathematica or SBML file. A generic file template containing the basic rules of the DNA toolbox chemistry is completed through similar rewriting rules to the one used for the simulator.
2.2.3. Local optimization
While trial and error is a simple way to optimize in silico a system's behaviour, such as an oscillator's amplitude or frequency, it might be inconvenient owing to the sheer number of parameters existing in the model (duplex stability of every species, initial concentrations, template concentrations, Michaelis constants of enzymes). For this purpose, we added the possibility to use CMA-ES, a state-of-the-art optimization algorithm [50], to perform parameter optimization. The structure is kept as defined by the user to make optimization possible in a reasonable amount of time. Structure optimization can also be attempted, but requires adapted algorithms [51,52]. The user can define which parameters can be optimized, which is useful to accommodate existing constraints or reduce computation time.
The desired behaviour is defined by placing dots on the time plot of concentrations or by loading a previously saved target profile. CMA-ES will then try to minimize the least-square distance between the target and the actual concentration curves. If no match can get below the user-defined termination threshold, the algorithm stops after a given number of iterations (default is 100) and sets the parameters to the best fit.
3. Results
Here, we present various systems that were simulated using DACCAD, going from simple to advanced networks. We also present the effects of enzyme saturation and show that they can be both deleterious or instrumental, depending on the context.
3.1. Simple systems
As a proof of concept, we implemented Montagne et al.'s Oligator [3] and Padirac et al.'s bistable circuit [4]. The time series were compared with those of the original articles. Those systems represent two basic behaviours, respectively oscillations and memory, making them appropriate building blocks for advanced systems. Multiple time plots showing the impact of different parameters on those systems are shown in figure 8. This also gives a chance to quickly explore the impact of multiple parameters on such systems. In particular, coaxial stacking (and thus indirectly the actual nucleotide sequences) has a strong impact on autocatalytic signals. For the Oligator, the system obtains more stable oscillations if the autocatalyst has little to no coaxial slowdown. In the case of the bistable circuit, it is possible to find a stability diagram based on the initial concentrations of A and B similar to the one found by Padirac et al. [4]. This diagram is strongly influenced by the coaxial stacking values of the various templates (see the electronic supplementary material).
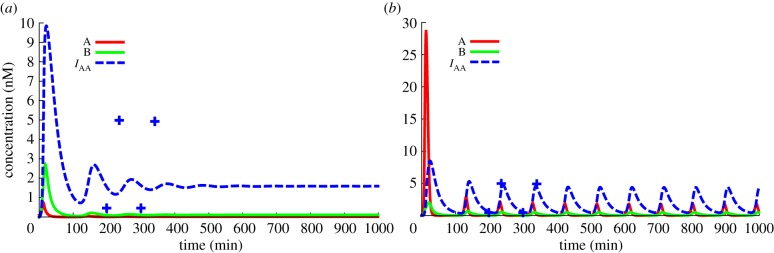
Figure 8.

(a,b) The Oligator [3], simulated with first-order enzymatic activity (a) and with enzymatic saturation and competitive coupling (b). With the chosen parameters, the amplitude and frequency of oscillation are modified, but the behaviour is otherwise unchanged. (c,d) Simulation of Padirac's bistable circuit. Only the time plot of the autocatalytic species is shown. The initial concentration of A is higher than that of B, forcing the system into the A state. If the concentration of autocatalytic templates is too high (d), the system saturates the enzymes and loses its bistable properties. Performing some optimizations on the enzyme parameters gives us some insights into this phenomenon: it turns out that with Padirac et al.'s [4] parameters, the nicking enzyme saturates first, causing this loss of bistability. (Online version in colour.)
3.2. Simple system optimization
The Oligator oscillates only on a restricted area of the complete parameter space [3]. To find a working set with specific properties in terms of amplitude and frequency, we used the optimization tool of DACCAD, leading to the results shown in figure 9. In this particular case, a very good match was found, but specific behaviours may be impossible. In the case of troubles with the evolution, it is recommended to reduce the number of evolved parameters and go through multiple intermediary behaviours, so that the system evolves progressively in the good direction. As an example, when trying to optimize the frequency divider (figure 11), the optimizer was not explicitly allowed to modify the behaviour of the oscillator. However, by increasing the concentration of the template connecting the oscillator to the rest of the circuit and using the load effect, the optimizer found a ‘good’ match: the additional templates sequester an intermediary species of the oscillator, making it actually twice slower. Good parameters were found by excluding this parameter from the optimization as well.
Figure 9.
Optimization of an oscillator. (a) At first, the system displays only damped oscillations. The user can describe the desired behaviour through the interface (the dots represent the user-defined behaviour). (b) CMA-ES then performs some rounds of optimization until a result close enough is achieved. Note that the concentration scale is different between the two panels. (Online version in colour.)
Figure 11.
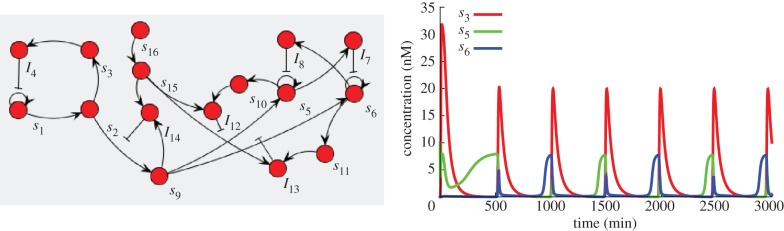
A frequency divider. The original oscillator (s1 to I4, a version of Montagne et al.'s Oligator [3] with a two species delay) is connected to a push–push memory (s5 to I11). The two species delay has the double effect of making the oscillator more robust to the connection load and slowing the oscillations to give enough time to the bistable circuit to switch. To produce spike-like activation of the switch, an additional species (I12) is used to form an incoherent feed-forward loop. Species s13 and s14 are used to initially inhibit the switch, giving enough time to the bistable switch to reach a valid state. Both state species from the bistable circuit can then be used as oscillators of half the original frequency, in opposition of phase. (Online version in colour.)
3.3. Combined systems
Using the two previous building blocks, we can build advanced systems that would require hundreds of lines if the ODEs were written by the user. By cascading two bistable systems, we can obtain a two-bit counter (figure 10). If instead we chose to combine an extended Oligator and a bistable circuit, we can obtain a frequency divider (figure 11). The systems presented here are perfect examples of the problems that might arise when combining two circuits. While the modularity of the DNA toolbox makes it simple to use multiple systems in parallel, such as in the two-bit counter, many factors have to be taken into account when cascading systems. The most important is the load effect [53]: when adding a template taking a given strand as input, the sequestering of this strand will change the behaviour of the system of which it is part. In the frequency divider, for instance, the template connecting the oscillator to the bistable system will change the oscillator's frequency or even prevent anything more than damped oscillations. This phenomenon is strongly dependent on the strand used as input: any perturbation to the autocatalyst will prevent true oscillations, but the intermediate species are more robust. The optimal course of action is then to create a link to a new species that will in turn bear the full load of the connection to the other part of the system.
Figure 10.
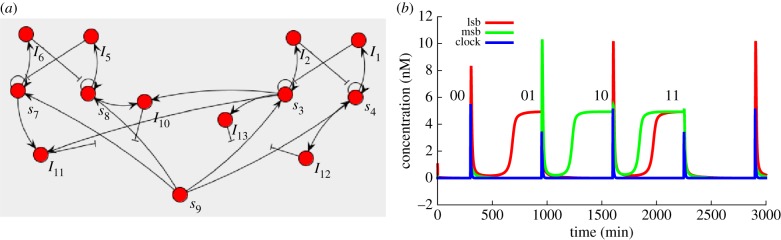
A two-bit counter made of two push–push memory circuits [4], with (a) the actual circuit of the system and (b) the time plot of the relevant species. Switches come from an input of species 9 (clock), making this a non-autonomous system. Note that the spike of species 9 when switching the least relevant bit is different when going from 0 (species 3 high) to 1 (species 4 high) than when going from 1 to 0. This is due to the load effect: when species 3 is high, more templates that can capture species 9 are inhibited, so the free concentration of species 9 is higher.
3.4. Saturation-based effects
Kim et al. [19] presented a biochemical phenomenon named winner-take-all that arises when there is competition for a common resource in which the species that reproduces the fastest using this resource will eliminate all competitors. This phenomenon was leveraged by Genot et al. to perform efficient computation [32]. In the DNA toolbox, enzymes are perfect examples of such shared resources [33]. Because the standard experimental parameters are set to avoid saturation (and thus competition) as much as possible, the activity of one enzyme has to be reduced by an order of magnitude. This can be achieved in an actual experiment by reducing the actual quantity of enzyme introduced in the system. Each of the three enzymes creates different behaviours when they are set to be the bottleneck of the reaction system, leading to interesting dynamics. For instance, very low exonuclease means that a dominating species will receive most of the degradation, thus protecting other species that would not survive otherwise. Conversely, very low polymerase enables the winner-takes-all effect described by Kim et al. as shown in figure 12. Saturation can also be harnessed to generate various behaviours, such as oscillations (figure 13) in a system that would be stable otherwise.
Figure 12.
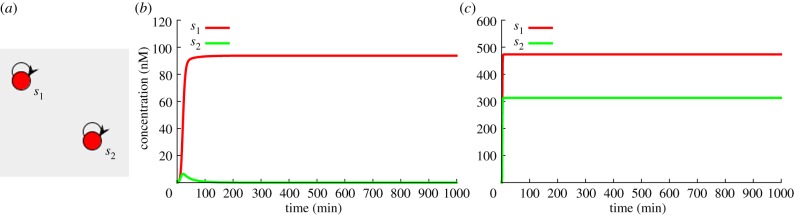
(a) Winner-takes-all effect. Time trace of two simple autocatalysts, with (b) and without (c) saturation. Interaction is done only through competition for the polymerase enzyme, other enzymes are set to work in first-order regime. In this case, the autocatalyst s1 has more template than s2, resulting in the complete disappearance of the latter. (Online version in colour.)
Figure 13.

(a) Saturation-based oscillations. In those systems, saturation works mostly at the polymerase level. Each network, having positive and negative feedbacks but lacking delay, produces damped oscillations (b). When they are put together in a system, one network starting loads the polymerase, reinforcing the decay of the other. The two systems then tend to use the polymerase alternately and thus synchronize in opposite phases. Each of them feels an apparent oscillating polymerase activity, which provides the additional nonlinearity necessary to compensate for the damping. Oscillations can be symmetrical if template concentrations are identical (c), or asymmetric if there is a small difference in concentrations (d). (Online version in colour.)
3.5. Complex system: the Mastermind game
Finally, as a proof of concept of modular design, we implemented a large system where repeating motifs were connected together. For this purpose, we chose to implement a version of Mastermind, a classic board game in which one player decides a secret combination that the other player tries to guess. We chose to have two possible symbols and a combination of length four. The design was done incrementally. First, we created a guess validation module, combining a bistable (memory), an input system (signal amplification) and a reporter. The response was optimized in a saturated environment using CMA-ES. We then combined four such modules and optimized again to cover all input possibilities. The whole system is shown in figure 14. The design strategy is explained in the electronic supplementary material. A sample game is shown in figure 15.
Figure 14.
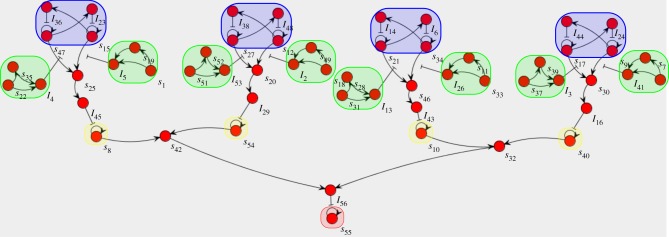
Implementation of the Mastermind game. State bistable circuits are shown in blue, possible inputs in green, reporter species in yellow and lock species in red.
Figure 15.

Mastermind game. The state of a given position can be either A or B. Each attempt improves the guess until the correct answer, BABA, is found on the fourth trial.
4. Conclusion
In this study, we presented a mathematical model for the simulation of systems designed with the DNA toolbox. We also introduced DACCAD, a software created to help design such systems. DACCAD allows its user to quickly create new DNA toolbox systems by using its intuitive graphical interface. Such systems can then be refined at will by setting a large range of parameters to fit the user's experimental conditions. Once the design is complete, it is possible to move on to the actual DNA sequence design, using tools such as NUPACK [36] or DINAMelt [37,38] and the design rules presented in Baccouche et al. [29]. While the value of some parameters, such as the release slowdown owing to coaxial stacking, can be hard to predict, the actual value can be measured through some basic experiments and then updated in DACCAD, allowing the quick correction of a design. Such parameters can also be slightly modified from their actual experimental value to encompass more specific or sequence-dependent effects [54,55]. Finding a way to fit such experimental parameters directly from fluorescence data could be an important future application.
Note also that the very strength of DACCAD, i.e. its black box handling of kinetic complexities, brings along a limitation: it can only work with pure polymerase–nickase activator–inhibitor systems, and other reactions, such as hairpin formation from the predator–prey system [15], are forbidden. However, handling of additional operations can be performed through external software as DACCAD models can be exported in the widely used SBML format. In particular, it is possible to quickly generate the DNA toolbox part of a system and then move on to another software to add operations. In that sense, DACCAD can be seen as a compiler graph to SBML, allowing the algorithmic generation of DNA toolbox systems (for example, systems trying to solve instances of the 3-SAT problem [56]). Moreover, this generation is facilitated by its simple graph description file format.
We then showed how the software can be used to design systems of increasing complexity. In particular, one can also observe different behaviours, such as saturation-based oscillation or the winner-takes-all effect. Local optimization can also be performed by using the state-of-the-art algorithm CMA-ES. Moreover, the mathematical model can be easily re-used with other design techniques, such as evolutionary algorithms, which may help optimizing systems following multiple possible objectives [57], or find new design patterns to create complex systems [51,52]. It would also be interesting to investigate two-dimensional reaction–diffusion implementations of the DNA toolbox [16,17], which would prove beneficial to develop smart materials or create particular spatio-temporal patterns. To do so, DACCAD could be extended to add diffusion terms to the current equations, and then export them to be solved by fast off-the-shelf reaction–diffusion simulation software, such as ReaDY (https://code.google.com/p/reaction-diffusion/).
It is our hope that this software will speed up the creation of novel networks as well as spread the usage of molecular programming to a broader audience. The mathematical model of the DNA toolbox presented here might also give new theoretical insights on its power, such as whether it would be possible to approximate arbitrary CRNs. The executable file and all examples from this article can be found at http://www.yannick-rondelez.com/downloads/. The code can be obtained by contacting the first author.
Acknowledgements
We thank Prof. Nicolas Bredeche, Dr Anthony Genot, Dr Adrien Padirac and Alexandre Baccouche for useful discussions, the anonymous reviewers and all the DACCAD beta testers, who provided useful insights into the organization of the software and priceless bug reports.
Endnote
Java 6 is required. Minimum specifications are available online on Oracle's website at http://www.oracle.com/technetwork/java/javase/config-417990.html.
References
- 1.Qian L, Winfree E. 2011. A simple DNA gate motif for synthesizing large-scale circuits. J. R. Soc. Interface 8, 1281–1297. ( 10.1098/rsif.2010.0729) [DOI] [PMC free article] [PubMed] [Google Scholar]
- 2.Qian L, Winfree E. 2011. Scaling up digital circuit computation with DNA strand displacement cascades. Science 332, 1196–1201. ( 10.1126/science.1200520) [DOI] [PubMed] [Google Scholar]
- 3.Montagne K, Plasson R, Sakai Y, Fujii T, Rondelez Y. 2011. Programming an in vitro DNA oscillator using a molecular networking strategy. Mol. Syst. Biol. 7, 466 ( 10.1038/msb.2010.120) [DOI] [PMC free article] [PubMed] [Google Scholar]
- 4.Padirac A, Fujii T, Rondelez Y. 2012. Bottom-up construction of in vitro switchable memories. Proc. Natl Acad. Sci. USA 109, E3212–E3220. ( 10.1073/pnas.1212069109) [DOI] [PMC free article] [PubMed] [Google Scholar]
- 5.Wagner A, Fell DA. 2001. The small world inside large metabolic networks. Proc. R. Soc. Lond. B 268, 1803–1810. ( 10.1098/rspb.2001.1711) [DOI] [PMC free article] [PubMed] [Google Scholar]
- 6.Soloveichik D, Seelig G, Winfree E. 2010. DNA as a universal substrate for chemical kinetics. Proc. Natl Acad. Sci. USA 107, 5393–5398. ( 10.1073/pnas.0909380107) [DOI] [PMC free article] [PubMed] [Google Scholar]
- 7.Seelig G, Soloveichik D, Zhang DY, Winfree E. 2006. Enzyme-free nucleic acid logic circuits. Science 314, 1585–1588. ( 10.1126/science.1132493) [DOI] [PubMed] [Google Scholar]
- 8.Magnasco MO. 1997. Chemical kinetics is Turing universal. Phys. Rev. Lett. 78, 1190–1193. ( 10.1103/PhysRevLett.78.1190) [DOI] [Google Scholar]
- 9.Winfree E. 1998. Algorithmic self-assembly of DNA. Doctoral dissertation California Institute of Technology. [Google Scholar]
- 10.Murray JD. 2002. Mathematical biology I: an introduction, 3rd edn Berlin, Germany: Springer. [Google Scholar]
- 11.Branicky MS. 1998. Multiple Lyapunov functions and other analysis tools for switched and hybrid systems. IEEE Automat. Control 43, 475–482. ( 10.1109/9.664150) [DOI] [Google Scholar]
- 12.Tyson JJ, Chen KC, Novak B. 2003. Sniffers, buzzers, toggles and blinkers: dynamics of regulatory and signaling pathways in the cell. Curr. Opin. Cell Biol. 15, 221–231. ( 10.1016/S0955-0674(03)00017-6) [DOI] [PubMed] [Google Scholar]
- 13.Chiniforooshan E, Doty D, Kari L, Seki S. 2011. Scalable, time-responsive, digital, energy-efficient molecular circuits using DNA strand displacement. In DNA computing and molecular programming (eds Sakakibara Y, Mi Y.). Lecture Notes in Computer Science, no. 6518, pp. 25–36. Berlin, Germany: Springer; ( 10.1007/978-3-642-18305-8_3) [DOI] [Google Scholar]
- 14.Genot AJ, Bath J, Turberfield AJ. 2011. Reversible logic circuits made of DNA. J. Am. Chem. Soc. 133, 20 080–20 083. ( 10.1021/ja208497p) [DOI] [PubMed] [Google Scholar]
- 15.Fujii T, Rondelez Y. 2012. Predator–prey molecular ecosystems. ACS Nano 7, 27–34. ( 10.1021/nn3043572) [DOI] [PubMed] [Google Scholar]
- 16.Padirac A, Fujii T, Estévez-Torres A, Rondelez Y. 2013. Spatial waves in synthetic biochemical networks. J. Am. Chem. Soc. 135, 14 586–14 592. ( 10.1021/ja403584p) [DOI] [PubMed] [Google Scholar]
- 17.Padirac A. 2012. Tailoring spatiotemporal dynamics with DNA circuits. Doctoral dissertation, University of Lyon. [Google Scholar]
- 18.Hasatani K, Leocmach M, Genot AJ, Estevez-Torres A, Fujii T, Rondelez Y. 2013. High-throughput observation of compartmentalized biochemical oscillators. Chem. Commun. 49, 8090–8092. ( 10.1039/c3cc44323j) [DOI] [PubMed] [Google Scholar]
- 19.Kim J, Hopfield JJ, Winfree E. 2004. Neural network computation by in vitro transcriptional circuits. Adv. Neural Inf. 17, 681–688. [Google Scholar]
- 20.Wong WW, Tsai TY, Liao JC. 2007. Single-cell zeroth-order protein degradation enhances the robustness of synthetic oscillator. Mol. Syst. Biol. 3, 130 ( 10.1038/msb4100172) [DOI] [PMC free article] [PubMed] [Google Scholar]
- 21.Rondelez Y. 2012. Competition for catalytic resources alters biological network dynamics. Phys. Rev. Lett. 108, 018102 ( 10.1103/PhysRevLett.108.018102) [DOI] [PubMed] [Google Scholar]
- 22.Zhang DY, Winfree E. 2009. Control of DNA strand displacement kinetics using toehold exchange. J. Am. Chem. Soc. 131, 17 303–17 314. ( 10.1021/ja906987s) [DOI] [PubMed] [Google Scholar]
- 23.Kim J, Winfree E. 2011. Synthetic in vitro transcriptional oscillators. Mol. Syst. Biol. 7, 465 ( 10.1038/msb.2010.119) [DOI] [PMC free article] [PubMed] [Google Scholar]
- 24.Zaikin AN, Zhabotinsky AM. 1970. Concentration wave propagation in two-dimensional liquid-phase self-oscillating system. Nature 225, 535–537. ( 10.1038/225535b0) [DOI] [PubMed] [Google Scholar]
- 25.Goodwin BC. 1965. Oscillatory behavior in enzymatic control processes. Adv. Enzyme Regul. 3, 425–437. ( 10.1016/0065-2571(65)90067-1) [DOI] [PubMed] [Google Scholar]
- 26.Elowitz MB, Leibler S. 2000. A synthetic oscillatory network of transcriptional regulators. Nature 403, 335–338. ( 10.1038/35002125) [DOI] [PubMed] [Google Scholar]
- 27.Barabàsi AL, Oltvai ZN. 2004. Network biology: understanding the cell's functional organization. Nat. Rev. Genet. 5, 101–113. ( 10.1038/nrg1272) [DOI] [PubMed] [Google Scholar]
- 28.Hill AV. 1910. The possible effects of the aggregation of the molecules of haemoglobin on its dissociation curves. J. Physiol. 40, 4–7. [Google Scholar]
- 29.Baccouche A, Montagne K, Padirac A, Rondelez Y. Submitted Dynamic DNA-toolbox reaction circuits: a walkthrough. [DOI] [PubMed] [Google Scholar]
- 30.Lakin MR, Youssef S, Polo F, Emmott S, Phillips A. 2011. Visual DSD: a design and analysis tool for DNA strand displacement systems. Bioinformatics 27, 3211–3213. ( 10.1093/bioinformatics/btr543) [DOI] [PMC free article] [PubMed] [Google Scholar]
- 31.Lakin MR, Parker D, Cardelli L, Kwiatkowska M, Phillips A. 2012. Design and analysis of DNA strand displacement devices using probabilistic model checking. J. R. Soc. Interface 9, 1470–1485. ( 10.1098/rsif.2011.0800) [DOI] [PMC free article] [PubMed] [Google Scholar]
- 32.Genot AJ, Fujii T, Rondelez Y. 2012. Computing with competition in biochemical networks. Phys. Rev. Lett. 109, 208102 ( 10.1103/PhysRevLett.109.208102) [DOI] [PubMed] [Google Scholar]
- 33.Genot AJ, Fujii T, Rondelez Y. 2013. Scaling down DNA circuits with competitive neural networks. J. R. Soc. Interface 10, 20130212 ( 10.1098/rsif.2013.0212) [DOI] [PMC free article] [PubMed] [Google Scholar]
- 34.Hucka M, et al. 2003. The systems biology markup language (SBML): a medium for representation and exchange of biochemical network models. Bioinformatics 19, 524–531. ( 10.1093/bioinformatics/btg015) [DOI] [PubMed] [Google Scholar]
- 35.Finney A, Hucka M. 2003. Systems biology markup language: level 2 and beyond. Biochem. Soc. Trans. 31, 1472–1473. ( 10.1042/BST0311472) [DOI] [PubMed] [Google Scholar]
- 36.Zadeh JN, Steenberg CD, Bois JS, Wolfe BR, Pierce MB, Khan AR, Dirks RM, Pierce NA. 2011. NUPACK: analysis and design of nucleic acid systems. J. Comput. Chem. 32, 170–173. ( 10.1002/jcc.21596) [DOI] [PubMed] [Google Scholar]
- 37.Markham NR, Zuker M. 2005. DINAMelt web server for nucleic acid melting prediction. Nucleic Acids Res. 33, W577–W581. ( 10.1093/nar/gki591) [DOI] [PMC free article] [PubMed] [Google Scholar]
- 38.Markham NR, Zuker M. 2008. UNAFold: software for nucleic acid folding and hybridization. Methods Mol. Biol. 453, 3–31 ( 10.1007/978-1-60327-429-6_1) [DOI] [PubMed] [Google Scholar]
- 39.Hoops S, et al. 2006. COPASI: a complex pathway simulator. Bioinformatics 22, 3067–3074. ( 10.1093/bioinformatics/btl485) [DOI] [PubMed] [Google Scholar]
- 40.Rothemund PW. 2006. Folding DNA to create nanoscale shapes and patterns. Nature 440, 297–302. ( 10.1038/nature04586) [DOI] [PubMed] [Google Scholar]
- 41.Wei B, Dai M, Yin P. 2012. Complex shapes self-assembled from single-stranded DNA tiles. Nature 485, 623–626. ( 10.1038/nature11075) [DOI] [PMC free article] [PubMed] [Google Scholar]
- 42.Ke Y, Ong LL, Shih WM, Yin P. 2012. Three-dimensional structures self-assembled from DNA bricks. Science 338, 1177–1183. ( 10.1126/science.1227268) [DOI] [PMC free article] [PubMed] [Google Scholar]
- 43.Douglas SM, Marblestone AH, Teerapittayanon S, Vazquez A, Church GM, Shih WM. 2009. Rapid prototyping of 3D DNA-origami shapes with caDNAno. Nucleic Acids Res. 37, 5001–5006. ( 10.1093/nar/gkp436) [DOI] [PMC free article] [PubMed] [Google Scholar]
- 44.Castro CE, Kilchherr F, Kim D-N, Shiao EL, Wauer T, Wortmann P, Bathe M, Dietz H. 2011. A primer to scaffolded DNA origami. Nat. Methods 8, 221–229. ( 10.1038/nmeth.1570) [DOI] [PubMed] [Google Scholar]
- 45.Plasson R, Rondelez Y. 2013. Synthetic biochemical dynamic circuits. In Multiscale analysis and nonlinear dynamics: from genes to the brain, pp. 113–145. Weinheim, Germany: Wiley-VCH; ( 10.1002/9783527671632.ch05) [DOI] [Google Scholar]
- 46.Zhang DY, Turberfield AJ, Yurke B, Winfree E. 2007. Engineering entropy-driven reactions and networks catalyzed by DNA. Science 318, 1121–1125. ( 10.1126/science.1148532) [DOI] [PubMed] [Google Scholar]
- 47.O'Madadhain J, Fisher D, Smyth P, White S, Boey YB. 2005. Analysis and visualization of network data using JUNG. J. Stat. Softw. 10, 1–25. [Google Scholar]
- 48.Gilbert D. 2002. The JFreeChart class library, developer guide. Harpenden, UK: Object Refinery. [Google Scholar]
- 49.Hairer E, Nørsett SP, Wanner G. 1987. Solving ordinary differential equations I. Nonstiff problems. Berlin, Germany: Springer. [Google Scholar]
- 50.Hansen N, Ostermeier A. 1996. Adapting arbitrary normal mutation distributions in evolution strategies: the covariance matrix adaptation. In Proc. IEEE Int. Conf. on Evolutionary Computation, Nagoya, Japan, 20–22 May 1996, pp. 312–317. ( 10.1109/ICEC.1996.542381) [DOI] [Google Scholar]
- 51.Dinh QH, et al. In press. An effective method for evolving reaction network in synthetic biochemical systems. IEEE Trans. Evolut. Comput. [Google Scholar]
- 52.Aubert N, et al. 2013. Evolving cheating DNA networks: a case study with the rock-paper-scissors game. In Advances in artificial life, ECAL, vol. 12, pp. 1143–1150. Cambridge, MA: MIT Press. [Google Scholar]
- 53.Franco E, Friedrichs E, Kim J, Jungmann R, Murray R, Winfree E, Simmel FC. 2011. Timing molecular motion and production with a synthetic transcriptional clock. Proc. Natl Acad. Sci. USA 108, E784–E793. ( 10.1073/pnas.1100060108) [DOI] [PMC free article] [PubMed] [Google Scholar]
- 54.Pyshnyi DV, Ivanova EM. 2004. The influence of nearest neighbours on the efficiency of coaxial stacking at contiguous stacking hybridization of oligodeoxyribonucleotides. Nucleos. Nucleot. Nucl. Acids 23, 1057–1064. ( 10.1081/NCN-200026071) [DOI] [PubMed] [Google Scholar]
- 55.Qian J, Ferguson TM, Shinde DN, Ramirez-Borrero AJ, Hintze A, Adami C, Niemz A. 2012. Sequence dependence of isothermal DNA amplification via EXPAR. Nucleic Acids Res. 40, e87 ( 10.1093/nar/gks230) [DOI] [PMC free article] [PubMed] [Google Scholar]
- 56.Hagiya M, Kawamata I, Aubert N. 2013. Towards persistent molecular computers for molecular robots. In Proc. 19th Int. Conf. on DNA Computing and Molecular Programming, Tempe, AZ, USA, 22–27 September 2013. [Google Scholar]
- 57.Warmflash A, Francois P, Siggia ED. 2012. Pareto evolution of gene networks: an algorithm to optimize multiple fitness objectives. Phys. Biol. 9, 056001 ( 10.1088/1478-3975/9/5/056001) [DOI] [PMC free article] [PubMed] [Google Scholar]