Abstract
Background
An outcome measure to evaluate the neurological function of patients with cervical myelopathy was proposed by the Japanese Orthopaedic Association (JOA score) and has been widely used in Japan. However, the JOA score does not include patients’ satisfaction, disability, handicaps, or general health, which can be affected by cervical myelopathy. In 2007, a new outcome measure, the Japanese Orthopaedic Association Cervical Myelopathy Evaluation Questionnaire (JOACMEQ), which is a self-administered questionnaire, was developed. However, the influence of age and gender on the scores has not been fully examined. The purpose of this study was to establish the standard value of the JOACMEQ by age using healthy volunteers.
Methods
This study was conducted in 23 university hospitals and their affiliated hospitals from September to December 2011. The questionnaire included 24 questions for evaluation of physical function of the cervical spine and spinal cord. A total of 1,629 healthy volunteers were recruited for the study. The ages ranged from 20 to 89 years old.
Results
The volunteers comprised 798 men and 831 women. In the elderly healthy volunteers, the JOACMEQ scores decreased with age. In general, the scores for cervical spine function and upper/lower extremity function were retained up to the 60s, then decreased in the 70s and 80s. The scores for quality of life were retained up to the 70s; however, the score for bladder function was retained up to the 40s, then declined with age from the 50s to 80s.
Conclusion
The standard values of the JOACMEQ by age were established. Differences in the scores were found among different generations. Patients with cervical myelopathy should be evaluated with this new self-administered questionnaire taking into account the standard values according to different ages.
Introduction
The members of the Subcommittee on the Evaluation of Low Back Pain and Cervical Myelopathy, who belong to the Clinical Outcomes Committee of the Japanese Orthopaedic Association, have composed a new self-administered questionnaire, the Japanese Orthopaedic Association Cervical Myelopathy Evaluation Questionnaire (JOACMEQ), as a new outcome measure for patients with cervical myelopathy [1] to solve problems associated with the Japanese Orthopaedic Association score (JOA score), which was established by the Japanese Orthopaedic Association in 1975 [2] and was revised in 1994 [3]. The JOACMEQ provides specific outcome measures including patients’ disability, handicaps, and general health, which are necessary to evaluate severity and treatment results in patients with cervical myelopathy. It has been used in many institutions nationwide. However, the influence of age and gender on the scores has not been fully examined, and there is a concern that the age-related decline in scores may influence the evaluation. Therefore, standard values according to age using the data of physically unimpaired persons are needed to validate this new self-administered questionnaire. The purpose of the current study was to establish the standard values of the JOACMEQ according to different ages using the results of healthy volunteers in their 20s up to 80s.
Materials and methods
This study was conducted in 23 university hospitals and their affiliated hospitals from September to December in 2011. A total of 1,644 healthy volunteers were recruited for the study. They were self-supporting and required no medical assistance for orthopedic diseases. Subjects with cognitive impairment who could not understand the questionnaires and those who were under treatment for orthopedic disorders and/or had a history of operation for spinal disorders including the cervical spine were excluded from the study. Medical professionals were also excluded from the subjects. The healthy volunteers were grouped by gender and decade from 20 to 80 years of age. Five healthy individuals within each age group and from both genders were surveyed at each institution. This study was reviewed and approved by the institutional review board of each institution, and all subjects provided informed consent prior to the inclusion to the study.
The questionnaire included 24 questions in five domains, cervical spine function, upper extremity function, lower extremity function, bladder function, and quality of life. Visual analog (VAS) scales were used to evaluate the degree of pain or stiffness in the neck or shoulders, tightness in the chest, pain or numbness in the arms or hands, and pain or numbness from the chest to toes (Table 1). A respondent recalled his or her physical condition during the previous 1 week and circled the number of an answer for each question that best fit his or her condition. If a respondent’s condition changed depending on the day or the time, he or she circled the number representing “the worst condition.” The JOACMEQ score was calculated as: cervical spine function: Q1-1 × 20 + Q1-2 × 10 + Q1-3 × 15 + Q1-4 × 5 − 50; upper extremity function: (Q1-4 × 5 + Q2-1 × 10 + Q2-2 × 15 + Q2-3 × 5 + Q3-1 × 5 − 40) × 100 ÷ 95; lower extremity function: Q3-1 × 10 + Q3-2 × 10 + Q3-3 × 15 + Q3-4 × 5 + Q3-5 × 5 − 45) × 100 ÷ 110; bladder function: (Q4-1 × 10 + Q4-2 × 5 + Q4-3 × 10 + Q4-4 × 5 − 30) × 100 ÷ 80; quality of life: (Q5-1 × 3 + Q5-2 × 2 + Q5-3 × 2 + Q5-4 × 5 + Q5-5 × 4 + Q5-6 × 3 + Q5-7 × 2 + Q5-8 × 3 − 24) × 100 ÷ 96. The score of each domain ranges from 0 to 100 points, which is proportional to the patients’ clinical conditions [4–6].
Table 1.
The JOA Cervical Myelopathy Evaluation Questionnaire (JOACMEQ)
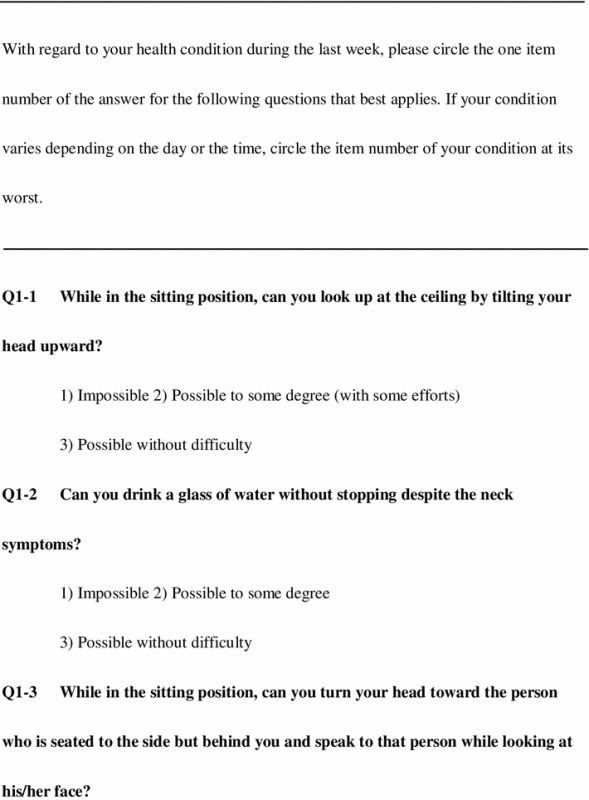
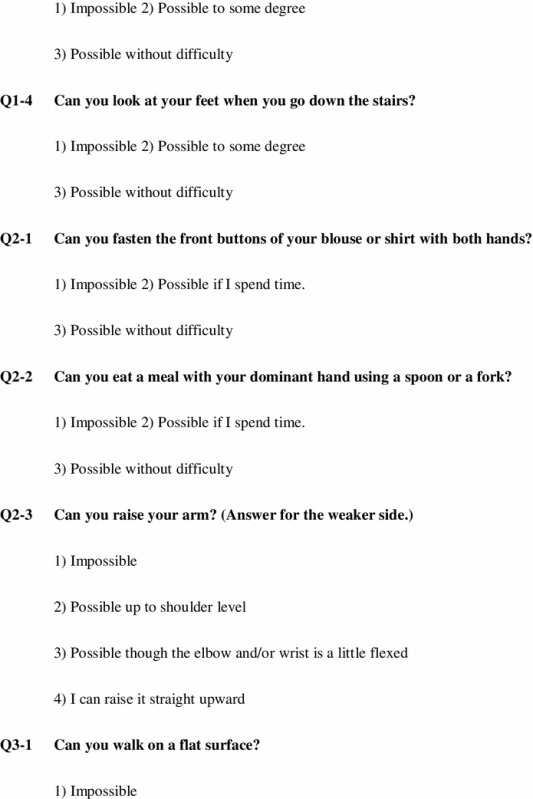
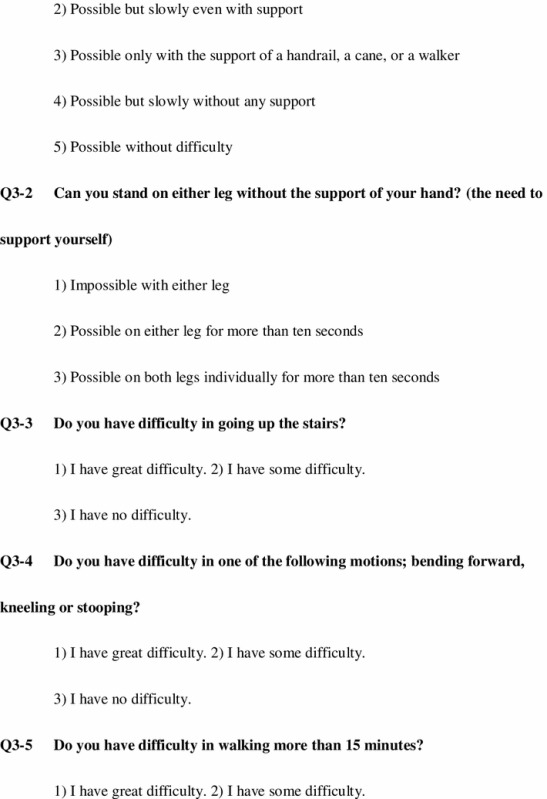
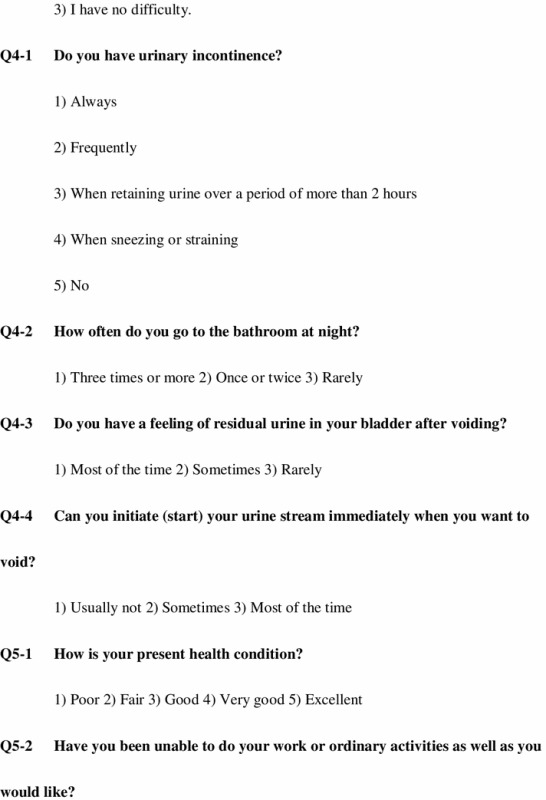
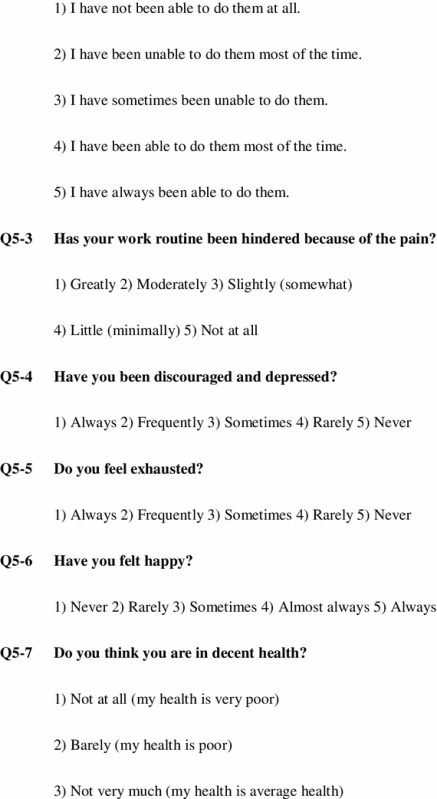
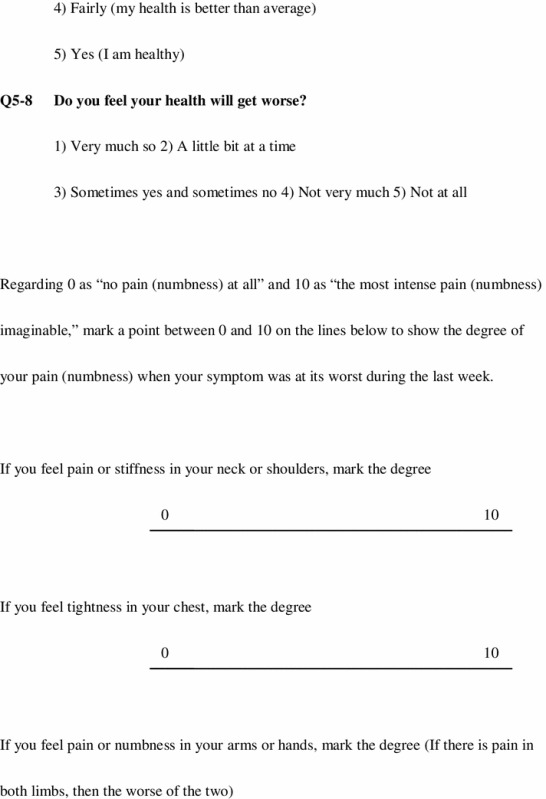
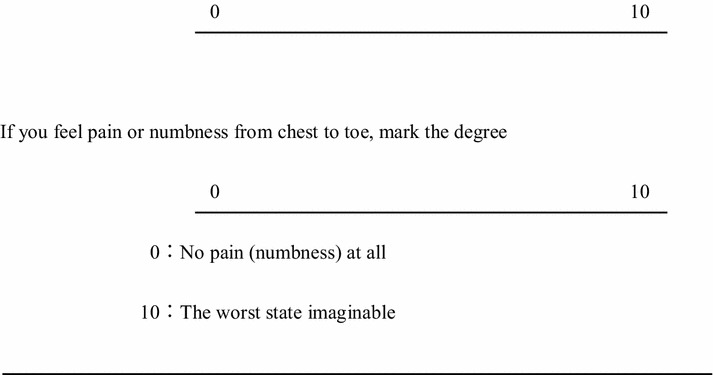
The data of those over 90 years old were extracted from the study; then the answers of 1,629 volunteers were used for the analysis. Irrelevant data where subjects did not respond to all the questions or clearly inappropriate answers in which subjects did not follow instructions were excluded from the analyses for each domain. The Steel–Dwass test was used for multiple comparisons among different generations, and the Jonckheere-Terpstra test was used to determine age trends in each gender by domain. P < 0.05 was considered significant.
Results
The volunteers comprised 798 men and 831 women. The gender and age distributions of the volunteers are shown in Table 2. The distribution of the scores for each domain in the JOACMEQ (from 10th to 90th percentile) are shown in Tables 3, 4, 5, 6, and 7. In the elderly healthy volunteers, the JOACMEQ scores decreased with age. The average score for cervical spine function was more than 90 points in the younger generation from the 20s to 60s, and in those in their 70s and 80s, the average score decreased to 80 points and 70 points, respectively (Table 3). There were significant differences in the average scores between the younger generation in their 20s to 60s and the elderly generation in their 80s in both genders. The average score for upper extremity function was more than 95 points in those in their 20s to 70s and decreased to 80 points for those in their 80s in both genders (Table 4). There were also significant differences in the average scores between the younger generations and elderly in their 80s in both genders. The average lower extremity function score was more than 95 points in those in their 20s to 60s in males and decreased to 70 points in their 80s. In females, the average score was more than 95 points in those in their 20s to 40s and decreased to <95 points in their 50s and 60s; in 70s and 80s, the average score further decreased to 80 points and 60 points, respectively (Table 5). There were significant differences in the average scores between the younger generation below 70 years of age and elderly generation above 70 in both genders. The average bladder function score was more than 90 points in the young generations in their 20s to 50s in both genders; the average score decreased to 80 points in those in their 60s and 70s and to 70 points in their 80s in both genders (Table 6). There were significant differences in the average scores between the younger generations in their 20s to 40s and elderly generations in their 50s to 80s in both genders. The average quality of life score of each generation was approximately 70 points in the generations in their 20s to 60s in both genders and decreased to the 60–70 points in their 70s in males and at 70s and 80s in females (Table 7). There were significant differences in the average scores between the younger generations and elderly generation in their 80s in both genders. With regard to the age trend on the Jonckheere–Terpstra test, scores tended to decrease in the five domains as age increased in both genders.
Table 2.
Gender and age distribution of volunteers
| Age groups (years) | Male | Female | Total |
|---|---|---|---|
| 20–29 | 115 | 120 | 235 |
| 30–39 | 122 | 117 | 239 |
| 40–49 | 117 | 120 | 237 |
| 50–59 | 113 | 123 | 236 |
| 60–69 | 118 | 122 | 240 |
| 70–79 | 109 | 117 | 226 |
| 80–89 | 104 | 112 | 216 |
| Total | 798 | 831 | 1,629 |
Table 3.
Distribution of scores for domains in the JOACMEQ; cervical spine function
| Cervical spine function | Male | 20–29 | 30–39 | 40–49 | 50–59 | 60–69 | 70–79 | 80–89 | Female | 20–29 | 30–39 | 40–49 | 50–59 | 60–69 | 70–79 | 80–89 |
|---|---|---|---|---|---|---|---|---|---|---|---|---|---|---|---|---|
| Number | Valid | 115 | 120 | 117 | 113 | 118 | 106 | 102 | Valid | 119 | 115 | 118 | 121 | 121 | 115 | 109 |
| Invalid | 0 | 2 | 0 | 0 | 0 | 3 | 2 | Invalid | 1 | 2 | 2 | 2 | 1 | 2 | 3 | |
| Average | 96.9 | 98.4 | 97.0 | 93.8 | 95.0 | 86.9 | 74.9* | 98.1 | 97.6 | 97.1 | 94.9 | 93.1 | 87.4 | 79.7* | ||
| Median | 100.0 | 100.0 | 100.0 | 100.0 | 100.0 | 100.0 | 85.0 | 100.0 | 100.0 | 100.0 | 100.0 | 100.0 | 100.0 | 90.0 | ||
| Standard deviation | 12.2 | 6.7 | 8.5 | 12.6 | 10.0 | 21.5 | 27.7 | 6.3 | 5.6 | 8.1 | 10.3 | 15.6 | 21.5 | 22.6 | ||
| Percentile | 10.0 | 90.0 | 100.0 | 85.0 | 80.0 | 75.0 | 57.0 | 31.5 | 10.0 | 90.0 | 88.0 | 85.0 | 80.0 | 75.0 | 58.0 | 40.0 |
| 25.0 | 100.0 | 100.0 | 100.0 | 87.5 | 97.5 | 85.0 | 55.0 | 25.0 | 100.0 | 100.0 | 100.0 | 95.0 | 90.0 | 80.0 | 65.0 | |
| 50.0 | 100.0 | 100.0 | 100.0 | 100.0 | 100.0 | 100.0 | 85.0 | 50.0 | 100.0 | 100.0 | 100.0 | 100.0 | 100.0 | 100.0 | 90.0 | |
| 75.0 | 100.0 | 100.0 | 100.0 | 100.0 | 100.0 | 100.0 | 100.0 | 75.0 | 100.0 | 100.0 | 100.0 | 100.0 | 100.0 | 100.0 | 100.0 | |
| 90.0 | 100.0 | 100.0 | 100.0 | 100.0 | 100.0 | 100.0 | 100.0 | 90.0 | 100.0 | 100.0 | 100.0 | 100.0 | 100.0 | 100.0 | 100.0 |
* p < 0.05; the average scores were significantly lower than those in the young generations in their 20s to 60s in both genders
Table 4.
Distribution of scores for domains in the JOACMEQ; upper extremity function
| Upper extremity function | Male | 20–29 | 30–39 | 40–49 | 50–59 | 60–69 | 70–79 | 80–89 | Female | 20–29 | 30–39 | 40–49 | 50–59 | 60–69 | 70–79 | 80–89 |
|---|---|---|---|---|---|---|---|---|---|---|---|---|---|---|---|---|
| Number | Valid | 115 | 121 | 116 | 113 | 117 | 107 | 103 | Valid | 120 | 114 | 120 | 122 | 122 | 117 | 109 |
| Invalid | 0 | 1 | 1 | 0 | 1 | 2 | 1 | Invalid | 0 | 3 | 0 | 1 | 0 | 0 | 3 | |
| Average | 99.0 | 99.7 | 99.6 | 99.2 | 99.0 | 96.9 | 88.4* | 100.0 | 99.8 | 99.9 | 98.9 | 98.5 | 96.3 | 88.1* | ||
| Median | 100.0 | 100.0 | 100.0 | 100.0 | 100.0 | 100.0 | 95.0 | 100.0 | 100.0 | 100.0 | 100.0 | 100.0 | 100.0 | 95.0 | ||
| Standard deviation | 6.3 | 1.6 | 1.7 | 2.6 | 3.9 | 9.2 | 16.4 | 0.5 | 1.6 | 0.6 | 3.1 | 5.3 | 10.6 | 16.0 | ||
| Percentile | 10.0 | 100.0 | 100.0 | 100.0 | 95.0 | 100.0 | 89.0 | 65.0 | 10.0 | 100.0 | 100.0 | 100.0 | 95.0 | 95.0 | 89.0 | 68.0 |
| 25.0 | 100.0 | 100.0 | 100.0 | 100.0 | 100.0 | 100.0 | 84.0 | 25.0 | 100.0 | 100.0 | 100.0 | 100.0 | 100.0 | 95.0 | 81.5 | |
| 50.0 | 100.0 | 100.0 | 100.0 | 100.0 | 100.0 | 100.0 | 95.0 | 50.0 | 100.0 | 100.0 | 100.0 | 100.0 | 100.0 | 100.0 | 95.0 | |
| 75.0 | 100.0 | 100.0 | 100.0 | 100.0 | 100.0 | 100.0 | 100.0 | 75.0 | 100.0 | 100.0 | 100.0 | 100.0 | 100.0 | 100.0 | 100.0 | |
| 90.0 | 100.0 | 100.0 | 100.0 | 100.0 | 100.0 | 100.0 | 100.0 | 90.0 | 100.0 | 100.0 | 100.0 | 100.0 | 100.0 | 100.0 | 100.0 |
* p < 0.05; the average scores were significantly lower than those in the young generations in their 20s to 70s in both genders
Table 5.
Distribution of scores for domains in the JOACMEQ; lower extremity function
| Lower extremity function | Male | 20–29 | 30–39 | 40–49 | 50–59 | 60–69 | 70–79 | 80–89 | Female | 20–29 | 30–39 | 40–49 | 50–59 | 60–69 | 70–79 | 80–89 |
|---|---|---|---|---|---|---|---|---|---|---|---|---|---|---|---|---|
| Number | Valid | 115 | 121 | 117 | 112 | 116 | 109 | 103 | Valid | 119 | 113 | 118 | 121 | 120 | 114 | 111 |
| Invalid | 0 | 1 | 0 | 1 | 2 | 0 | 1 | Invalid | 1 | 4 | 2 | 2 | 2 | 3 | 1 | |
| Average | 98.6 | 97.8 | 97.9 | 96.3 | 95.8 | 90.4* | 73.2* | 97.0 | 97.9 | 96.9 | 94.4 | 94.5 | 88.0* | 63.7* | ||
| Median | 100.0 | 100.0 | 100.0 | 100.0 | 100.0 | 100.0 | 77.0 | 100.0 | 100.0 | 100.0 | 100.0 | 100.0 | 95.0 | 68.0 | ||
| Standard deviation | 4.1 | 6.7 | 5.5 | 8.0 | 10.0 | 15.6 | 25.6 | 7.0 | 6.1 | 7.6 | 9.9 | 11.2 | 17.4 | 27.0 | ||
| Percentile | 10.0 | 95.0 | 95.0 | 91.0 | 83.2 | 80.5 | 68.0 | 27.0 | 10.0 | 86.0 | 92.6 | 82.0 | 77.0 | 77.0 | 66.0 | 23.0 |
| 25.0 | 100.0 | 100.0 | 100.0 | 96.3 | 95.0 | 86.0 | 59.0 | 25.0 | 100.0 | 100.0 | 100.0 | 95.0 | 95.0 | 82.0 | 45.0 | |
| 50.0 | 100.0 | 100.0 | 100.0 | 100.0 | 100.0 | 100.0 | 77.0 | 50.0 | 100.0 | 100.0 | 100.0 | 100.0 | 100.0 | 95.0 | 68.0 | |
| 75.0 | 100.0 | 100.0 | 100.0 | 100.0 | 100.0 | 100.0 | 95.0 | 75.0 | 100.0 | 100.0 | 100.0 | 100.0 | 100.0 | 100.0 | 86.0 | |
| 90.0 | 100.0 | 100.0 | 100.0 | 100.0 | 100.0 | 100.0 | 100.0 | 90.0 | 100.0 | 100.0 | 100.0 | 100.0 | 100.0 | 100.0 | 99.0 |
* p < 0.05; the average scores were significantly lower than those in young generations in their 20s to 60s in both genders
Table 6.
Distribution of scores for domains in the JOACMEQ; bladder function
| Bladder function | Male | 20–29 | 30–39 | 40–49 | 50–59 | 60–69 | 70–79 | 80–89 | Female | 20–29 | 30–39 | 40–49 | 50–59 | 60–69 | 70–79 | 80–89 |
|---|---|---|---|---|---|---|---|---|---|---|---|---|---|---|---|---|
| Number | Valid | 113 | 120 | 114 | 112 | 117 | 108 | 102 | Valid | 118 | 116 | 120 | 120 | 120 | 113 | 106 |
| Invalid | 2 | 2 | 3 | 1 | 1 | 1 | 2 | Invalid | 2 | 1 | 0 | 3 | 2 | 4 | 6 | |
| Average | 97.1 | 94.9 | 94.1 | 90.1* | 87.5* | 83.2* | 72.1* | 97.5 | 97.5 | 95.2 | 91.2* | 89.6* | 84.2* | 75.1* | ||
| Median | 100.0 | 100.0 | 100.0 | 94.0 | 94.0 | 88.0 | 75.0 | 100.0 | 100.0 | 100.0 | 94.0 | 94.0 | 88.0 | 81.0 | ||
| Standard deviation | 6.5 | 8.0 | 9.2 | 10.3 | 12.9 | 15.5 | 22.2 | 6.7 | 5.3 | 6.8 | 9.4 | 10.2 | 13.8 | 20.0 | ||
| Percentile | 10.0 | 88.0 | 81.0 | 81.0 | 75.0 | 69.0 | 62.0 | 38.0 | 10.0 | 88.0 | 88.0 | 88.0 | 81.0 | 75.0 | 64.8 | 44.0 |
| 25.0 | 100.0 | 88.0 | 94.0 | 82.8 | 81.0 | 75.0 | 62.0 | 25.0 | 100.0 | 100.0 | 88.0 | 88.0 | 81.0 | 81.0 | 62.0 | |
| 50.0 | 100.0 | 100.0 | 100.0 | 94.0 | 94.0 | 88.0 | 75.0 | 50.0 | 100.0 | 100.0 | 100.0 | 94.0 | 94.0 | 88.0 | 81.0 | |
| 75.0 | 100.0 | 100.0 | 100.0 | 100.0 | 97.0 | 94.0 | 94.0 | 75.0 | 100.0 | 100.0 | 100.0 | 100.0 | 100.0 | 94.0 | 94.0 | |
| 90.0 | 100.0 | 100.0 | 100.0 | 100.0 | 100.0 | 100.0 | 94.0 | 90.0 | 100.0 | 100.0 | 100.0 | 100.0 | 100.0 | 100.0 | 94.0 |
* p < 0.05; the average scores were significantly lower than those in young generations in their 20s to 40s in both genders
Table 7.
Distribution of scores for domains in the JOACMEQ; quality of life
| Quality of life | Male | 20–29 | 30–39 | 40–49 | 50–59 | 60–69 | 70–79 | 80–89 | Female | 20–29 | 30–39 | 40–49 | 50–59 | 60–69 | 70–79 | 80–89 |
|---|---|---|---|---|---|---|---|---|---|---|---|---|---|---|---|---|
| Number | Valid | 113 | 121 | 116 | 112 | 117 | 106 | 103 | Valid | 114 | 114 | 117 | 120 | 118 | 112 | 108 |
| Invalid | 2 | 1 | 1 | 1 | 1 | 3 | 1 | Invalid | 6 | 3 | 3 | 3 | 4 | 5 | 4 | |
| Average | 75.7 | 70.6 | 68.5 | 66.2 | 70.3 | 68.5 | 60.2* | 73.0 | 70.5 | 65.7 | 64.2 | 67.5 | 64.3 | 58.9* | ||
| Median | 77.0 | 70.0 | 69.5 | 65.5 | 72.0 | 72.0 | 61.0 | 73.5 | 69.0 | 64.0 | 65.0 | 67.5 | 63.0 | 57.0 | ||
| Standard deviation | 16.0 | 14.6 | 13.2 | 16.3 | 14.0 | 15.9 | 18.5 | 15.8 | 13.0 | 13.4 | 13.6 | 14.4 | 16.3 | 17.2 | ||
| Percentile | 10.0 | 51.4 | 53.0 | 52.0 | 46.0 | 49.8 | 46.7 | 38.4 | 10.0 | 54.0 | 55.0 | 49.0 | 49.1 | 48.0 | 45.0 | 38.9 |
| 25.0 | 65.5 | 62.0 | 60.0 | 56.3 | 60.5 | 57.8 | 46.0 | 25.0 | 64.0 | 61.0 | 57.5 | 54.0 | 57.8 | 52.0 | 47.0 | |
| 50.0 | 77.0 | 70.0 | 69.5 | 65.5 | 72.0 | 72.0 | 61.0 | 50.0 | 73.5 | 69.0 | 64.0 | 65.0 | 67.5 | 63.0 | 57.0 | |
| 75.0 | 86.0 | 82.0 | 76.0 | 77.0 | 80.5 | 79.3 | 74.0 | 75.0 | 83.3 | 79.3 | 74.5 | 73.0 | 77.0 | 77.0 | 71.0 | |
| 90.0 | 97.0 | 88.8 | 84.0 | 88.7 | 89.0 | 89.3 | 83.0 | 90.0 | 95.5 | 89.0 | 83.2 | 80.9 | 88.0 | 85.7 | 82.0 |
* p < 0.05; the average scores were significantly lower than those in young generations in their 20s to 60s in both genders
The scores for each domain in the VAS for pain or stiffness in the neck or shoulders, tightness in the chest, pain or numbness in the arms or hands, and pain or numbness from the chest to toe are shown in Tables 8, 9, 10, and 11. The volunteers recorded the VAS scores as a mark on the bar scale as a value according to the instructions in the attached document. However, if both a mark on the bar scale and a numerical value on the sheet were present, the former was used for the analysis. The VAS scores for all domains increased with age; however, the score for pain or stiffness in the neck or shoulders in females tended to decrease with age (Table 8). The scores of the generation in their 40s and 50s for females were significantly higher than those of the elderly in their 70s and 80s. Tightness in the chest was not a frequent complaint in either gender (Table 9), and there were no significant differences in the scores among different generations in either gender. The VAS score for pain or numbness in the arms or hands was more frequent in males in those who were in their 60s and above and in their 50s and above in females, and it was a common complaint in the 80s in both genders (Table 10). There were significant differences in the scores between the younger generation and elderly in their 80s in both genders. Also, the score for pain or numbness from the chest to toe was more frequent in those over 60 years in males and over 50 years in females, with a particularly high incidence in those in their 80s in both genders (Table 11). In male volunteers, there were significant differences in the scores between the younger generations in their 20s to 50s and elderly generations in their 60s to 80s, and in females, there were significant differences in the scores between the younger generations in their 20s to 60s and elderly in their 70s and 80s. Regarding age trends among the VAS scores, the scores tended to increase with age in both genders across all domains, except neck stiffness in women, which showed a tendency to decrease with an increase in age.
Table 8.
Distribution of scores in VAS scales for pain or stiffness in the neck or shoulders
| Pain or stiffness in the neck or shoulders | Male | 20–29 | 30–39 | 40–49 | 50–59 | 60–69 | 70–79 | 80–89 | Female | 20–29 | 30–39 | 40–49 | 50–59 | 60–69 | 70–79 | 80–89 |
|---|---|---|---|---|---|---|---|---|---|---|---|---|---|---|---|---|
| Number | Valid | 106 | 119 | 111 | 106 | 106 | 101 | 91 | Valid | 118 | 113 | 115 | 117 | 114 | 105 | 109 |
| Invalid | 9 | 3 | 6 | 7 | 12 | 8 | 13 | Invalid | 2 | 4 | 5 | 6 | 8 | 12 | 3 | |
| Average | 17.2 | 23.4 | 28.5 | 27.2 | 20.1 | 21.5 | 29.2 | 28.1 | 33.0 | 36.1* | 41.2* | 31.0 | 22.2 | 24.6 | ||
| Median | 9.5 | 15.0 | 20.0 | 17.5 | 15.5 | 11.0 | 26.0 | 20.0 | 28.0 | 31.0 | 39.0 | 24.0 | 13.0 | 15.0 | ||
| Standard deviation | 21.6 | 25.3 | 27.8 | 27.0 | 22.0 | 26.4 | 28.3 | 28.0 | 27.8 | 25.1 | 30.6 | 26.2 | 24.9 | 27.5 | ||
| Percentile | 10.0 | 0.0 | 0.0 | 0.0 | 0.0 | 0.0 | 0.0 | 0.0 | 10.0 | 0.0 | 0.0 | 6.2 | 0.0 | 0.0 | 0.0 | 0.0 |
| 25.0 | 0.0 | 0.0 | 0.0 | 0.0 | 0.0 | 0.0 | 0.0 | 25.0 | 3.8 | 11.0 | 15.0 | 13.5 | 9.5 | 0.0 | 0.0 | |
| 50.0 | 9.5 | 15.0 | 20.0 | 17.5 | 15.5 | 11.0 | 26.0 | 50.0 | 20.0 | 28.0 | 31.0 | 39.0 | 24.0 | 13.0 | 15.0 | |
| 75.0 | 25.0 | 35.0 | 50.0 | 49.3 | 31.3 | 35.5 | 49.0 | 75.0 | 49.3 | 50.0 | 57.0 | 68.0 | 51.0 | 41.5 | 44.0 | |
| 90.0 | 54.6 | 65.0 | 74.8 | 70.3 | 49.3 | 63.6 | 72.2 | 90.0 | 75.0 | 74.4 | 72.8 | 80.0 | 72.0 | 61.4 | 69.0 |
* p < 0.05; the average scores were significantly higher than those in the elderly in their 70s and 80s in females
Table 9.
Distribution of scores in VAS scales for tightness in the chest
| Tightness in the chest | Male | 20–29 | 30–39 | 40–49 | 50–59 | 60–69 | 70–79 | 80–89 | Female | 20–29 | 30–39 | 40–49 | 50–59 | 60–69 | 70–79 | 80–89 |
|---|---|---|---|---|---|---|---|---|---|---|---|---|---|---|---|---|
| Number | Valid | 108 | 120 | 114 | 107 | 105 | 101 | 94 | Valid | 120 | 115 | 119 | 117 | 111 | 106 | 110 |
| Invalid | 7 | 2 | 3 | 6 | 13 | 8 | 10 | Invalid | 0 | 2 | 1 | 6 | 11 | 11 | 2 | |
| Average | 3.7 | 3.1 | 5.9 | 5.1 | 2.4 | 4.9 | 8.1 | 2.4 | 3.1 | 2.9 | 3.9 | 3.8 | 3.2 | 7.9 | ||
| Median | 0.0 | 0.0 | 0.0 | 0.0 | 0.0 | 0.0 | 0.0 | 0.0 | 0.0 | 0.0 | 0.0 | 0.0 | 0.0 | 0.0 | ||
| Standard deviation | 8.6 | 10.7 | 14.8 | 10.2 | 7.2 | 12.6 | 17.1 | 9.4 | 10.0 | 9.8 | 12.5 | 11.9 | 11.0 | 16.8 | ||
| Percentile | 10.0 | 0.0 | 0.0 | 0.0 | 0.0 | 0.0 | 0.0 | 0.0 | 10.0 | 0.0 | 0.0 | 0.0 | 0.0 | 0.0 | 0.0 | 0.0 |
| 25.0 | 0.0 | 0.0 | 0.0 | 0.0 | 0.0 | 0.0 | 0.0 | 25.0 | 0.0 | 0.0 | 0.0 | 0.0 | 0.0 | 0.0 | 0.0 | |
| 50.0 | 0.0 | 0.0 | 0.0 | 0.0 | 0.0 | 0.0 | 0.0 | 50.0 | 0.0 | 0.0 | 0.0 | 0.0 | 0.0 | 0.0 | 0.0 | |
| 75.0 | 0.0 | 0.0 | 3.0 | 6.0 | 0.0 | 0.0 | 8.0 | 75.0 | 0.0 | 0.0 | 0.0 | 0.0 | 0.0 | 0.0 | 8.0 | |
| 90.0 | 18.0 | 7.9 | 19.0 | 21.0 | 8.0 | 19.8 | 36.0 | 90.0 | 8.0 | 10.0 | 10.0 | 11.6 | 12.6 | 5.3 | 28.5 |
Table 10.
Distribution of scores in VAS scales for pain or numbness in the arms or hands
| Pain or numbness in the arms or hands | Male | 20–29 | 30–39 | 40–49 | 50–59 | 60–69 | 70–79 | 80–89 | Female | 20–29 | 30–39 | 40–49 | 50–59 | 60–69 | 70–79 | 80–89 |
|---|---|---|---|---|---|---|---|---|---|---|---|---|---|---|---|---|
| Number | Valid | 106 | 121 | 112 | 106 | 102 | 102 | 92 | Valid | 118 | 116 | 120 | 121 | 112 | 108 | 108 |
| Invalid | 9 | 1 | 5 | 7 | 16 | 7 | 12 | Invalid | 2 | 1 | 0 | 2 | 10 | 9 | 4 | |
| Average | 3.5 | 4.3 | 6.6 | 6.8 | 9.9 | 12.7 | 20.4* | 3.1 | 4.3 | 6.4 | 10.5 | 10.7 | 11.3 | 16.7* | ||
| Median | 0.0 | 0.0 | 0.0 | 0.0 | 0.0 | 0.0 | 5.0 | 0.0 | 0.0 | 0.0 | 0.0 | 0.0 | 0.0 | 0.0 | ||
| Standard deviation | 10.8 | 12.0 | 17.8 | 13.3 | 17.7 | 22.3 | 29.0 | 8.2 | 12.9 | 13.6 | 18.8 | 18.6 | 23.0 | 25.7 | ||
| Percentile | 10.0 | 0.0 | 0.0 | 0.0 | 0.0 | 0.0 | 0.0 | 0.0 | 10.0 | 0.0 | 0.0 | 0.0 | 0.0 | 0.0 | 0.0 | 0.0 |
| 25.0 | 0.0 | 0.0 | 0.0 | 0.0 | 0.0 | 0.0 | 0.0 | 25.0 | 0.0 | 0.0 | 0.0 | 0.0 | 0.0 | 0.0 | 0.0 | |
| 50.0 | 0.0 | 0.0 | 0.0 | 0.0 | 0.0 | 0.0 | 5.0 | 50.0 | 0.0 | 0.0 | 0.0 | 0.0 | 0.0 | 0.0 | 0.0 | |
| 75.0 | 0.0 | 0.0 | 5.0 | 9.0 | 10.8 | 17.8 | 30.0 | 75.0 | 0.0 | 0.0 | 4.8 | 11.5 | 15.0 | 9.3 | 29.0 | |
| 90.0 | 11.0 | 17.4 | 19.4 | 26.0 | 39.0 | 46.0 | 68.8 | 90.0 | 12.1 | 12.6 | 26.6 | 44.4 | 38.5 | 53.1 | 50.1 |
* p < 0.05; the average scores were significantly larger than those in young generations in their 20s to 40s in both genders
Table 11.
Distribution of scores in VAS scales for pain or numbness from chest to toe
| Pain or numbness from chest to toe | Male | 20–29 | 30–39 | 40–49 | 50–59 | 60–69 | 70–79 | 80–89 | Female | 20–29 | 30–39 | 40–49 | 50–59 | 60–69 | 70–79 | 80–89 |
|---|---|---|---|---|---|---|---|---|---|---|---|---|---|---|---|---|
| Number | Valid | 105 | 122 | 115 | 106 | 105 | 99 | 94 | Valid | 119 | 115 | 120 | 119 | 111 | 108 | 107 |
| Invalid | 10 | 0 | 2 | 7 | 13 | 10 | 10 | Invalid | 1 | 2 | 0 | 4 | 11 | 9 | 5 | |
| Average | 2.3 | 3.3 | 6.1 | 5.5 | 11.0* | 11.9* | 24.4* | 1.9 | 3.6 | 4.7 | 10.2 | 9.8 | 14.0* | 19.1* | ||
| Median | 0.0 | 0.0 | 0.0 | 0.0 | 0.0 | 0.0 | 14.5 | 0.0 | 0.0 | 0.0 | 0.0 | 0.0 | 0.0 | 1.0 | ||
| Standard deviation | 9.5 | 10.0 | 16.9 | 13.9 | 19.7 | 21.2 | 29.1 | 9.0 | 10.6 | 14.1 | 19.3 | 18.9 | 25.2 | 25.3 | ||
| Percentile | 10.0 | 0.0 | 0.0 | 0.0 | 0.0 | 0.0 | 0.0 | 0.0 | 10.0 | 0.0 | 0.0 | 0.0 | 0.0 | 0.0 | 0.0 | 0.0 |
| 25.0 | 0.0 | 0.0 | 0.0 | 0.0 | 0.0 | 0.0 | 0.0 | 25.0 | 0.0 | 0.0 | 0.0 | 0.0 | 0.0 | 0.0 | 0.0 | |
| 50.0 | 0.0 | 0.0 | 0.0 | 0.0 | 0.0 | 0.0 | 14.5 | 50.0 | 0.0 | 0.0 | 0.0 | 0.0 | 0.0 | 0.0 | 1.0 | |
| 75.0 | 0.0 | 0.0 | 2.0 | 4.5 | 18.5 | 13.0 | 43.5 | 75.0 | 0.0 | 0.0 | 0.0 | 16.0 | 11.0 | 19.8 | 38.0 | |
| 90.0 | 4.0 | 11.7 | 20.4 | 17.0 | 34.2 | 46.0 | 74.5 | 90.0 | 0.0 | 14.0 | 17.9 | 50.0 | 33.6 | 64.3 | 56.2 |
* p < 0.05; the average scores were significantly larger than those in young generations in their 20s to 50s in males and in their 20s to 60s in females
Discussion
Spinal cord function related to cervical myelopathy was assessed by the JOA (Japanese Orthopaedic Association) score, which was established in 1975 [2] and revised in 1994 [3]. The original JOA score was used as a functional assessment for cervical myelopathy worldwide, and the high inter- and intraobserver reliability of the score was demonstrated [7]. Although the JOA score attaches importance to the physical function of the upper and lower extremities and bladder dysfunction, the score does not include cervical spine function, including neck pain, a stiff neck, patient satisfaction, disability, or QOL.
The JOACMEQ was developed as a new self-administered questionnaire to measure outcomes in patients with cervical myelopathy [1] to solve problems of the original JOA score. With this new score, specific outcome measures of patient satisfaction, disability, handicaps, and general health, which are necessary information to evaluate patients with cervical myelopathy, are obtained. However, the influence of age and gender on the score has not been examined, and concern exists that the age-related decline may influence the evaluation.
In the current study, 1,629 healthy volunteers were recruited in 23 institutions to establish the standard values of the JOACMEQ by age using data obtained from healthy volunteers in their 20s to 80s.
In the elderly healthy volunteers, the JOACMEQ scores decreased with age. As for upper and lower extremity function, there was a relatively weak influence of age and gender; however, there was a strong influence of aging on bladder function. The bladder function scores were retained only up to 40 years of age, then declined significantly after 50 years. Also in the QOL score, even in the younger volunteers, the average score did not reach the full score of 100.
The authors believe that the standard scores for cervical spine function, upper extremity function, and lower extremity function should be regarded as 95 points for relatively young patients under the age of 60, and for bladder function, the lower limits of the score for healthy subjects should be regarded as 80 points. The QOL scores may not be altered with age or gender, and the standard value should be regarded as over 70 points. There was a significant decrease in the JOACMEQ score in those in their 80s in the current study. These results indicate that persons older than 80 years of age might have accompanying age-related degeneration of the central and/or peripheral nervous systems, impairment of motor functions, and other general complications even if they look healthy.
As for the VAS, an influence of age was also found in the healthy volunteers. Most domains in the VAS were influenced by age-related degenerative diseases of the cervical spine. In the domain of pain or numbness in the arms or hands, the scores in the elderly generation were significantly higher than those in the younger generations. These results may be induced by peripheral arterial diseases or neuropathy that may exist in the elderly population. The VAS in most domains tended to increase with age; however, in females, the VAS for pain or stiffness in the neck or shoulders decreased with age. These findings suggest that pain or stiffness in the neck or shoulders may not be affected by age-related degenerative conditions of the cervical spine, but may be caused by muscular or posture distress related to office work or household work in relatively younger female generations.
The JOACMEQ was designed as a self-administered questionnaire to evaluate spinal functions in myelopathy patients and may be suitable for a relative evaluation in each case and may not be suitable for direct comparison with other patients. We can judge that a treatment is “effective” for a patient if: (1) the patient answers all questions necessary to calculate the score of a domain and an increase of ≥20 points is obtained for that score, or (2) the functional score after treatment is >90 points even if the answers for the unanswered questions were supposed to be the worst possible choice. The effectiveness of the treatment can be evaluated based only on the two above-mentioned conditions [8]. Although these criteria were chosen based on the extensive analysis of a considerable amount of data, which was obtained in a series of previous studies, by the statistics expert, a revision may be necessary for the elderly populations. According to our results, the average functional scores of most domains in normal healthy volunteers were <90 points in the elderly population in the 70s and 80s. In the JOACMEQ, exceptional attention to judgment about the treatment or relative evaluation in the assessment for elderly individuals over 70 years old might be needed.
As for limitations of this study, the detailed medical history and general health of the volunteers were not fully assessed; therefore, potentially unhealthy subjects might have been included in the study group, especially in the elderly generations. Also, the mental status was not investigated to exclude psychiatric diseases. These physical and mental conditions may have affected the score.
In conclusion, the standard values for the five domains of the JOACMEQ were established using healthy volunteers. Physicians should be aware that there are differences in the scores among different generations. Patients with cervical myelopathy should be evaluated with this new self-administered questionnaire, JOACMEQ, taking the standard value in each generation into account. This new self-administered questionnaire can be used to evaluate the outcomes in patients with cervical myelopathy more efficiently and will be helpful to identify the most appropriate surgical and medical treatments, thereby improving medical skills.
Conflict of interest
The authors declare that they have no conflict of interest.
Footnotes
The Clinical Outcome Committee of the Japanese Orthopaedic Association.
The Clinical Outcome Committee of the Japanese Society for Spine Surgery and Related Research.
References
- 1.Fukui M, Chiba K, Kawakami M, Kikuchi S, Konno S, Miyamoto M, Seichi A, Shimamura T, Shirado O, Taguchi T, Takahashi K, Takeshita K, Tani T, Toyama Y, Wada E, Yonenobu K, Tanaka T. Hirota, an outcome measure for patients with cervical myelopathy: Japanese Orthopaedic Association Cervical Myelopathy Evaluation Questionnaire (JOACMEQ): part 1. J Orthop Sci. 2007;12:227–240. doi: 10.1007/s00776-007-1118-1. [DOI] [PMC free article] [PubMed] [Google Scholar]
- 2.Japanese Orthopaedic Association score for cervical spondylotic myelopathy. J Jpn Orthop Assoc. 1975;99 (prefatory note in Japanese).
- 3.Revised Japanese Orthopaedic Association scores for cervical myelopathy. J Jpn Orthop Assoc. 1994;68:490–503 (in Japanese).
- 4.Fukui M, Chiba K, Kawakami M, Kikuchi S, Konno S, Miyamoto M, Seichi A, Shimamura T, Shirado O, Taguchi T, Takahashi K, Takeshita K, Tani T, Toyama Y, Wada E, Yonenobu K, Tanaka T, Hirota Y. Japanese Orthopaedic Association Cervical Myelopathy Evaluation Questionnaire (JOACMEQ): part 2. Endorsement of the alternative item. J Orthop Sci. 2007;12:241–248. doi: 10.1007/s00776-007-1119-0. [DOI] [PMC free article] [PubMed] [Google Scholar]
- 5.Fukui M, Chiba K, Kawakami M, Kikuchi S, Konno S, Miyamoto M, Seichi A, Shimamura T, Shirado O, Taguchi T, Takahashi K, Takeshita K, Tani T, Toyama Y, Yonenobu K, Wada E, Tanaka T, Hirota Y. Japanese Orthopaedic Association Cervical Myelopathy Evaluation Questionnaire (JOACMEQ): part 3. Determination of reliability. J Orthop Sci. 2007;12:321–326. doi: 10.1007/s00776-007-1131-4. [DOI] [PMC free article] [PubMed] [Google Scholar]
- 6.Fukui M, Chiba K, Kawakami M, Kikuchi S, Konno S, Miyamoto M, Seichi A, Shimamura T, Shirado O, Taguchi T, Takahashi K, Takeshita K, Tani T, Toyama Y, Yonenobu K, Wada E, Tanaka T, Hirota Y. Japanese Orthopaedic Association Cervical Myelopathy Evaluation Questionnaire (JOACMEQ): part 4. Establishment of equations for severity scores. J Orthop Sci. 2008;13:25–31. doi: 10.1007/s00776-007-1194-2. [DOI] [PMC free article] [PubMed] [Google Scholar]
- 7.Yonenobu K, Abumi K, Nagata K, Taketomi E, Ueyama K. Interobserver and intraobserver reliability of the Japanese Orthopaedic Association Scoring system for evaluation of cervical compression myelopathy. Spine. 2001;26:1890–1895. doi: 10.1097/00007632-200109010-00014. [DOI] [PubMed] [Google Scholar]
- 8.Fukui M, Chiba K, Kawakami M, Kikuchi S, Konno S, Miyamoto M, Seichi A, Shimamura T, Shirado O, Taguchi T, Takahashi K, Takeshita K, Tani T, Toyama Y, Yonenobu K, Wada E, Tanaka T, Hirota Y. JOA Back Pain Evaluation Questionnaire (JOABPEQ)/JOA Cervical Myelopathy Evaluation Questionnaire (JOACMEQ). The report on the development of revised versions. J Orthop Sci. 2009;14:348–65. doi: 10.1007/s00776-009-1337-8. [DOI] [PubMed] [Google Scholar]


