

Abstract
Prenatal and early postnatal environment can persistently alter one's risk of obesity. Environmental effects on hypothalamic developmental epigenetics constitute a likely mechanism underlying such ‘developmental programming’ of energy balance regulation. To advance our understanding of these processes, it is essential to develop approaches to disentangle the cellular and regional heterogeneity of hypothalamic developmental epigenetics. We therefore performed genome-scale DNA methylation profiling in hypothalamic neurons and non-neuronal cells at postnatal day 0 (P0) and P21 and found, surprisingly, that most of the DNA methylation differences distinguishing these two cell types are established postnatally. In particular, neuron-specific increases in DNA methylation occurred extensively at genes involved in neuronal development. Quantitative bisulfite pyrosequencing verified our methylation profiling results in all 15 regions examined, and expression differences were associated with DNA methylation at several genes. We also identified extensive methylation differences between the arcuate (ARH) and paraventricular nucleus of the hypothalamus (PVH). Integrating these two data sets showed that genomic regions with PVH versus ARH differential methylation strongly overlap with those undergoing neuron-specific increases from P0 to P21, suggesting that these developmental changes occur preferentially in either the ARH or PVH. In particular, neuron-specific methylation increases at the 3′ end of Shh localized to the ARH and were positively associated with gene expression. Our data indicate a key role for DNA methylation in establishing the gene expression potential of diverse hypothalamic cell types, and provide the novel insight that early postnatal life is a critical period for cell type-specific epigenetic development in the murine hypothalamus.
INTRODUCTION
The increasing worldwide prevalence of obesity and associated heathcare costs, together with the general failure of obesity therapy, urgently call for a focus on preventive strategies. In particular, there is growing interest in the potential for interventions targeted at critical developmental periods to reduce lifelong obesity risk (1,2). Despite extensive evidence that early environmental influences can affect the establishment of individual energy balance in humans and animal models, however, the biological mechanisms underlying ‘developmental programming’ of body weight regulation are not well understood.
Epigenetics has long been considered a prime candidate mechanism to explain the persistence of these effects (3,4). Epigenetic mechanisms regulate mitotically heritable alterations in gene expression potential that are not caused by changes in DNA sequence (5). In particular, DNA methylation, the most stable epigenetic mechanism (6), is an excellent candidate to convey effects that persist a lifetime. As the central brain region responsible for integrating various peripheral signals to regulate energy balance (7), the hypothalamus is a logical tissue in which to study epigenetic mechanisms mediating developmental programming of obesity. Indeed, maternal overnutrition (8–11) and undernutrition (12,13) have been reported to alter hypothalamic DNA methylation, as have other early environmental exposures including stress (14,15), exposure to toxins (16,17) and intrauterine position (18). Although some of these studies focused on specific hypothalamic regions (12,14–16,18), none performed separate evaluations on the basis of cell type.
This is critical, given the extensive cell type-specific epigenetic regulation in the brain (19,20). The two principal cell types in neural tissue are neurons and glia, each comprising approximately half of the cells in most brain regions. This cellular heterogeneity complicates studies of developmental programming at two levels. If epigenetic changes occur in only a subpopulation of cells, such effects will be masked at the bulk tissue level. Also, if induced epigenetic changes are detected at the tissue level, it will be unclear whether these reflect epigenetic changes within specific cells, or an induced shift in the proportion of cell types. In addition to the cellular dichotomy of neurons and glia, another level of hypothalamic heterogeneity is its distinct functional regions termed ‘hypothalamic nuclei’. In particular, the arcuate nucleus (ARH) integrates peripheral signals such as leptin and insulin and, via diverse neuronal connections, relays anabolic/orexigenic or catabolic/anorexigenic signals to other hypothalamic nuclei including the paraventricular (PVH), ventromedial (VMH) and lateral hypothalamus (LH) (7,21). The specialized functions and gene expression patterns of the hypothalamic nuclei appear to be maintained by epigenetic mechanisms (22). Despite the central role of the hypothalamus in regulation of energy balance; however, no epigenetic analysis of hypothalamic neuronal versus non-neuronal cells nor any genome-scale comparison of methylation patterns across hypothalamic nuclei has been reported.
A related fundamental question is when the characteristic DNA methylation patterns that distinguish neurons and glia are established. The de novo DNA methyltransferase Dnmt3a is highly expressed in the mouse brain during the first three postnatal weeks (23), suggesting that this is a critical period for developmental epigenetics in the central nervous system. This is highly relevant to understanding epigenetic mechanisms underlying developmental programming of body weight regulation, in that ontogenic periods when epigenetic mechanisms are undergoing establishment or maturation are critical periods when environmental influences can affect these processes, with persistent phenotypic consequences (24). We therefore set out to determine whether early postnatal life in the mouse is a critical period for the establishment of cell type-specific epigenetic mechanisms that regulate hypothalamic development and gene expression.
RESULTS
Most neuron-specific DNA methylation is established postnatally
To determine when cell type-specific DNA methylation patterns are established in the hypothalamus, hypothalamic nuclei were isolated from postnatal day 0 (P0) and P21 mice and immunostained against the neuron-specific nuclear marker NeuN (Fig. 1A) (20,25,26). Non-neuronal and neuronal nuclei were separated by fluorescence-activated sorting (FAS) (Fig. 1B) [although the vast majority of non-neuronal cells are glia, this subpopulation also includes some vascular cells, leukocytes and neuronal progenitors (27)]. Consistent with previous studies (28), non-neuronal cells increased in number from P0 to P21, while the number of neurons did not change appreciably (Supplementary Material, Table S1). To independently confirm the discrimination of our sorting, we measured expression of Tubb3 and Gfap [neuron-specific (29) and astrocyte-specific (30) markers, respectively] in multiple separations at both P0 and P21. We found comparable enrichment of Tubb3 and depletion of Gfap expression in the NeuN+ nuclear fractions at P0 and P21 (Fig. 1C), indicating reliable sorting at both ages.
Figure 1.
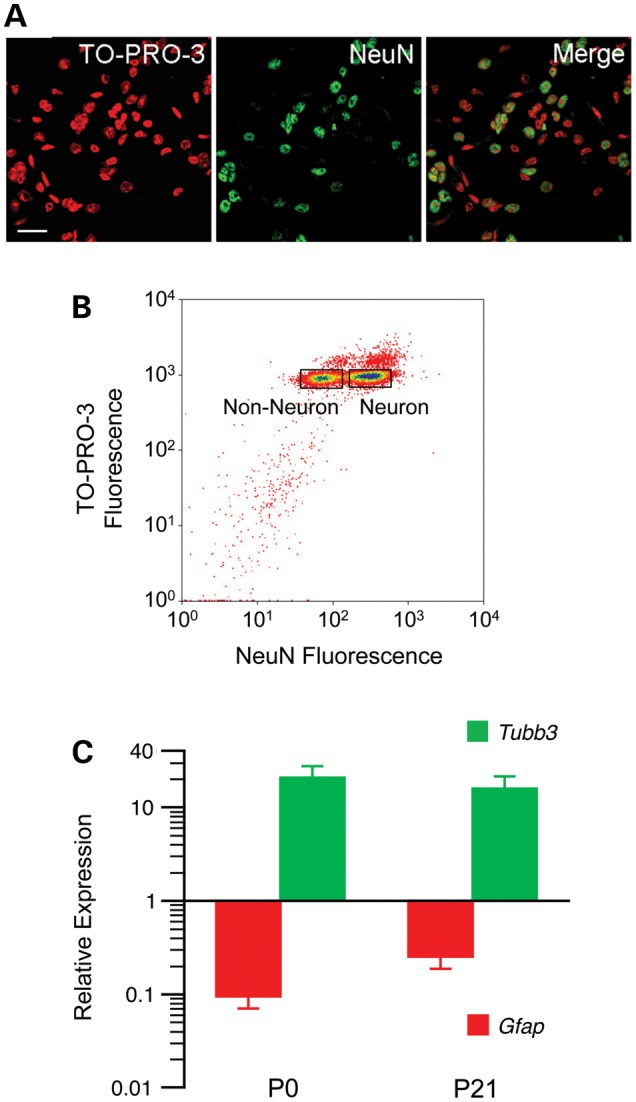
Non-neuronal and neuronal nuclei were separated based on NeuN staining. (A) Representative photomicrographs illustrate the ability to discriminate neuronal and non-neuronal nuclei by NeuN staining. Scale bar indicates 25 µm. (B) Excellent discrimination of NeuN− and NeuN+ nuclei was achieved by fluorescence-activated sorting. The rectangles indicate the gates set for sorting. (C) Expression levels of the neuron marker Tubb3 and astrocyte marker Gfap in NeuN+ nuclei confirm the quality of the separation at both ages (means ± SEM of four samples at each age).
We have previously documented the sensitivity and reliability of genome-scale DNA methylation profiling by methylation-specific amplification (MSA) combined with microarray hybridization (MSAM) (8,31,32). Here, we profiled methylation by directly sequencing MSA product using next-generation sequencing (MSA-seq). A total of 20 samples (5 samples each of P0 non-neurons, P0 neurons, P21 non-neurons and P21 neurons) were multiplexed across one Illumina lane. MSA-seq, which exploits the methylation sensitive and insensitive isoschizomers SmaI and XmaI, respectively, assesses relative methylation at 50 782 SmaI/XmaI intervals between 60bp and 3 kb in the mouse genome (84 525 SmaI/XmaI sites). To focus on intervals with detectable methylation, we set a minimum read depth threshold of 20 total reads (per 5 samples) in at least one cell type at one age; 31 652 intervals (54 545 SmaI/XmaI sites) satisfied this criterion. We were surprised to find relatively modest cell type-specific methylation differences in the hypothalamus at P0 (Fig. 2A). Of the 31 652 informative intervals, only 82 showed lower DNA methylation in neuronal compared with non-neuronal cells, and only 245 showed the converse (Fig. 2A). By P21, however, there was extensive neuron-specific hypermethylation: 2095 intervals showed higher methylation in neuronal than in non-neuronal cells; only 116 showed the converse (Fig. 2B) (annotated lists of ‘hits’ identified in Fig. 2A and B are provided in Supplementary Material, Tables S2–S5). Sites at which cell type-specific DNA methylation is established by P21 were significantly enriched within and near genes, mainly near transcription start sites (TSS) (Fig. 2C). Gene ontology (GO) analysis of these genes revealed significant enrichment for multiple GO processes (Supplementary Material, Table S6). Many of these are critical to neurodevelopment (Fig. 2D), suggesting that postnatal establishment of cell type-specific DNA methylation in the hypothalamus plays an important role in neural differentiation.
Figure 2.
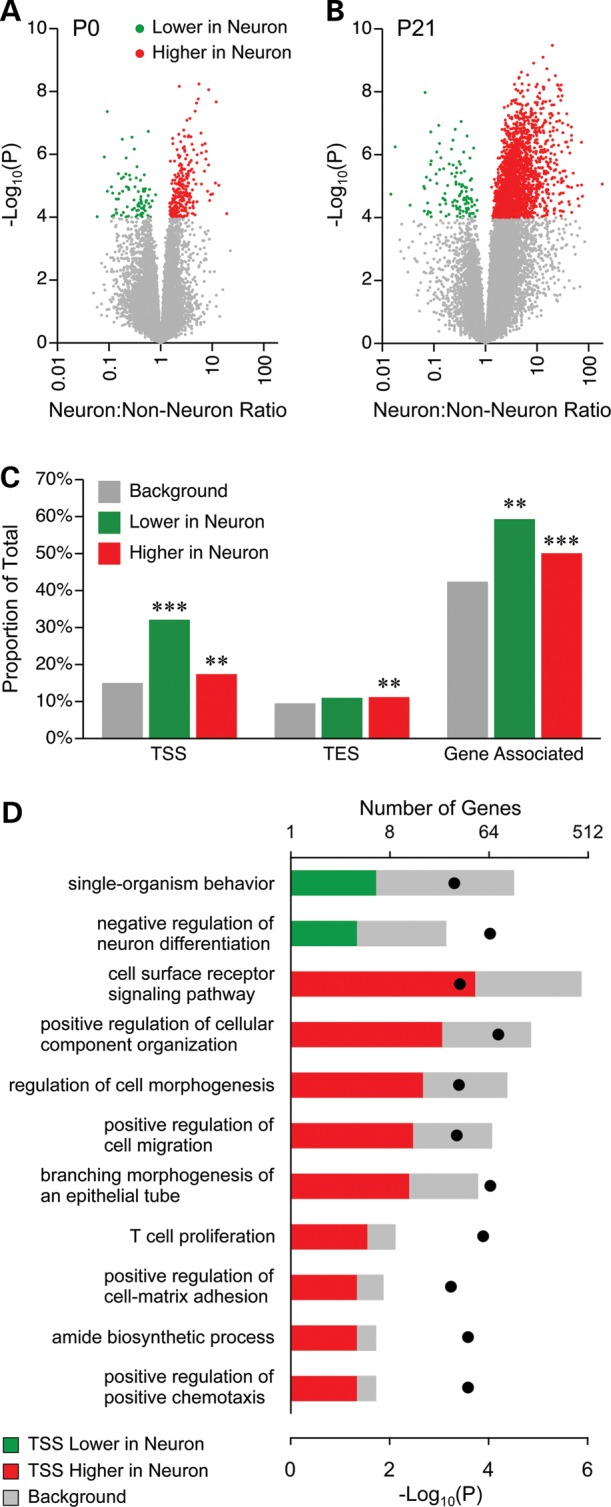
Most cell type-specific DNA methylation is established postnatally. (A) Volcano plot of neuronal versus non-neuronal MSA-seq data at P0; each dot represents a SmaI/XmaI interval. Only a few SmaI/XmaI intervals show neuron versus non-neuron differences. (B) By P21, neurons are extensively hypermethylated relative to non-neuronal cells. (C) SmaI/XmaI sites showing DNA methylation differences at P21 are significantly associated with genes, particularly nearby TSS (**P < 0.01; ***P < 0.0001). (D) Genes with P21 neuron versus non-neuron differences at their TSS are associated with multiple GO processes related to neural development (P-values indicated by black dots). There were 4167, 40 and 278 genes in the background set, ‘lower in neurons’ and ‘higher in neurons’, respectively.
Cell type-specific DNA methylation is associated with neural development
To test this directly, we examined P21 versus P0 DNA methylation changes occurring specifically in non-neurons or neurons, or in both cell types. Methylation gains predominated in both cell types, more obviously so in neurons (Fig. 3A and B); most changes (both losses and gains) were common to both cell types (Fig. 3C) (annotated lists of ‘hits’ identified in Fig. 3C are provided in Supplementary Material, Tables S7–S12). Regarding cell type-specific developmental changes, in non-neuronal cells methylation losses predominated, whereas in neurons methylation gains outnumbered losses by 30-fold (Fig. 3C). In all three categories (specific to non-neuron, specific to neuron and common to both), SmaI/XmaI sites losing methylation were enriched near TSS, transcription end sites (TES) and/or within genes (Fig. 3D); in particular, neuron-specific methylation losses were strongly enriched near TSS. Despite these strong enrichments; however, few GO categories were significantly associated with these genes (perhaps due to their small numbers) (Supplementary Material, Table S13). In terms of cell type-specific methylation gains, neuron-specific increases were slightly enriched near and within genes, mostly near the TSS (Fig. 3E). Many GO categories were significantly associated with these genes (Supplementary Material, Table S13), several of which were related to neuron development and differentiation (Fig. 3F and Supplementary Material, Table S13). Considering that TSS methylation is generally associated with gene silencing (5), these findings suggest that many genes required for neuronal differentiation remain active specifically in neurons at birth but become epigenetically silenced during early postnatal development, following the completion of neuronal differentiation. Interestingly, although methylation changes common to both cell types were by far the most abundant (Fig. 3C), associated genes were enriched for only a few GO categories (Supplementary Material, Table S13). Also, methylation gains common to both cell types [by far the majority of changes identified (Fig. 3C)] were strongly under-represented in and near genes (Fig. 3E). These observations suggest that cell type-specific DNA methylation changes, though relatively rare, are actually the key regulators of postnatal hypothalamic development.
Figure 3.
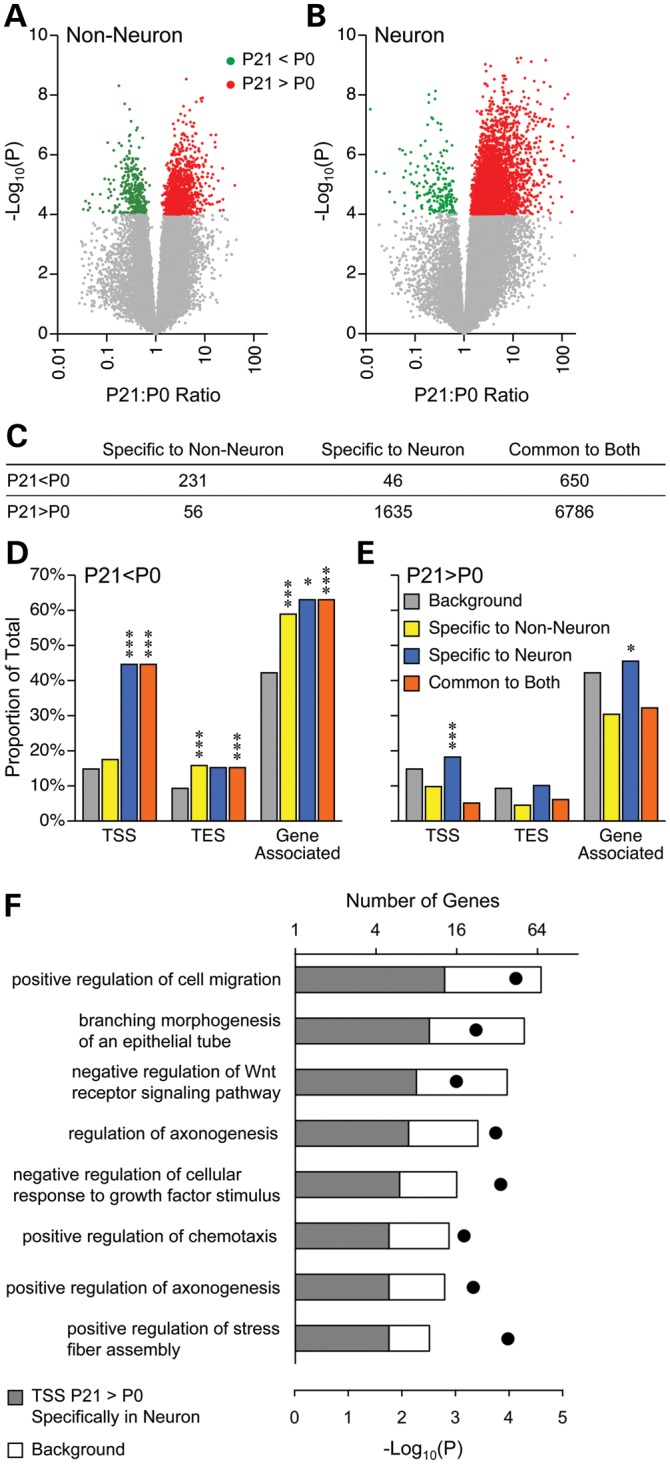
Cell type-specific DNA methylation changes associate with neuronal development. Volcano plots illustrating developmental methylation changes (P21 versus P0) in non-neuronal (A) and neuronal (B) cells; each dot presents a SmaI/XmaI interval. (C) The vast majority of methylation changes were common to both cell types. Changes specific to non-neuronal cells were mostly decreases, and neuron-specific methylation changes were almost entirely increases. (D) Methylation decreases were strongly enriched nearby TSS, TES and within genes. (E) Only methylation increases specific to neurons were enriched near genes, predominantly at TSS (*P < 0.01; ***P < 0.0001; for simplicity, significance is indicated only for enrichment, not depletion). (F) Genes with neuron-specific methylation increases at their TSS are associated with multiple GO processes related to neural development (P-values indicated by black dots). There were 4167 and 233 genes in the background set and ‘neuron specific increase’, respectively.
Quantitative bisulfite pyrosequencing verified MSA-seq results
Rather than use a strict Bonferroni-adjusted P-value cut-off of 1.5 × 10⁻⁶ (0.05/31 652), we performed extensive-independent validation by quantitative bisulfite pyrosequencing to identify a reliable criterion for calling MSA-seq hits. We measured DNA methylation in 15 gene-associated SmaI/XmaI intervals encompassing a total of 33 MSA-seq t-tests with P < 10−3 (Supplementary Material, Table S14). Of these 33 comparisons, all but one were validated by pyrosequencing, including 16 methylation differences with P > 1.5 × 10⁻⁶ (and 3 with P > 10−4) by MSA-seq (Supplementary Material, Table S14). These extensive validation data clearly indicate that our P-value cut-off of 10−4 is appropriate. For example, MSA-seq detected a neuron-specific methylation increase (P = 2.8 × 10⁻⁵) near the 3′ end of Shank3 (Fig. 4A) and a methylation increase specific to non-neurons (P = 3.4 × 10⁻⁵) just upstream of Pax6 (Fig. 4B). Each of these changes was validated by pyrosequencing (Fig. 4C and D, respectively) (Figs 5A and C and 7C and Supplementary Material, Fig. S2 provide data on all 15 regions validated). In many cases (as in Fig. 4A and B), the MSA-seq data indicated concordant methylation changes at SmaI/XmaI intervals in addition to those considered statistically significant, suggesting regional DNA methylation changes/differences spanning distances of 10 kb or more.
Figure 4.

DNA methylation changes detected by MSA-seq were validated by bisulfite pyrosequencing. (A) Near the 3′ end of Shank3, 4 SmaI/XmaI intervals spanning ∼10 kb showed concordant DNA methylation increases specifically in neurons. (B) At the 5′ of Pax6, 3 SmaI/XmaI intervals spanning >10 kb showed concordant DNA methylation increase in non-neurons. [In panels (A) and (B), asterisks indicate the SmaI/XmaI intervals that were significant by MSA-seq and selected for verification]. The DNA methylation increase specific to neurons at Shank3 (C) and the decrease specific to non-neuronal cells at Pax6 (D) were validated by bisulfite pyrosequencing. In panels (C) and (D), DNA methylation percentages are presented as means ± SEM of n = 5 per age per cell type (error bars smaller than symbols); line breaks indicate multiple pyrosequencing assays.
Figure 5.

DNA methylation differences are associated with gene expression. (A) At the Bmp4 TSS, a methylation increase specific to neurons was validated by bisulfite pyrosequencing. (B) Consistent with this, Bmp4 is down-regulated in neuronal relative to non-neuronal cells at P21. (C) Downstream of the En1 TSS, a methylation increase specific to non-neuronal cells was validated by bisulfite pyrosequencing. (D) En1 is down-regulated in non-neuronal cells relative to neurons at P21. In panels (A) and (C) DNA methylation data are presented as means ± SEM (n = 5 per age per cell type; error bars smaller than symbols). In (B) and (D) each square indicates relative expression of a single sample, and the horizontal bars indicate the median values.
Figure 7.

Neuron-specific methylation increases at the Shh 3′ CGI are localized to the ARH and positively associated with gene expression. (A) Upstream of the Shh TES, 3 SmaI/XmaI intervals exhibited concordant neuron-specific methylation increases (the asterisk indicates the SmaI/XmaI interval that was significant by MSA-seq). (B) This same interval was found to be hypermethylated in ARH relative to PVH, by MSAM. (C) The neuron-specific methylation increase was validated by bisulfite pyrosequencing (means ± SEM, n = 5). (D) ARH versus PVH hypermethylation was validated by bisulfite pyrosequencing (means ± SEM, n = 3; each sample = 7 mice). (E) At P21, Shh expression is higher in neurons than in non-neuronal cells (n = 5). (F) At P21, Shh expression is higher in ARH than in PVH (n = 6). In both (E) and (F), horizontal bars indicate the medians.
DNA methylation changes/differences associate with gene expression
DNA methylation at gene promoters is generally correlated with transcriptional repression (5). To examine the extent to which DNA methylation changes/differences are associated with gene expression, we selected two genes with differential TSS methylation in non-neuronal cells versus neurons at P21: bone morphogenetic protein 4 (Bmp4) and engrailed 1 (En1). Consistent with the results of MSA-seq, bisulfite pyrosequencing confirmed that the Bmp4 TSS increased methylation (P21 > P0) specifically in neurons (Fig. 5A) and the En1 TSS increased methylation specifically in non-neurons (Fig. 5C). These cell type-specific methylation changes were associated with expression. Performing qPCR with RNA extracted from P21 nuclei showed a lower expression of Bmp4 in neurons relative to non-neuronal cells (Fig. 5B) and a lower expression of En1 in non-neuronal cells relative to neurons (Fig. 5D). These results indicate that the methylation changes we detected are in fact acting epigenetically to regulate cell type-specific transcriptional activity in the developing hypothalamus.
Neuronal methylation changes localize to specific hypothalamic nuclei
We next asked whether the cell type-specific methylation changes we identified are specialized by hypothalamic region. To examine this, we microdissected ARH and PVH from P10 mice and used MSAM to compare DNA methylation patterns between these two hypothalamic nuclei. Using a similar design to previous studies (8,33), we performed two PVH versus ARH cohybridizations and identified genomic regions showing concordant methylation differences in both. Compared with the dramatic differences between non-neuronal and neuronal cells (Fig. 2), PVH versus ARH differences were less dramatic (Supplementary Material, Fig. S2A and B). Using relatively loose criteria (concordant fold change ≥20% and P < 0.005 in both cohybridizations), we identified 132 SmaI/XmaI intervals with methylation in PVH > ARH, and 284 with methylation in PVH < ARH. Interestingly, these ‘PVH lower’ SmaI/XmaI sites were significantly enriched in the 5 kb upstream of 3′ CpG islands (3′ CGI) (P = 0.01) (Supplementary Material, Fig. S2C). Moreover, of 17 genes with 3′ CGI methylation lower in PVH than ARH, 11 are associated with (or essential for) neural development (Supplementary Material, Table S15). Of these, five of six selected for quantitative bisulfite pyrosequencing were validated (Fig. 7D and Supplementary Material, Fig. S3). These results suggest that DNA methylation at 3′ CGI contributes to the epigenetic specialization of neural development within discrete hypothalamic nuclei.
We next tested whether regions showing PVH versus ARH DNA methylation differences are associated with those showing neuronal methylation changes from P0 to P21. Surprisingly, both the ‘PVH lower’ and ‘PVH higher’ regions were strongly enriched for those showing neuronal increases in whole hypothalamus (Fig. 6A), but not for those showing decreases (Supplementary Material, Fig. S4). Relative to genic regions associated with all neuronal methylation increases, those overlapping with the ‘PVH < ARH’ group were significantly enriched near the TES of genes (Fig. 6B) (consistent with PVH < ARH regions in general). GO analysis of these genes identified multiple neurogenesis GO processes, including a particularly strong enrichment for ‘regulation of neuron differentiation’ (Fig. 6C and Supplementary Material, Table S16). These results indicate that many of the neuronal methylation increases occurring from P0 to P21 in fact localize to and regulate neuronal development within specific hypothalamic nuclei.
Figure 6.

Neuronal DNA methylation changes localize to specific hypothalamic nuclei. (A) SmaI/XmaI intervals with differential DNA methylation in PVH versus ARH overlap significantly with those gaining methylation from P0 to P21 in neurons. (B) SmaI/XmaI sites showing both PVH < ARH and neuronal methylation increases are significantly enriched nearby TES (*P < 0.05). (C) These TES-associated genes are enriched for GO processes related to neuronal differentiation.
Neuron-specific 3′ methylation at sonic hedgehog (Shh) is positively associated with gene expression
Among the genes showing both neuronal gain of methylation (P21 > P0) and PVH < ARH (Fig. 6A), we were intrigued to find Shh, which encodes a morphogen critical for neural development (34). Three adjacent SmaI/XmaI intervals upstream of the TES showed neuron-specific gains in DNA methylation from P0 to P21 (Fig. 7A); one of these was identified as PVH < ARH by MSAM (Fig. 7B). Both of these results were validated by bisulfite pyrosequencing (Fig. 7C and D). Shh gene expression was positively associated with 3′ DNA methylation in both cases: higher in P21 neurons relative to non-neurons (Fig. 7E) and higher in ARH than in PVH (Fig. 7F). These results are generally consistent with our recent report that 3′ CGI methylation drives developmentally regulated transcriptional activation (35). Overall, our findings suggest that this 3′ region of Shh is postnatally methylated preferentially in neurons within the ARH, serving to activate Shh transcription in those cells.
DISCUSSION
Our data show, for the first time, that cell type-specific epigenetic regulation in the murine hypothalamus is established during early postnatal life, providing new and compelling evidence that this is a critical period for hypothalamic developmental epigenetics and, by extension, developmental programming of obesity.
The early postnatal period in the mouse is known to be a critical period for hypothalamic neuroanatomic development. In particular, leptin-dependent formation of neuronal projections from the ARH to other hypothalamic nuclei occurs during this period, establishing the ‘wiring’ necessary for body weight regulation; these projections fail to form in leptin-deficient (ob/ob) mice, and this deficit cannot be rescued after the critical postnatal period (36). Dramatic hypothalamic gene expression changes from P0 to P21 (37) provide further evidence of critical developmental processes during early postnatal life. Here, we observed postnatal increases in DNA methylation, predominantly in neurons. This observation is spatio-temporally concordant with the expression of Dnmt3a, which has an expression peak 3 weeks after birth in neurons but is expressed only weakly in astrocytes (23). Also, deficiency of either Dnmt1 (38) or Dnmt3a (39) causes differentiation from neural progenitors toward glia rather than neurons. It has been proposed that developmental genes in neural progenitors are first silenced by transient mechanisms such as histone modifications to prevent precocious differentiation, then permanently silenced in differentiated neural cells by more stable mechanisms such as DNA methylation (40). Our findings are generally consistent with this model, and suggest that the early postnatal period represents a final stage of neuron development when established neuron differentiation is stabilized by DNA methylation of developmental genes.
Our results appear to contrast with a recent report by Lister and Mukamel et al. (41), who used genome-wide bisulfite-sequencing to compare DNA methylation in neuronal and non-neuronal cells from adult mouse cortex. Their analysis indicated that genomic regions with higher CpG methylation in non-neuronal versus neuronal cells were much more numerous than the converse. Interestingly, of the 86 gene-associated regions we found to have higher methylation in non-neuronal than neuronal cells in P21 hypothalamus (Supplementary Material, Table S4) fully half were also identified as such by Lister and Mukamel et al. (41) in cortex (Supplementary Material, Fig. S5A), a significant overlap (P = 1.4 × 10⁻⁷). We found only minimal overlap, however, between our 1106 and their 315 genes with higher methylation in neurons versus non-neuronal cells (Supplementary Material, Fig. S5B). These results perhaps indicate that whereas glia-specific methylation is generalizable across different brain regions (e.g. cortex and hypothalamus), neuron-specific methylation exhibits more regional specialization. Another interesting finding of Lister and Mukamel et al. (41) is extensive developmental increases in non-CpG methylation in the brain. Our methylation profiling technique, however, was targeted specifically to CpG sites and did not provide data on non-CpG methylation.
Our GO analysis of P0 to P21 methylation changes indicated that although changes common to both neurons and glia predominate, those specific to one cell type are key regulators of postnatal neural development. We examined the expression of three genes showing cell type-specific methylation changes at their TSS: Bmp4, En1 and Pax6. Except for Pax6 (expression of which was not detectable in nuclear message), expression was negatively associated with TSS methylation (Fig. 5). Bmp4 is a member of the bone morphogenetic protein family, which regulates vertebrate nervous system development (42). Postnatally, BMPs regulate differentiation of neural progenitors and response to CNS injury (43). Consistent with our finding, it was recently reported that postnatal neural expression of Bmp4 and Bmp2 is astrocyte specific (44). En1 encodes a prototypical cell type-specific transcription factor that is expressed in a restricted population of early postmitotic ventral neurons (45). Postnatally, it has been reported to regulate synapse formation (46) and confer neuroprotection in Parkinson's disease models (47). Our results on Bmp4 and En1 therefore not only confirm previous findings of differential expression in neurons and glia, but also indicate that these expression differences are regulated by cell type-specific DNA methylation established in the postnatal hypothalamus.
Other than one previous study which characterized locus-specific methylation differences between PVH and VMH (22), little was previously known about epigenetic specialization of hypothalamic nuclei. Here, we documented widespread DNA methylation differences between PVH and ARH. Compared with the differences between non-neurons and neurons; however, those between PVH and ARH were relatively subtle. One potential reason is that we were unable to separate specific cell types in the PVH versus ARH comparison. Also, the PVH versus ARH comparison was conducted in tissues microdissected from P10 mice. It is possible that the developmental processes leading to epigenetic specialization of these two nuclei was not yet completed at this time. Nonetheless, the strong positive association of genomic regions showing PVH versus ARH differences with those showing neuronal methylation gains (Fig. 6A) indicate that many of the developmental changes we identified occur within neuronal subpopulations localized within either the ARH or PVH. For example, we found that the P21 versus P0 gain of methylation at the 3′ end of Shh is not only neuron specific (Fig. 7A), but appears to occur predominantly within neurons in the ARH (Fig. 7B), providing the first evidence of cell type-specific epigenetic development within a specific hypothalamic nucleus.
Shh encodes a morphogen signaling molecule with widespread roles in development, including regulation of neural tube formation (48) and maintenance of adult neural progenitors (34,49). We found that a region near the 3′ end of Shh demonstrates a neuron-specific increase in hypothalamic DNA methylation from P0 to P21, and also higher methylation in ARH relative to PVH. In both cases, 3′ methylation was associated with higher gene expression (Fig. 7). The positive association between TES methylation and gene expression agrees with our recent report showing that developmentally programed methylation of 3′ CGI promotes transcription via an enhancer-blocking mechanism (35). Whereas that study was focused on earlier events in the differentiation of embryonic stem cells; however, our current data suggest that transcriptional activation by 3′ methylation may also play an important role in regulating postnatal neural development. It was also recently reported that Dnmt3a-dependent non-proximal promoter methylation promotes expression of neurogenic genes (38). Together with these previous studies, our results underscore the importance of studying developmental changes in DNA methylation in an unbiased fashion. Whereas investigators have previously been focused predominantly on epigenetic changes at promoter regions, clearly those at intragenic (22), 3′ (35) and even distal enhancer regions (50) contribute to the establishment and maintenance of gene expression potential in differentiated cell types.
The adhesion of cell bodies, multiplicity of synapses and fragility of axons and dendrites make it extremely difficult to isolate and sort intact neurons and glia (51); we therefore sorted nuclei instead of whole cells. This technique is based on the neuron-specific expression of the nuclear marker NeuN. Although most mammalian neurons express NeuN, some major neurons either do not express it (25) or express it at very low levels (52). We therefore cannot exclude the possibility that a subset of hypothalamic neuronal nuclei were misclassified as non-neuronal. Nevertheless, many previous studies have utilized the neuron-specific expression of NeuN to identify and/or isolate neuronal and non-neuronal cell types (19,20,53), including during the perinatal period (28,53). Most importantly, by examining the expression of neuron-specific and astrocyte-specific markers (Fig. 1C), we confirmed that our NeuN+ nuclei were indeed strongly enriched for neurons at both ages. Hence, the dramatic epigenetic differences we identified between P0 and P21 neurons (Fig. 3) cannot be explained by differential sorting efficiency. Future identification of specific markers for glial subpopulations would be extremely helpful to facilitate epigenetic studies in, for example, astrocytes, oligodendrocytes and macroglia. Owing to the small amount of tissue we obtained from microdissections, we were unable to sort neuronal and non-neuronal nuclei from specific hypothalamic regions. Also we were unable to isolate specific neuronal subpopulations in the hypothalamus. Transgenic mice with specific neurons labeled by fluorescent proteins, such as GFP-labeled POMC neurons (54), should be of exceptional utility in this regard.
In summary, we have demonstrated that extensive cell type-specific and region-specific epigenetic changes occur during early postnatal development of the murine hypothalamus. These findings raise many questions for future study. It is unknown whether this postnatal epigenetic differentiation of neuronal and non-neuronal cells occurs throughout the mouse brain, or is limited to the hypothalamus. Also, to understand the circumstances in which the mouse may be an apt model of developmental programming of hypothalamic epigenetics, it will be crucial to compare the ontogeny of cell type-specific epigenetic development between mice and humans. Although it is widely held that brain development in the early postnatal rodent is comparable with that in the third-trimester human (55), very little is currently known about the ontogeny of developmental epigenetics in the human hypothalamus. Recently, by performing genome-scale DNA methylation profiling in the human prefrontal cortex from the age of −0.5 to 83 years, Numata et al. (56) documented substantial methylation changes both prenatally and postnatally. Most interestingly, whereas demethylation predominated prenatally, postnatal human brain development was generally characterized by methylation gains. Hence, the limited information available suggests that, from an epigenetic perspective, early postnatal brain development in the mouse may be similar to that in humans. Above all, the widespread DNA methylation differences we have documented between hypothalamic neurons and glia, as well as between the ARH and PVH, clearly illustrate the need to study hypothalamic developmental epigenetics–and environmental effects on these processes–in a cell type-specific and region-specific fashion.
MATERIALS AND METHODS
Animal studies
All applicable institutional and governmental regulations concerning the ethical use of animals were followed during this research. The protocol was approved by the Institutional Animal Care and Use Committee of Baylor College of Medicine. All mice were housed in a temperature-controlled facility (22°C), provided free access to food and water, and maintained on a 12-h light cycle.
Separation of hypothalamic non-neuronal and neuronal nuclei
We modified previously published protocols (20,26) to maximize the yield of nuclei from small amounts of tissue, but still needed to pool two hypothalami per sample to reliably recover sufficient sorted nuclei. Each separation therefore started with two hypothalami dissected from P0 or P21 male C57BL/6J mice. Nuclei were released by homogenization and purified by ultracentrifugation. The purified nuclei were sequentially stained with primary (rabbit anti-NeuN, Millipore) and secondary antibody (goat anti-rabbit IgG, Alexa Fluor 488 conjugated, Life Technologies). Directly before sorting, the nuclei were also stained with the nucleic acid dye TO-PRO-3 (Life Technologies). For FAS, proper gates were set based on TO-PRO-3 fluorescence intensity to acquire single nuclei only, and then the NeuN− and NeuN+ nuclei were sorted based on the fluorescence intensity of the secondary antibody (Beckman Coulter MoFlo). After sorting, the NeuN− and NeuN+ nuclei were pelleted and stored at −80°C (a detailed protocol is provided as Supplementary Material, Protocol S1).
Micro-dissection of PVH and ARH
The PVH and ARH were dissected from 400 µm thick tissue slices of the hypothalamus collected by sectioning P10 brains in the coronal plane on a vibrating tissue slicer under sterile conditions according to procedures described in detail previously (57). Under microscopic visualization, triangular-shaped tissue blocks were derived from tissue sections containing either the PVH or ARH by making two cuts along the margins of each nucleus, with the third ventricle forming the third side of the triangle. The microdissected tissue blocks were snap-frozen in liquid nitrogen and stored at −80°C.
Genome-scale DNA methylation profiling
MSAM was performed as previously described (31,32), using a starting quantity of 0.5 µg genomic DNA derived from ARH or PVH (each sample was pooled from seven mice). Two independent cohybridizations (biological replicates) were performed on a custom 2 × 10⁵ k array (Agilent Technologies), incorporating a dye-swap. The array includes 90 694 probes covering 86% (23 742) of the 27 675 potentially informative SmaI/XmaI intervals between 200 bp and 2 kb in the mouse genome (average 3.8 probes per interval) (58). For each interval, the average ratio and the median P-value among different probes were used to identify hits: intervals showing ≥20% fold change (PVH versus ARH) and P < 0.005 in both cohybridizations.
The MSA-seq protocol is identical to that of MSAM up to and including the amplification step. Instead of microarray cohybridization, the amplified DNA was sequenced by next generation sequencing (HiSeq, Illumina), according to manufacturer's protocol. Illumina library preparation and sequencing was performed in the Baylor College of Medicine Human Genome Sequencing Center. We sequenced five MSA libraries per sex per age (20 total). After trimming adaptor sequence and low-quality bases, reads were mapped to the mm9 mouse genome (July 2007 release) using Bowtie (59). DNA methylation differences/changes were defined as P < 0.0001 by t-test (two-tailed, equal variance). SmaI/XmaI sites were annotated by RefGene according to NCBI37/mm9 mouse genome (Jul 2007 release). DNA methylation changes from P0 to P21 were characterized as: specific to non-neuronal cells, specific to neuronal cells or common to both. Common changes were those showing significant P0 to P21 changes across both cell types. Specific changes were defined as showing P0 to P21 changes in either non-neuronal cells or neurons but not across both cell types.
Genomic distribution enrichment was calculated with the χ2 test, based on SmaI/XmaI sites annotated by RefGene according to the NCBI37/mm9 mouse genome. ‘TSS’ or ‘TES’ SmaI/XmaI sites were defined as those ≤3 kb upstream or downstream from TSS or TES, respectively, and ‘gene associated’ sites were defined as those within or ≤3 kb upstream or downstream from genes. 3′ CGI were defined as those within 3 kb of a TES.
GO analysis was performed using the Gene Ontology enRIchment anaLysis and visuaLizAtion tool (GOrilla) (60). In each comparison, we used the appropriate background sets, i.e. SmaI/XmaI sites from the 54 545 that passed the read depth threshold and were nearby TSS, TES or associated with genes, respectively. Also, in addition to the P < 0.0001 criterion, to focus on the most biologically important GO enrichments, only genes associated with >3-fold methylation differences/changes were included.
Relevant details of the MSAM and MSA-seq experiments, including experimental design, hybridization data and raw MSA-seq reads, are available in the GEO database (http://www.ncbi.nlm.nih.gov/geo/) (accession # GSE48323).
Quantitative analysis of DNA methylation
Site-specific analysis of CpG methylation was performed by bisulfite pyrosequencing as previously described (31,32). Pyrosequencing assays were designed to cover both informative SmaI/XmaI sites when possible. A hit was considered validated if the pyrosequencing results were consistent with the MSAM/MSA-seq results in either assay. Sensitivity and linearity of each pyrosequencing assay were confirmed by running methylation standards (0, 25, 50, 75 and 100%) consisting of known mixtures of methylated and unmethylated mouse genomic DNA (61). Pyrosequencing primers and the coordinates of examined CpG sites (NCBI37/mm9 mouse genome) are listed in Supplementary Material, Table S17.
Quantitative analysis of gene expression
Gene expression was measured by quantitative PCR. Total RNA was extracted from sorted nuclei by RNA Stat-60 (Tel-Test), and cDNA was synthesized using M-MLV Reverse Transcriptase (Promega) with random primers (Life Technologies). Gene expression was measured using TaqMan assays (Life Technologies) using the 2−ΔΔCt method (assay details provided in Supplementary Material, Table S18). In all cases, GAPDH was used as the endogenous control. The maximum number of PCR cycles was set to 40 in the PVH versus ARH comparisons, and 60 in the neuron versus non-neuron comparisons. Statistical significance was determined by t-test (two-tailed, equal variance).
SUPPLEMENTARY MATERIAL
FUNDING
This work was supported by grants from the National Institutes of Health (1R01DK081557) to R.A.W., the U.S. Department of Agriculture (USDA) (CRIS 6250-51000-055) to R.A.W and L.S., the Sidney Kimmel Foundation and National Cancer Institute (R21CA137689) to L.S. and a Thrasher Research Fund fellowship (NR-0136) to G.L.
Supplementary Material
ACKNOWLEDGEMENTS
Fluorescence-activated sorting was performed in the Texas Children's Hospital Cancer Center Flow Core Facility, with the expert assistance of Chris Threeton and Tatiana Goltsova. We thank Adam Gillum (Baylor College of Medicine, USDA/ARS Children's Nutrition Research Center) for assistance with the figures.
Conflict of Interest statement: None declared.
REFERENCES
- 1.Atkinson R.L., Pietrobelli A., Uauy R., Macdonald I.A. Are we attacking the wrong targets in the fight against obesity?: the importance of intervention in women of childbearing age. Int. J. Obes. (Lond) 2012;36: 1259–1260. doi: 10.1038/ijo.2012.149. [DOI] [PubMed] [Google Scholar]
- 2.Gluckman P.D., Hanson M., Zimmet P., Forrester T. Losing the war against obesity: the need for a developmental perspective. Sci. Trans. Med. 2011;3 doi: 10.1126/scitranslmed.3002554. 1–4. [DOI] [PubMed] [Google Scholar]
- 3.Gluckman P.D., Hanson M.A., Buklijas T., Low F.M., Beedle A.S. Epigenetic mechanisms that underpin metabolic and cardiovascular diseases. Nat. Rev. Endocrinol. 2009;5:401–408. doi: 10.1038/nrendo.2009.102. [DOI] [PubMed] [Google Scholar]
- 4.Waterland R.A., Garza C. Potential mechanisms of metabolic imprinting that lead to chronic disease. Am. J. Clin. Nutr. 1999;69:179–197. doi: 10.1093/ajcn/69.2.179. [DOI] [PubMed] [Google Scholar]
- 5.Jaenisch R., Bird A. Epigenetic regulation of gene expression: how the genome integrates intrinsic and environmental signals. Nat. Genet. 2003;33(Suppl):245–254. doi: 10.1038/ng1089. [DOI] [PubMed] [Google Scholar]
- 6.Cedar H., Bergman Y. Linking DNA methylation and histone modification: patterns and paradigms. Nat. Rev. Genet. 2009;10:295–304. doi: 10.1038/nrg2540. [DOI] [PubMed] [Google Scholar]
- 7.Flier J.S. Obesity wars: molecular progress confronts an expanding epidemic. Cell. 2004;116:337–350. doi: 10.1016/s0092-8674(03)01081-x. [DOI] [PubMed] [Google Scholar]
- 8.Li G., Kohorst J.J., Zhang W., Laritsky E., Kunde-Ramamoorthy G., Baker M.S., Fiorotto M.L., Waterland R.A. Early postnatal nutrition determines adult physical activity and energy expenditure in female mice. Diabetes. 2013;62:2773–2783. doi: 10.2337/db12-1306. [DOI] [PMC free article] [PubMed] [Google Scholar]
- 9.Plagemann A., Harder T., Brunn M., Harder A., Roepke K., Wittrock-Staar M., Ziska T., Schellong K., Rodekamp E., Melchior K., et al. Hypothalamic proopiomelanocortin promoter methylation becomes altered by early overfeeding: an epigenetic model of obesity and the metabolic syndrome. J. Physiol. 2009;587:4963–4976. doi: 10.1113/jphysiol.2009.176156. [DOI] [PMC free article] [PubMed] [Google Scholar]
- 10.Plagemann A., Roepke K., Harder T., Brunn M., Harder A., Wittrock-Staar M., Ziska T., Schellong K., Rodekamp E., Melchior K., et al. Epigenetic malprogramming of the insulin receptor promoter due to developmental overfeeding. J. Perinat. Med. 2010;38:393–400. doi: 10.1515/jpm.2010.051. [DOI] [PubMed] [Google Scholar]
- 11.Vucetic Z., Kimmel J., Totoki K., Hollenbeck E., Reyes T.M. Maternal high-fat diet alters methylation and gene expression of dopamine and opioid-related genes. Endocrinology. 2010;151:4756–4764. doi: 10.1210/en.2010-0505. [DOI] [PMC free article] [PubMed] [Google Scholar]
- 12.Begum G., Stevens A., Smith E.B., Connor K., Challis J.R., Bloomfield F., White A. Epigenetic changes in fetal hypothalamic energy regulating pathways are associated with maternal undernutrition and twinning. FASEB J. 2012;26:1694–1703. doi: 10.1096/fj.11-198762. [DOI] [PMC free article] [PubMed] [Google Scholar]
- 13.Coupe B., Amarger V., Grit I., Benani A., Parnet P. Nutritional programming affects hypothalamic organization and early response to leptin. Endocrinology. 2010;151:702–713. doi: 10.1210/en.2009-0893. [DOI] [PubMed] [Google Scholar]
- 14.Murgatroyd C., Patchev A.V., Wu Y., Micale V., Bockmuhl Y., Fischer D., Holsboer F., Wotjak C.T., Almeida O.F., Spengler D. Dynamic DNA methylation programs persistent adverse effects of early-life stress. Nat. Neurosci. 2009;12:1559–1566. doi: 10.1038/nn.2436. [DOI] [PubMed] [Google Scholar]
- 15.Chen J., Evans A.N., Liu Y., Honda M., Saavedra J.M., Aguilera G. Maternal deprivation in rats is associated with corticotrophin-releasing hormone (CRH) promoter hypomethylation and enhances CRH transcriptional responses to stress in adulthood. J. Neuroendocrinol. 2012;24:1055–1064. doi: 10.1111/j.1365-2826.2012.02306.x. [DOI] [PMC free article] [PubMed] [Google Scholar]
- 16.Gore A.C., Walker D.M., Zama A.M., Armenti A.E., Uzumcu M. Early life exposure to endocrine-disrupting chemicals causes lifelong molecular reprogramming of the hypothalamus and premature reproductive aging. Mol. Endocrinol. 2011;25:2157–2168. doi: 10.1210/me.2011-1210. [DOI] [PMC free article] [PubMed] [Google Scholar]
- 17.Kundakovic M., Gudsnuk K., Franks B., Madrid J., Miller R.L., Perera F.P., Champagne F.A. Sex-specific epigenetic disruption and behavioral changes following low-dose in utero bisphenol A exposure. Proc. Natl Acad. Sci. USA. 2013;110:9956–9961. doi: 10.1073/pnas.1214056110. [DOI] [PMC free article] [PubMed] [Google Scholar]
- 18.Mori H., Matsuda K.I., Tsukahara S., Kawata M. Intrauterine position affects estrogen receptor alpha expression in the ventromedial nucleus of the hypothalamus via promoter DNA methylation. Endocrinology. 2010;151:5775–5781. doi: 10.1210/en.2010-0646. [DOI] [PubMed] [Google Scholar]
- 19.Iwamoto K., Bundo M., Ueda J., Oldham M.C., Ukai W., Hashimoto E., Saito T., Geschwind D.H., Kato T. Neurons show distinctive DNA methylation profile and higher interindividual variations compared with non-neurons. Genome Res. 2011;21:688–696. doi: 10.1101/gr.112755.110. [DOI] [PMC free article] [PubMed] [Google Scholar]
- 20.Skene P.J., Illingworth R.S., Webb S., Kerr A.R., James K.D., Turner D.J., Andrews R., Bird A.P. Neuronal MeCP2 is expressed at near histone-octamer levels and globally alters the chromatin state. Mol. Cell. 2010;37:457–468. doi: 10.1016/j.molcel.2010.01.030. [DOI] [PMC free article] [PubMed] [Google Scholar]
- 21.Simerly R.B. Hypothalamic substrates of metabolic imprinting. Physiol. Behav. 2008;94:79–89. doi: 10.1016/j.physbeh.2007.11.023. [DOI] [PMC free article] [PubMed] [Google Scholar]
- 22.Hoivik E.A., Bjanesoy T.E., Mai O., Okamoto S., Minokoshi Y., Shima Y., Morohashi K., Boehm U., Bakke M. DNA methylation of intronic enhancers directs tissue-specific expression of steroidogenic factor 1/adrenal 4 binding protein (SF-1/Ad4BP) Endocrinology. 2011;152:2100–2112. doi: 10.1210/en.2010-1305. [DOI] [PubMed] [Google Scholar]
- 23.Feng J., Chang H., Li E., Fan G. Dynamic expression of de novo DNA methyltransferases Dnmt3a and Dnmt3b in the central nervous system. J. Neurosci. Res. 2005;79:734–746. doi: 10.1002/jnr.20404. [DOI] [PubMed] [Google Scholar]
- 24.Waterland R.A., Michels K.B. Epigenetic epidemiology of the developmental origins hypothesis. Annu. Rev. Nutr. 2007;27:363–388. doi: 10.1146/annurev.nutr.27.061406.093705. [DOI] [PubMed] [Google Scholar]
- 25.Mullen R.J., Buck C.R., Smith A.M. Neun, a neuronal specific nuclear protein in vertebrates. Development. 1992;116:201–211. doi: 10.1242/dev.116.1.201. [DOI] [PubMed] [Google Scholar]
- 26.Jiang Y., Matevossian A., Huang H.S., Straubhaar J., Akbarian S. Isolation of neuronal chromatin from brain tissue. BMC Neurosci. 2008;9:42. doi: 10.1186/1471-2202-9-42. [DOI] [PMC free article] [PubMed] [Google Scholar]
- 27.Sousa-Ferreira L., Alvaro A.R., Aveleira C., Santana M., Brandao I., Kugler S., de Almeida L.P., Cavadas C. Proliferative hypothalamic neurospheres express NPY, AGRP, POMC, CART and orexin-A and differentiate to functional neurons. PLoS One. 2011;6:e19745. doi: 10.1371/journal.pone.0019745. [DOI] [PMC free article] [PubMed] [Google Scholar]
- 28.Bandeira F., Lent R., Herculano-Houzel S. Changing numbers of neuronal and non-neuronal cells underlie postnatal brain growth in the rat. Proc. Natl Acad. Sci. USA. 2009;106:14108–14113. doi: 10.1073/pnas.0804650106. [DOI] [PMC free article] [PubMed] [Google Scholar]
- 29.Singh K.K., Tsai L.H. MicroTUB(B3)ules and brain development. Cell. 2010;140:30–32. doi: 10.1016/j.cell.2009.12.038. [DOI] [PubMed] [Google Scholar]
- 30.Yang Q., Feng B., Zhang K., Guo Y.Y., Liu S.B., Wu Y.M., Li X.Q., Zhao M.G. Excessive astrocyte-derived neurotrophin-3 contributes to the abnormal neuronal dendritic development in a mouse model of fragile X syndrome. PLoS Genet. 2012;8:e1003172. doi: 10.1371/journal.pgen.1003172. [DOI] [PMC free article] [PubMed] [Google Scholar]
- 31.Shen L., Kondo Y., Guo Y., Zhang J., Zhang L., Ahmed S., Shu J., Chen X., Waterland R.A., Issa J.P. Genome-wide profiling of DNA methylation reveals a class of normally methylated CpG island promoters. PLoS Genet. 2007;3:2023–2036. doi: 10.1371/journal.pgen.0030181. [DOI] [PMC free article] [PubMed] [Google Scholar]
- 32.Waterland R.A., Kellermayer R., Laritsky E., Rayco-Solon P., Harris R.A., Travisano M., Zhang W., Torskaya M.S., Zhang J., Shen L., et al. Season of conception in rural gambia affects DNA methylation at putative human metastable epialleles. PLoS Genet. 2010;6:e1001252. doi: 10.1371/journal.pgen.1001252. [DOI] [PMC free article] [PubMed] [Google Scholar]
- 33.Waterland R.A., Kellermayer R., Rached M.T., Tatevian N., Gomes M.V., Zhang J., Zhang L., Chakravarty A., Zhu W., Laritsky E., et al. Epigenomic profiling indicates a role for DNA methylation in early postnatal liver development. Hum. Mol. Genet. 2009;18:3026–3038. doi: 10.1093/hmg/ddp241. [DOI] [PMC free article] [PubMed] [Google Scholar]
- 34.Lai K., Kaspar B.K., Gage F.H., Schaffer D.V. Sonic hedgehog regulates adult neural progenitor proliferation in vitro and in vivo. Nat. Neurosci. 2003;6:21–27. doi: 10.1038/nn983. [DOI] [PubMed] [Google Scholar]
- 35.Yu D.H., Ware C., Waterland R.A., Zhang J., Chen M.H., Gadkari M., Kunde-Ramamoorthy G., Nosavanh L.M., Shen L. Developmentally programmed 3′ CpG island methylation confers tissue- and cell-type-specific transcriptional activation. Mol. Cell. Biol. 2013;33: 1845–1858. doi: 10.1128/MCB.01124-12. [DOI] [PMC free article] [PubMed] [Google Scholar]
- 36.Bouret S.G., Draper S.J., Simerly R.B. Trophic action of leptin on hypothalamic neurons that regulate feeding. Science. 2004;304:108–110. doi: 10.1126/science.1095004. [DOI] [PubMed] [Google Scholar]
- 37.Shimogori T., Lee D.A., Miranda-Angulo A., Yang Y., Wang H., Jiang L., Yoshida A.C., Kataoka A., Mashiko H., Avetisyan M., et al. A genomic atlas of mouse hypothalamic development. Nat. Neurosci. 2010;13:767–775. doi: 10.1038/nn.2545. [DOI] [PMC free article] [PubMed] [Google Scholar]
- 38.Wu H., Coskun V., Tao J., Xie W., Ge W., Yoshikawa K., Li E., Zhang Y., Sun Y.E. Dnmt3a-dependent nonpromoter DNA methylation facilitates transcription of neurogenic genes. Science. 2010;329:444–448. doi: 10.1126/science.1190485. [DOI] [PMC free article] [PubMed] [Google Scholar]
- 39.Fan G., Martinowich K., Chin M.H., He F., Fouse S.D., Hutnick L., Hattori D., Ge W., Shen Y., Wu H., et al. DNA Methylation controls the timing of astrogliogenesis through regulation of JAK-STAT signaling. Development. 2005;132:3345–3356. doi: 10.1242/dev.01912. [DOI] [PubMed] [Google Scholar]
- 40.Coskun V., Tsoa R., Sun Y.E. Epigenetic regulation of stem cells differentiating along the neural lineage. Curr. Opin. Neurobiol. 2012;22:762–767. doi: 10.1016/j.conb.2012.07.001. [DOI] [PMC free article] [PubMed] [Google Scholar]
- 41.Lister R., Mukamel E.A., Nery J.R., Urich M., Puddifoot C.A., Johnson N.D., Lucero J., Huang Y., Dwork A.J., Schultz M.D., et al. Global epigenomic reconfiguration during mammalian brain development. Science. 2013;341:1237905. doi: 10.1126/science.1237905. [DOI] [PMC free article] [PubMed] [Google Scholar]
- 42.Liu A., Niswander L.A. Bone morphogenetic protein signalling and vertebrate nervous system development. Nat. Rev. Neurosci. 2005;6: 945–954. doi: 10.1038/nrn1805. [DOI] [PubMed] [Google Scholar]
- 43.Sabo J.K., Kilpatrick T.J., Cate H.S. Effects of bone morphogenic proteins on neural precursor cells and regulation during central nervous system injury. Neuro-Signals. 2009;17:255–264. doi: 10.1159/000231892. [DOI] [PubMed] [Google Scholar]
- 44.Hu J.G., Zhang Y.X., Qi Q., Wang R., Shen L., Zhang C., Xi J., Zhou J.S., Lu H.Z. Expression of BMP-2 and BMP-4 proteins by type-1 and type-2 astrocytes induced from neural stem cells under different differentiation conditions. Acta Neurobiol. Exp. 2012;72:95–101. doi: 10.55782/ane-2012-1884. [DOI] [PubMed] [Google Scholar]
- 45.Saueressig H., Burrill J., Goulding M. Engrailed-1 and netrin-1 regulate axon pathfinding by association interneurons that project to motor neurons. Development. 1999;126:4201–4212. doi: 10.1242/dev.126.19.4201. [DOI] [PubMed] [Google Scholar]
- 46.Sapir T., Geiman E.J., Wang Z., Velasquez T., Mitsui S., Yoshihara Y., Frank E., Alvarez F.J., Goulding M. Pax6 and engrailed 1 regulate two distinct aspects of renshaw cell development. J. Neurosci. 2004;24:1255–1264. doi: 10.1523/JNEUROSCI.3187-03.2004. [DOI] [PMC free article] [PubMed] [Google Scholar]
- 47.Fuchs J., Stettler O., Alvarez-Fischer D., Prochiantz A., Moya K.L., Joshi R.L. Engrailed signaling in axon guidance and neuron survival. Eur. J. Neurosci. 2012;35:1837–1845. doi: 10.1111/j.1460-9568.2012.08139.x. [DOI] [PubMed] [Google Scholar]
- 48.Dessaud E., McMahon A.P., Briscoe J. Pattern formation in the vertebrate neural tube: a sonic hedgehog morphogen-regulated transcriptional network. Development. 2008;135:2489–2503. doi: 10.1242/dev.009324. [DOI] [PubMed] [Google Scholar]
- 49.Machold R., Hayashi S., Rutlin M., Muzumdar M.D., Nery S., Corbin J.G., Gritli-Linde A., Dellovade T., Porter J.A., Rubin L.L., et al. Sonic hedgehog is required for progenitor cell maintenance in telencephalic stem cell niches. Neuron. 2003;39:937–950. doi: 10.1016/s0896-6273(03)00561-0. [DOI] [PubMed] [Google Scholar]
- 50.Aran D., Sabato S., Hellman A. DNA Methylation of distal regulatory sites characterizes dysregulation of cancer genes. Genome Biol. 2013;14:R21. doi: 10.1186/gb-2013-14-3-r21. [DOI] [PMC free article] [PubMed] [Google Scholar]
- 51.Brewer G.J., Torricelli J.R. Isolation and culture of adult neurons and neurospheres. Nature Protocols. 2007;2:1490–1498. doi: 10.1038/nprot.2007.207. [DOI] [PubMed] [Google Scholar]
- 52.Cannon J.R., Greenamyre J.T. Neun is not a reliable marker of dopamine neurons in rat substantia nigra. Neurosci. Lett. 2009;464:14–17. doi: 10.1016/j.neulet.2009.08.023. [DOI] [PubMed] [Google Scholar]
- 53.Cheung I., Shulha H.P., Jiang Y., Matevossian A., Wang J., Weng Z., Akbarian S. Developmental regulation and individual differences of neuronal H3K4me3 epigenomes in the prefrontal cortex. Proc. Natl Acad. Sci. USA. 2010;107:8824–8829. doi: 10.1073/pnas.1001702107. [DOI] [PMC free article] [PubMed] [Google Scholar]
- 54.Zhu L., Yang Y., Xu P., Zou F., Yan X., Liao L., Xu J., O'Malley B.W., Xu Y. Steroid receptor coactivator-1 mediates estrogenic actions to prevent body weight gain in female mice. Endocrinology. 2013;154:150–158. doi: 10.1210/en.2012-2007. [DOI] [PMC free article] [PubMed] [Google Scholar]
- 55.Grove K.L., Grayson B.E., Glavas M.M., Xiao X.Q., Smith M.S. Development of metabolic systems. Physiol. Behav. 2005;86:646–660. doi: 10.1016/j.physbeh.2005.08.063. [DOI] [PubMed] [Google Scholar]
- 56.Numata S., Ye T., Hyde T.M., Guitart-Navarro X., Tao R., Wininger M., Colantuoni C., Weinberger D.R., Kleinman J.E., Lipska B.K. DNA Methylation signatures in development and aging of the human prefrontal cortex. Am. J. Hum. Genet. 2012;90:260–272. doi: 10.1016/j.ajhg.2011.12.020. [DOI] [PMC free article] [PubMed] [Google Scholar]
- 57.Waters E.M., Simerly R.B. Estrogen induces caspase-dependent cell death during hypothalamic development. J. Neurosci. 2009;29:9714–9718. doi: 10.1523/JNEUROSCI.0135-09.2009. [DOI] [PMC free article] [PubMed] [Google Scholar]
- 58.Kellermayer R., Balasa A., Zhang W., Lee S., Mirza S., Chakravarty A., Szigeti R., Laritsky E., Tatevian N., Smith C.W., et al. Epigenetic maturation in colonic mucosa continues beyond infancy in mice. Hum. Mol. Genet. 2010;19:2168–2176. doi: 10.1093/hmg/ddq095. [DOI] [PMC free article] [PubMed] [Google Scholar]
- 59.Langmead B., Trapnell C., Pop M., Salzberg S.L. Ultrafast and memory-efficient alignment of short DNA sequences to the human genome. Genome Biol. 2009;10:R25. doi: 10.1186/gb-2009-10-3-r25. [DOI] [PMC free article] [PubMed] [Google Scholar]
- 60.Eden E., Navon R., Steinfeld I., Lipson D., Yakhini Z. GOrilla: a tool for discovery and visualization of enriched GO terms in ranked gene lists. BMC Bioinformatics. 2009;10:48. doi: 10.1186/1471-2105-10-48. [DOI] [PMC free article] [PubMed] [Google Scholar]
- 61.Shen L., Guo Y., Chen X., Ahmed S., Issa J.P. Optimizing annealing temperature overcomes bias in bisulfite PCR methylation analysis. Biotechniques. 2007;42:48–58. doi: 10.2144/000112312. [DOI] [PubMed] [Google Scholar]
Associated Data
This section collects any data citations, data availability statements, or supplementary materials included in this article.