

Abstract
This paper addresses the question of whether or not interstitial fluid flow due to the blood circulation accounts for the observed periosteal bone formation associated with comprised venous return (venous stasis). Increased interstitial fluid flow induced by increased intramedullary pressure has been proposed to account for the periosteal response in venous stasis. To investigate the shear stresses acting on bone cell processes due to the blood circulation-driven interstitial fluid flow, a poroelastic model is extended to the situation in which the interstitial fluid flow in an osteon is driven by the pulsatile extravascular pressure in the osteonal canal as well as by the applied cyclic mechanical loading. Our results show that under normal conditions, the pulsatile extravascular pressure in the osteonal canal due to cardiac contraction (10mm Hg at 2 Hz) and skeletal muscle contraction (30mm Hg at 1 Hz) induce peak shear stresses on the osteocyte cell processes that are two orders of magnitude lower than those induced by physiological mechanical loading (100 microstrain at 1 Hz). In venous stasis the induced peak shear stress is reduced further compared to the normal conditions because, although the mean intramedullary pressure is increased, the amplitude of its pulsatile component is decreased. These results suggest that the interstitial fluid flow is unlikely to cause the periosteal bone formation in venous stasis. However, the mean interstitial fluid pressure is found to increase in venous stasis, which may pressurize the periosteum and thus play a role in periosteal bone formation.
Keywords: Interstitial fluid flow, Intramedullary pressure, Mechanical loading, Shear stress, Periosteum
1. Introduction
The ability of blood flow to influence bone growth, fracture healing, and remodeling has been recognized for a long time (Trueta, 1963; Kiaer, 1994). Impaired venous circulation (venous stasis) has been shown to stimulate periosteal bone formation or increase bone mass in the young dog (Kelly and Bronk, 1990), the young goat (Welch et al., 1993), and in a disuse rat model (hindlimb suspended) (Bergula et al., 1999). Venous stasis was induced in the experimental animals by applying tourniquets or vein ligation that lasted from 10 days (with additional 30 days recovery, Bergula et al., 1999) up to 42 days (Kelly and Bronk, 1990) before the bones were examined. There are many other studies demonstrating similar effects (e.g., Lilly and Kelly, 1970; Arnoldi et al., 1972; Green and Griffin, 1982; Liu and Ho, 1991). The underlying mechanism of the periosteal bone formation induced by venous stasis, however, remains unclear.
Factors associated with bone vasculature such as changes of metabolites and interstitial fluid flow have been proposed to cause the periosteal bone formation found with venous stasis. The blocked or compromised venous drainage increases bone's hydraulic resistance to the arterial supply, which may decrease the supply of nutrients and oxygen to the bone and the removal of CO2 and other metabolites as well. Changes of oxygen tension, CO2 tension, and local pH have been found in bone callus and bone necrosis (reviewed in Kiaer, 1994). This paper does not focus on these metabolic factors, although they may be important stimuli for new bone formation in venous stasis. Instead, we focus on the hydraulic pressure changes associated with venous stasis.
Many investigators have found an increase in mean pressure and a decrease in pressure oscillation associated with the pulse (pulsatile pressure) inside both the venous stasis-affected veins and the marrow cavity (e.g., Kelly and Bronk, 1990; Welch et al., 1993; Bergula et al., 1999), as well as in human femoral heads with necrosis (reviewed in Ficat and Arlet, 1980). The increased intramedullary pressure has been proposed to produce increased interstitial fluid flow (Kelly and Bronk, 1990; Hillsley and Frangos, 1994; Welch et al., 1993; Bergula et al., 1999) and increased transcapillary filtration (Kelly et al., 1990; Bronk et al., 1993), which is believed to produce fluid shear stresses acting on the bone cell processes inside the canaliculi. A recent in vivo study (Qin et al., 2003) has implicated increased interstitial fluid flow for the periosteal bone adaptation after pulsatile pressurization of the marrow cavity. In cell culture studies fluid flow has been shown to increase the expression of the cyclic adenosine monophosphate (cAMP), intracellular calcium (Ca2+), nitric oxide (NO), prostaglandin E2 (PGE2), osteopontin, and transforming growth factor beta 1 (TGF-beta 1); to regulate the expression of cyclooxygenase-2 (COX-2), c-Fos, and a gap junction protein Cx43; to activate mitogen-activated protein kinase (ERK and p38), as well as to stimulate proliferation in bone cells (e.g., Reich et al., 1990; Williams et al., 1994; Hung et al., 1995; Klein-Nulend et al., 1995; Ajubi et al., 1996; Johnson et al., 1996; Smalt et al., 1997; Owan et al., 1997; Pavalko et al., 1998; Sakai et al., 1998; Allen et al., 2000; Cheng et al., 2001; You et al., 2001b; Wadhwa et al., 2002; Kasperk et al., 2002). However, the magnitude of fluid shear stresses due to blood circulation has never been quantitatively examined.
To test the hypothesis that increased interstitial fluid flow causes the periosteal bone formation in venous stasis, an osteon model is developed to theoretically connect interstitial fluid flow with both the bone microcirculation and mechanical loading. In this model, there are two driving forces for the interstitial fluid flow in the lacunar-canalicular porosity: one is the applied cyclic mechanical loading, and the other is the pulsatile extravascular pressure in the osteonal canal, which is assumed to be the same as the intramedullary pressure for the following reasons. Since the larger vascular canals (∼30–40μm in diameter) have a much higher permeability than the lacunar-canalicular pores (∼0.4 μm in diameter), the interstitial fluid relaxes on a time scale of less than 0.01 s and an excess pressure is unlikely to build up within the vascular pores (Zhang et al., 1998; Wang et al., 1999). Even if a fluid pressure gradient is built up in the extravascular space within the vascular canals, the pressure gradient will, in general, be very small, as evidenced in the extravascular fluid velocity that is much less than the blood flow velocity in the capillaries. Therefore, the extravascular fluid pressure within the osteonal canals in the cortex is nearly spatially uniform and equal to the instantaneous intramedullary pressure in the marrow cavity. As a representative unit, a single osteon instead of a whole bone is modeled here.
Unlike previous theoretical models that focus on tracer distribution under circulatory pressure (Dillaman et al., 1991; Keanini et al., 1995), the new model developed here aims to quantitatively investigate the interstitial fluid flow due to blood circulation and mechanical loading. As fluid shear stress has been proposed to be a possible stimulating signal for the osteocytes and osteoblasts that are interconnected via gap junctions in their cell processes (Weinbaum et al., 1994; Hillsley and Frangos, 1994), the interstitial fluid flow induced by mechanical loading and blood circulation is examined in terms of peak shear stresses on the bone cell process. However, we recognize that the mechanisms by which interstitial fluid flow stimulates bone cells are not very clear. For example, a recent study (You et al., 2001a) suggests that another possible mechanism for osteocyte excitation is via deformation of the cell cytoskeleton due to the tension that is generated by the fluid drag force acting on transverse filaments that tether the cell process to the canalicular wall. In the present study, fluid shear stress, one of most well studied secondary effects of fluid flow, is used as a useful indicator of interstitial fluid flow.
2. Methods
2.1. Theoretical model for bone fluid flow
The problem considered here is that of determining the bone interstitial fluid pressure field p(r, t) in the lacunar-canalicular porosity of an osteon. The osteon is modeled as a right circular cylinder of radius ro containing an osteonal canal that is modeled as a smaller concentric, right circular cylinder of radius ri The annular region of the osteon contains the lacunar-canalicular porosity (Fig. 1a). The interstitial fluid is assumed to flow through the lacunar-canalicular channels surrounding the cell processes of the osteoblasts or osteocytes as in earlier models (Fig. 1b, Weinbaum et al., 1994), with the channel assumed to be filled with a pericellular fiber matrix. A recent electron microscopic study has provided strong evidence of the existence of such a fiber matrix (You, 2002). The mineralized matrix surrounding the lacunar-canalicular porosity has a Young's modulus E, and bone permeability at the lacunar-canalicular porosity level is theoretically determined by the detailed structures of the pericellular fiber matrix and the canalicular channels, since there are no experimental measurements of the permeability at this level (Weinbaum et al., 1994; Cowin et al., 1995).
Fig. 1.
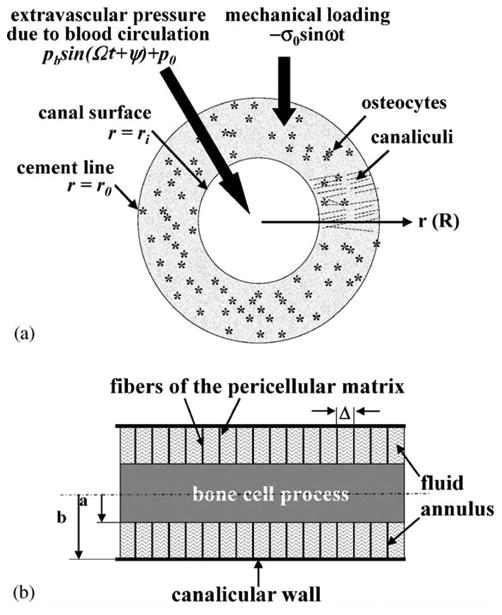
(a) A cross-section of an osteon with an outer radius ro and an inner radius ri. A cyclic mechanical loading with a uniform stress σ = −σo sin ωt is applied axially to the osteon. At the interior surface, the extravascular fluid pressure is assumed to be cyclic (p = pb sin(Ωt + Ψ)+p0) due to the heart beat, while the boundary condition at the cement line (the outer surface) is that of no leakage of bone fluid (∂p/∂r = 0). Osteocytes encased in the mineralized matrix are linked together with each other and with the osteoblasts lining the central canal surface via cell processes located in the canalicular channels. (b) A schematic model of a longitudinal cross-section of a canaliculus. The cell process is located in the center of the canaliculus. A pericellular fiber matrix fills the fluid space between the cell process (radius a) and the canalicular wall (radius b). The spacing between the fibers is Δ. The lacunar-canalicular porosity permeability is calculated from these structural parameters and the interstitial fluid pressure within the osteon is calculated using poroelasticity theory. Because of the presence of cytoskeletal actin bundles within the cell process, the circumferential deformation of the cell process is predicted to be less than 5% for physiological loading and thus is neglected in this model (You et al., 2001a). The shear stress induced by the canalicular fluid flow is calculated on the surface of the cell process.
The osteon is subjected to two types of oscillatory loading. The first oscillatory loading is a cyclic applied axial stress with an amplitude σo and an applied circular frequency ω (σ = −σo sin ωt). The second oscillatory loading is implemented by a boundary condition at the osteonal canal surface (r = ri) that requires that extravascular fluid pressure be equal to the intramedullary pressure. The local extravascular fluid pressure is represented by p = pb sin(Ωt + ψ) + p0 where p0 is the mean pressure (DC component) and the sinusoidal term (AC component) is due to the fluctuation of the intramedullary fluid pressure caused by the arterial pulse pressure in the nutrient artery generated by cardiac contraction (Brookes and Revell, 1998; Ficat and Arlet, 1980). The amplitude of the pulsatile fluid pressure is denoted by pb, its angular frequency by Ω (i.e., the heart rate), and its phase angle with respect to the applied axial loading is ψ. The interstitial fluid flow due to this pulse-driven intramedullary pressure is called the blood circulation-driven fluid flow in the following text, because the driving force is the blood circulation. Due to the relative impermeability of the outer boundary (cement line) of the osteon, a non-leakage boundary condition is assumed as in our previous models (Zeng et al., 1994; Wang et al., 2000). Wang et al. (1999) have shown that the permeability of the cement line has only a relatively modest effect on the detailed pressure profiles in the osteon due to fluid flowing across the cement line.
The fluid pore pressure, radial fluid pressure gradient, and shear stress are derived in the next three sections using poroelasticity theory. To facilitate the comparison of the relative contribution of mechanical loading and blood circulation to the interstitial fluid flow, we decompose the fluid pore pressure, radial fluid pressure gradient, and shear stress into the mechanical load- and blood-induced components. The parameters associated with the load-induced component are denoted by a subscript l and those associated with blood-induced component are denoted by a subscript b.
2.1.1. Bone fluid pressure
A closely related problem was solved by Zeng et al. (1994) where an osteon was subjected to an axial cyclic stress alone. Zeng et al. (1994) employed a boundary condition that requires the fluid pore pressure to vanish at the canal surface (p = 0 at r = ri). The problem considered here replaces that boundary condition with one that requires that the bone fluid pore pressure equals the extravascular pressure, p = pb sin(Ωt + Ψ) + p0, at the canal surface (r = ri). The partial differential equation in cylindrical coordinates for the dimensionless bone fluid pressure P is
| (1) |
where R is a dimensionless radial coordinate, θ is the cylindrical coordinate and τ is a dimensionless time given by τ = t/τr where τr is the characteristic relaxation time of the pore fluid pressure via the lacunar-canalicular porosity in the osteon (Zeng et al., 1994). The non-dimensional variables R, Ri, T, W and P are defined as
| (2) |
where r is the radial coordinate, ro is the radius of the cement line, ri is the radius of the osteonal canal, W is the ratio of the frequency of the pulsatile blood pressure and the mechanical loading, and B is the Skempton pore pressure coefficient that represents the relative compressibility of the fluid and solid phases of the porous bone matrix (Cowin, 1999; Zhang et al., 1998). The boundary conditions due to the blood pressure, expressed in terms of the dimensionless pressure field P, are
| (3) |
When pb = 0 these boundary conditions reduce to those of Zeng et al. (1994). The solution to Eq. (1) subject to the above boundary conditions is obtained as follows (the detailed derivation is given in Appendix A):
| (4) |
where Re is the real part, J(R, T) is given by
| (5) |
and Io, Ko, I1, and K1 are modified Bessel functions of the first and second kind. In order to obtain the fluid pore pressure from the dimensionless fluid pressure, we multiply both sides of Eq. (4) by the factor σ0BT/3, substitute ωt for Tτ and Ωt for WTτ and then rewrite the complex functions using real-valued functions. The fluid pore pressure p is then given by
| (6) |
where U1, V1, Ub, Vb are real-valued functions defined as follows:
| (7) |
Combining the sinusoidal terms with the same frequency, the fluid pore pressure is the summation of three terms:
| (8) |
where the coefficients and phases (A1, ϕ1, Ab, ϕ2) associated with the two sinusoidal components are
| (9) |
In Eq. (8), the first sinusoidal term with the frequency of the mechanical loading ω is caused by mechanical loading; the second sinusoidal term with frequency Ω and the constant term are caused by the blood pressure. The mean extravascular pressure p0 induces a spatially uniform interstitial fluid pressure, but we will show next that it makes no contribution to the fluid pressure gradient or shear stress. Therefore, we are going to neglect this DC component and, instead, focus on the time-varying (AC) component (pulsatile extravascular pressure) only. The amplitudes of the load and blood-induced fluid pressure components are
| (10) |
where A1 and Ab are functions of spatial position (R) and frequency of the driving forces (see Eqs. (7) and (9)).
2.1.2. Fluid pressure gradient
The dimensionless fluid pressure gradient (i.e., the rate of pressure change in the radial direction) is readily derived from Eq. (4). The fluid pressure gradient is obtained from the dimensionless expression as
| (11) |
where , , , are real-valued functions defined as follows:
| (12) |
and
| (13) |
Combining the sinusoidal terms with the same frequency, the fluid pressure gradient consists of two sinusoidal components caused by the mechanical loading and pulsatile extravascular pressure, respectively:
| (14) |
where the coefficients and phases associated with the two sinusoidal components are
| (15) |
In Eq. (14), the first sinusoidal term is the load-induced component with the loading frequency ω; the second term is the blood-induced pressure gradient component with the frequency of Ω. Their amplitudes are
| (16) |
where and are functions of spatial position (R) and frequencies of the driving forces (see Eqs. (12), (13) and (15)).
2.1.3. Shear stress
Previous models have shown that the shear stress, s(a), experienced by a cell process of radius a in a canaliculus is directly proportional to the bone fluid pressure gradient and is also related to the detailed structure of the canalicular channel and the pericellular matrix (Weinbaum et al., 1994; Zeng et al., 1994), as shown below:
| (17) |
| (18) |
where b is the canalicular wall radius, Δ is the fiber spacing of the matrix in the canalicular channel, q is the ratio of the canalicular wall radius to the radius of the cell process (q = b/a), and γ is the non-dimensional ratio γ = b/Δ (Weinbaum et al., 1994; Zeng et al., 1994).
Since the load- and blood-induced radial fluid pressure gradients are sinusoidal (Eq. (14)), their induced fluid shear stresses on the cell process are also sinusoidal with the following amplitudes:
| (19a) |
| (19b) |
2.2. Parameter values
The osteon we model here has a canal radius ri = 20 μm and a cement line radius ro = 100 μm (Zeng et al., 1994; Cooper et al., 1966), giving a dimensionless Ri = 0.20. The dimensionless coordinate R = 0.2→1 thus represents the bone annulus of the osteon. The relative compressibility between the fluid and solid phases B is taken to be 0.43 (Zhang et al., 1998). Most venous stasis experiments used young animals, thus we employ a Young's modulus for young bone, E = σ/ε = 10 GPa (i.e., an axial stress of 1 MPa (σ) produces 100 microstrain (ε) in bone) (Torzilli et al., 1982). Except for the permeability parametric study described below, the following geometric data will be employed: the canaliculus has an outer radius b = 200 nm, a cell process radius a = 100 nm, giving q = b/a = 2. The fiber spacing Δ is chosen to be 7 nm as used in Zeng et al. (1994).
The spatial distribution profiles of the pore fluid pressure, pressure gradients, and resultant fluid shear stress on the cell process membrane induced by the mechanical loading and the pulsatile extravascular pressure in the osteonal canal due to blood circulation are calculated using Eqs. (10), (16) and (19). For mechanical loading two fundamental loading regimes are considered: one with a magnitude of 100 microstrain and a frequency of 1 Hz, which is associated with slow locomotion, and the other with a smaller magnitude (10 microstrain) and a higher frequency (20 Hz), which is associated with maintaining posture (Rubin et al., 2001). For pulsatile extravascular pressure that equals the intramedullary pressure, three cases are considered: the first is associated with normal cardiac contractions and has a magnitude of 10 mm Hg (1.33 kPa) (Brookes and Revell, 1998) and a frequency of 2 Hz (2 Hz is the heart rate for big laboratory animals such as the dog and goat (Lawson, 2000)); the second is associated with skeletal muscle contraction with an increased amplitude of 30 mm Hg (3.99 kPa) and a lower frequency of 1 Hz (Shim et al., 1972; Ficat and Arlet, 1980); and the third is associated with venous stasis and has a pulsatile magnitude reduced from normal conditions (2 mm Hg, Ficat and Arlet, 1980) and a frequency of 2 Hz. We are investigating the skeletal muscle contribution of the second case because muscle contraction has been shown to increase the intramedullary pressure, with each contraction producing a fluctuation larger than that due to the pulse pressure from the heartbeat (Shim et al., 1972; Ficat and Arlet, 1980).
Since loading frequency has been found to affect the resultant shear stress significantly (Zeng et al., 1994), the peak shear stress induced by either the mechanical loading or the pulsatile extravascular pressure due to blood circulation is evaluated as a function of loading or pulse frequency. The amplitude of the mechanical loading and the pulsatile extravascular pressure are assumed to remain the same, 100 microstrain and 10 mm Hg, respectively, while their frequencies are varied from 1 to 20 Hz. These numerical values are chosen parametrically in order to study the frequency response of the shear stress. We understand that the in vivo pulsatile extravascular pressure due to the heart beating is unlikely to have frequency components higher than 20 Hz (Lawson, 2000) and the high-frequency mechanical strains usually have decreased amplitudes (Fritton et al., 2000).
To compare the relative magnitude of interstitial fluid flow for different loading conditions as well as for the pulsatile extravascular pressures due to blood circulation, we choose the peak shear stress as the representative parameter for the temporally and spatially varying shear stress stimulus since bone cells have been shown to respond to the magnitude of shear stress in a dose-dependent manner (Reich et al., 1990; McAllister and Frangos, 1999; Allen et al., 2000; Wadhwa et al., 2002). In addition, peak shear stress has been found to occur at the canalicular openings on the osteonal canal wall in mechanically loaded bone (Weinbaum et al., 1994; Wang et al., 1999); osteoblasts and bone lining cells are also located on the osteonal canal surfaces.
Since the magnitude of the peak shear stress induced by the mechanical loading and pulsatile extravascular pressure varies with the numerical values of the input parameters used in the model, a parametric study is performed to show the sensitivity of the output (shear stress) to the inputs of the model. Among the many input parameters we used, bone permeability has previously been shown to have the most significant effect on the shear stress (Zhang et al., 1998; Wang et al., 1999). Since the bone permeability is estimated from the fiber spacing of the pericellular matrix and the fluid space in the canalicular channels (Weinbaum et al., 1994; Cowin et al., 1995), shear stress is evaluated for a fiber spacing ranging from 4 to 20 nm and a fluid annular spacing ranging from 50 to 150 nm.
3. Results
The total interstitial fluid flow is a linear summation of the load- and blood-induced components. Since both the mechanical loading and the pulsatile extravascular pressure in the osteonal canal are modeled as temporal sinusoidal signals, the fluid flow induced by the two driving forces is also sinusoidal in the time domain. The amplitudes of the sinusoidal interstitial fluid pressure and shear stress applied on the cell membrane vary with location and depend on the frequency of the driving force (Figs. 2 and 3).
Fig. 2.

The spatial distribution profiles of the interstitial fluid pressure in the radial coordinate from the osteonal canal surface (R = 0.2) to the cement line (R = 1) depend on the type of the loading (mechanical or blood flow) and the loading frequency. (a) The normalized amplitude of the fluid pressure induced by mechanical loading increases radially from the canal to the cement line. The induced fluid pressure is much higher at 20 Hz than at 1 Hz across the osteon. (b) The normalized amplitude of the blood-induced fluid pressure decreases both across the osteon radius and with increasing frequency of the pulsatile extravascular pressure due to blood circulation. At 1 Hz, the pulsatile pressure within the osteonal canal can propagate to the whole osteon nearly uniformly with less than 5% decay in magnitude. At 20 Hz, the pulsatile pressure decreases rapidly from the canal to the cement line, with the amplitude of the pulsatile pressure at the cement line only 50% of that in the canal.
Fig. 3.

The spatial distribution of the shear stress on the cell process membrane induced by (a) mechanical loading and (b) pulsatile extravascular pressure due to blood circulation. Since the fluid pressure gradients are proportional to shear stresses, the spatial distribution of the fluid pressure gradients has the same pattern (profile) as shown here. Two typical mechanical strains are considered; one is related to locomotion (100 microstrain (με) at 1 Hz) and the other is associated with posture (10 microstrain at 20 Hz). The two extravascular pressures in the osteonal canal considered are a normal pulse pressure due to the heart beat (10 mm Hg at 2 Hz), and an increased pressure induced by repeated skeletal muscle contraction and release (30 mm Hg at 1 Hz). The peak shear stresses and the fluid pressure gradients induced by both mechanical loading and blood circulation are located at the inner canal surface of the osteon.
The amplitude of load-induced fluid pore pressure increases radially from the canal wall to the cement line and increases with increased loading frequency (Fig. 2a). For a mechanical loading with a given magnitude, the induced fluid pressure is much higher at 20 Hz than at 1 Hz (Fig. 2a). At lower loading frequencies the load-induced fluid flow has enough time to relax across the osteon and thus it is difficult for the fluid pressure to build up. At higher loading frequencies the time period available for fluid relaxation is shorter and an excess fluid pressure can therefore be produced. This result is consistent with our previous studies (Weinbaum et al., 1994; Cowin et al., 1995; Wang et al., 1999).
On the other hand, the amplitude of blood-induced fluid pore pressure decreases both across the osteon radius and with increasing frequency of the pulsatile extravascular pressure due to the heartbeat (Fig. 2b). At 1 Hz, the pulsatile pressure within the osteonal canal can propagate to the whole osteon nearly uniformly with less than 5% decay in magnitude. At 20 Hz, the pulsatile pressure decreases rapidly at locations further away from the osteonal canal, with the amplitude of pulsatile fluid pressure at the cement line only 50% of that in the canal. If the cement line had been leaky, the decrease in pore fluid pressure across the osteon would be reduced. This model also predicts that a mean extravascular pressure in the central canal will cause a uniform pore pressure distribution across the osteon (Eqs. (6) and (8)).
Both the load- and blood-induced fluid flows have the same spatial distribution pattern of the fluid pressure gradients (and resulting shear stress) (Fig. 3) despite the apparent different appearance of fluid pressure profiles (Fig. 2). The largest pressure gradients (and peak shear stresses) are found at the osteonal canal wall surface (R = Ri) and the pressure gradients (shear stresses) vanish at the cement line (R = 1) if the cement line is impermeable (Fig. 3). A small but finite shear stress would be expected at this location if the cement line were leaky. Two typical mechanical loading conditions, 100 microstrain at 1 Hz associated with locomotion and 10 microstrain at 20 Hz associated with posture, produce shear stress of the same approximate magnitude (Fig. 3). If the magnitude of the cyclic mechanical loading or extravascular pressure in the osteonal canal is held constant, the peak shear stress at the canal wall surface exhibits a 15-fold increase as the frequency increases from 1 to 20 Hz (Table 1).
Table 1. Frequency-dependent peak shear stress (dyn/cm2) induced by cyclic mechanical loading and blood circulationa.
| Frequency | 1 Hz | 2 Hz | 5 Hz | 10 Hz | 20 Hz |
|---|---|---|---|---|---|
| Load: 100 microstrain | 16.0 | 32.0 | 80.0 | 150 | 250 |
| Blood: 10 mm Hg | 0.15 | 0.30 | 0.75 | 1.4 | 2.4 |
The peak value of shear stress occurs at the osteonal canal surface at different frequencies. The ratio between the shear stress induced by the mechanical loading (100 microstrain) and the pulsatile pressure in the osteonal canal (10 mm Hg) is ∼109 for all the frequencies.
In general, the peak shear stress acting on the cell process induced by blood circulation is at least two orders of magnitude smaller than that induced by physiological mechanical loading (Tables 1 and 2). In venous stasis (2 mm Hg at 2 Hz), the peak shear stress is 0.06 dyn/cm2, which is several-fold smaller than those induced by the normal pulse pressure (0.3 dyn/cm2, 10 mm Hg at 2 Hz) and the raised extravascular pressure due to skeletal muscle contraction (0.45 dyn/cm2, 30 mm Hg at 1 Hz) and is ∼100 times smaller than those induced by mechanical strains associated with slow locomotion (16 dyn/cm2, 100 microstrain at 1 Hz) and maintenance of posture (25 dyn/cm2, 10 microstrain at 20 Hz). Compared to the case of slow locomotion where the induced shear stress is assumed to be a reference (100%), the shear stress induced by maintenance of posture, normal cardiac contraction, skeletal muscle contraction, and venous stasis is 160%, 2%, 3%, and 0.4% of the reference, respectively (Table 2).
Table 2. Peak shear stress for different loading conditions.
| Loading conditions | Locomotion (100 microstrain, 1 Hz) |
Posture (10 microstrain, 20 Hz) |
Pulse extravascular pressure (10 mm Hg, 2 Hz) |
Raised extravascular pressure by muscle contraction (30 mm Hg, 1 Hz) |
Reduced extravascular pressure in venous stasis (2 mm Hg, 2 Hz) |
|---|---|---|---|---|---|
| Shear stress (dyn/cm2) | 16 | 25 | 0.30 | 0.45 | 0.06 |
| Percentage relative to locomotiona | 100% | 160% | 2.0% | 3.0% | 0.4% |
The percentage relative to locomotion is calculated by dividing the peak shear stress induced by an individual loading condition by that induced by locomotion.
The peak shear stress induced by the normal pulse pressure in the osteonal canal is predicted to vary with bone permeability (Table 3). When the fiber spacing is varied from 4 to 20 nm and the fluid annulus is changed by a factor of 3, bone permeability varies over 2 orders of magnitude and the peak shear stress calculated with this model varies by a factor of 10. The peak shear stress induced by mechanical loading has the same sensitivity to the model parameters as that induced by blood circulation shown in Table 3.
Table 3. Sensitivity of shear stress (dyn/cm2) to model parametersa.
| Frequency | 1 Hz | 2 Hz | 5 Hz | 10 Hz | 20 Hz |
|---|---|---|---|---|---|
| Δ = 4 nm | 0.24 | 0.48 | 1.1 | 1.6 | 2.00 |
| Δ = 7 nm | 0.15 | 0.30 | 0.75 | 1.4 | 2.4 |
| Δ = 20 nm | 0.08 | 0.16 | 0.39 | 0.79 | 1.6 |
| b − a = 50 nm | 0.74 | 1.4 | 2.7 | 3.5 | 3.9 |
| b − a = 100 nm | 0.15 | 0.30 | 0.75 | 1.4 | 2.4 |
| b − a = 150 nm | 0.06 | 0.12 | 0.32 | 0.63 | 1.2 |
Predicted peak shear stress on the cell process membrane obtained for different cases: first, where the fiber spacing Δ is taken to be 4, 7, or 20 nm with the width of the fluid annulus kept constant (b − a = 100 nm); and second, where the width of the fluid annulus b − a is taken to be 50, 100, or 150 nm while the fiber spacing remains at 7 nm. The magnitude of the pulsatile extravascular pressure in the osteonal canal is 10 mm Hg and there is no mechanical loading applied to the osteon.
4. Discussion
To explore the interstitial fluid flow effects of venous stasis, we have expanded our poroelastic model for bone interstitial fluid flow (Zeng et al., 1994) to the situation in which fluid flow in an osteon is driven by the pulsatile blood flow in the bone microvasculature as well as by the applied cyclic mechanical loading. This is the first model to provide a quantitative tool to investigate the relative contribution of blood circulation and mechanical loading to the interstitial fluid flow in terms of shear stress acting on the cell process membrane.
The development of venous stasis in bone is very complicated, involving dynamic changes in the interstitial and intravascular spaces. Although a long bone has multiple feeding and draining vessels (Brookes and Revell, 1998), once one of the big veins (e.g., femoral vein or nutrient vein) is ligated, or the muscle veins are collapsed due to a tourniquet, the ability of the system to drain the blood is compromised. More blood remains in the organ and is rerouted to the remaining functioning vessels. These vessels expand in size to accommodate the increased vascular resistance and as a consequence vascular pressure increases. This is also accompanied by an increased filtration flux across the vessel wall. Both the vessel dilation and the fluid filtration cause the extravascular pressure to rise because bone is a relatively rigid compartment. This raised extravascular pressure counteracts the increased vascular pressure and a new pressure equilibrium is achieved on a time scale of approximately one minute (Welch et al., 1993). As the vessel wall stretches it becomes stiffer, with the result that the pulsatile vascular pressure induced by cardiac contraction drops or disappears. This would explain why the intramedullary pulse pressure was found to dramatically decrease or even disappear during venous stasis (Ficat and Arlet, 1980).
Therefore, it is not surprising that, despite the increased mean intramedullary or venous pressure in venous stasis (Kelly and Bronk, 1990; Bergula et al., 1999; Welch et al., 1993), the fluid shear stress is instead found to decrease several-fold (0.06 dyn/cm2) compared to those induced by the cardiac contraction (0.3 dyn/cm2) and skeletal muscle contraction (0.45 dyn/cm2) and it is approximately two orders of magnitude lower than those induced by physiological mechanical loading (locomotion: 16 dyn/cm2; posture: 25 dyn/cm2) (Table 2). In the present model, the mean extravascular pressure in the osteonal canal (p0) is predicted to increase the interstitial fluid pressure in a spatial uniform manner (Eqs. (6) and (8)). Therefore, it does not produce any pressure difference spatially and thus causes no fluid flow in the mineralized matrix (Eq. (11)). The driving force for the interstitial fluid flow and the shear stress is the intramedullary or extravascular pressure oscillation due to the pulsatile blood pressure (pb) (Eqs. (14) and (19b)), which has been reported to greatly decrease or disappear in the condition of venous congestion (Stein et al., 1957; Shim et al., 1972; Ficat and Arlet, 1980).
Because of its relatively low magnitude, the decreased interstitial fluid flow in venous stasis is unlikely to account for the observed periosteal bone formation. Although the responses of bone cells to fluid flow depend on many factors such as the cell type (e.g., Klein-Nulend et al., 1995), flowing regimens such as steady, pulsatile, and oscillating flows (e.g., Jacobs et al., 1998; Jiang et al., 2002), the magnitude and temporal frequency of the shearing stresses (e.g., Bakker et al., 2001; Donahue et al., 2001; Jiang et al., 2002), as well as cell culture conditions such as serum content in the culture media (Allen et al., 2000), there is strong evidence that bone cells respond to shear stresses in a dose-dependent manner: as shear stresses increase, the responses increase and eventually level off (Reich et al., 1990; McAllister and Frangos, 1999; Allen et al., 2000; Bakker et al., 2001; Donahue et al., 2001; Wadhwa et al., 2002). Although small shear stresses of order of 0.1 dyn/cm2 have been shown to increase intracellular cAMP in osteoblasts (Reich et al., 1990), to increase intracellular Ca2+ in primary bone cell culture (with 2% serum in flowing medium, Allen et al., 2000), as well as to raise the COX-2 mRNA and protein expression in MC3T3 osteoblast-like cells (Wadhwa et al., 2002) compared to no-flow controls, the magnitudes of the responses are much smaller compared to those induced by higher shear stresses of order 5–10 dyn/cm2. In the venous stasis conditions modeled here, the blood-circulation induced shear stress is several-fold smaller in the experimental limbs (∼0.06 dyn/cm2) compared to the contralateral controls (∼0.3−0.45 dyn/cm2). This reduction of stimulation is unlikely to explain the increased periosteal bone formation in the experimental limbs.
In addition to the increased interstitial fluid flow, increased filtration across the capillary wall has also been proposed to induce interstitial fluid flow in venous stasis experiments, which could account for the periosteal bone formation (Kelly and Bronk, 1990; Bronk et al., 1993). This transcapillary flux is not included in the present model. The transcapillary fluid movement follows Starling's law, JA = LA{(Pc − Pi) − σ(Πc − Πi)}, which says that the filtration rate JA is determined by the hydraulic pressure difference between the capillary Pc and the surrounding tissue Pi as well as the osmotic pressure difference between the tissue Πi and the capillary Πc. The two coefficients LA and σ represent the fluid conductivity and reflection coefficient of the capillary wall, respectively. From Starling's law, an increased hydraulic pressure in the capillary Pc does not necessarily increase the transcapillary flux as suggested in Kelly et al. (1990) and Bronk et al. (1993). The sustained time of this increased flux has been shown to be very short (less than a minute, Welch et al., 1993), because bone is such an incompliant compartment and there are no lymphatic pathways in bone (Anderson, 1960; Bazantova, 1989). Therefore, transcapillary flux in venous stasis is unlikely to produce sustained increased interstitial fluid flow in the lacunar-canalicular porosity for osteocyte or osteoblast excitation.
One may ask then which signal triggers the periosteal response to venous congestion? If we look at the factors secondary to venous stasis, one pronounced phenomenon is the sustained high intramedullary pressure compared to controls (40 vs. 12 mm Hg in the dog (Kelly and Bronk, 1990); 29 vs. 16 mm Hg in the goat (Welch et al., 1993); 28 vs. 16 mm Hg in the rat (Bergula et al., 1999)). As predicted from our model, this increased intramedullary pressure will cause a nearly uniform increase of the interstitial fluid pressure, which is applied directly to the interior surface of the periosteum. We also note that the periosteum, a dense fibrous layer containing fibroblasts and precursor cells of chondrocytes, covers the external surface of a whole bone forming a nearly impermeable seal due to its relatively low permeability compared to the mineralized matrix (Rouhana et al., 1981; Li et al., 1987; Grimm and Williams, 1997). Therefore, in venous stasis the increased interstitial fluid pressure stretches the periosteum in a manner that is similar to the way pressurized air inside a balloon stretches its surface. The pressurization and stretching deformation of the periosteum due to the increased intramedullary pressure may be the signal that triggers the cellular activity that results in periosteal bone formation. However, this stretching deformation of the periosteum cannot be quantified at this time since the Young's modulus of the periosteum has not been measured.
Experimental studies have demonstrated that the periosteum responds to mechanical force or hydraulic pressure in vivo and in vitro. The periosteum has been shown to produce woven bone under direct pressurization in four-point bending experiments in vivo (Torrance et al., 1994). Rapid increase of periosteal gene expression (protooncogene c-fos, insulin-like growth factor I (IGF-I), transforming growth factor-beta (TGF-beta), and collagen type I) under mechanical forces has been found experimentally, suggesting that the acute periosteal response to external mechanical loading is a change in the pattern of gene expression, which may signal cell proliferation (Zaman et al., 1992; Raab-Cullen et al., 1994). In addition, periosteal explants have been shown to proliferate when immersed in a fluid bath under a pressure of 100 mm Hg in vitro (Saris et al., 1999; Mukherjee et al., 2001).
Based on the above analysis and experimental evidence, we postulate that the increased intramedullary pressure applied to the periosteum in venous stasis may cause the increased periosteal new bone growth. Compared to transcapillary influx that is short-lived, the high intramedullary pressure can be sustained up to 42 days (Kelly and Bronk, 1990). The elevated pressure on the periosteum may regulate related gene expression (Raab-Cullen et al., 1994), or change mass transport of these genes or other metabolic factors within the periosteum.
The present model provides useful insights into the periosteal bone formation in venous stasis. However, as an idealized model, it has several limitations. The first is that, since bone permeability is usually measured at the vascular porosity level and not at the lacunar-canalicular porosity level (Rouhana et al., 1981; Li et al., 1987; Grimm and Williams, 1997), we have calculated the lacunar-canalicular porosity permeability based on an assumed pericellular matrix in an idealized canalicular channel. We have shown that the parameters associated with the fiber matrix and the canalicular geometry would change the numerical value of the induced shear stress accordingly. However, the conclusion that the extravascular pressure due to blood circulation produces a much smaller shear stress in venous stasis than those induced by normal circulation and applied mechanical loads is valid for the whole range of the parameter changes. The second limitation is that the cement line is assumed to be impermeable although histological studies have shown canaliculi can pass through the cement line in vivo (e.g., Curtis et al., 1985). One of our previous studies (Wang et al., 1999) examined the effect of the cement line permeability on the load-induced fluid pressure profile. Although varying the cement line permeability was shown to change the local fluid pressure profile at the cement line, no significant change of pressure profiles (and thus pressure gradient) was found around the osteonal canals. Therefore, the peak shear stress, which is proportional to the pressure gradient, at the canal wall surface in vivo should not differ significantly from the current predictions using an impermeable cement line assumption. The third limitation is that the mechanical loading and the pulsatile extravascular pressure due to blood circulation are simplified as sinusoidal signals while in vivo they have much more complicated waveforms. As the model is a linear system, the fluid flow induced by mechanical loading or blood circulation of any arbitrary waveform can be decomposed into the summation of the fluid flows induced by a series of sinusoidal signals. We also only consider two typical mechanical strains, one associated with slow locomotion (100 microstrain at 1 Hz) and one associated with posture (10 microstrain at 20 Hz). We appreciate that the mechanical strains that a bone experiences in vivo have varied frequencies and magnitudes, depending on the species and age of the animal and the measurement location (Fritton et al., 2000; Fritton and Rubin, 2001). In the present model we chose a relatively low locomotion strain (100 microstrain) to represent walking and a higher strain (e.g., 1000 microstrain) would have shown an even lower relative contribution of blood circulation to shear stress.
The fourth limitation is that we only examine the magnitude of shear stress (peak shear stress) that the interstitial fluid flow produces on the bone cell surface in different loading conditions, although bone cells have been shown to respond to many parameters of fluid flow. Although the mechanisms by which the bone cells are stimulated have not been ascertained, shear stresses and other secondary effects of interstitial fluid flow have been proposed to be the stimuli for bone cells (Weinbaum et al., 1994; Hillsley and Frangos, 1994). In a recent study, You et al. (2001a) propose that the drag force induced by mechanical loading deforms the transverse fibrils of the pericellular matrix that tether the cell process to the canalicular wall and thus induces a hoop strain on the intracellular actin cytoskeleton. Since the hoop strain of the cytoskeleton and the shear stress on the cell process are both generated by the interstitial fluid flow, we should get similar predictions for the magnitude of mechanical strain induced by blood pressure, because the shear stress is proportional to the drag force and the relationship between the drag force and hoop strain, though not linear, can be approximated as such for small deformations of the cell process (You et al., 2001a).
In the present model, the extravascular fluid pressure inside the osteonal canal is assumed to be equal to the intramedullary pressure reported in the literature (i.e., mean value that is less than 100 mm Hg, pulsatile component ∼10 mm Hg, frequency 1–6 Hz (Ficat and Arlet, 1980)). We argue above that due to the high permeability of the vascular porosity in bone and the small fluid velocities in this space, the steady extravascular fluid pressure in an osteon will be nearly the same as the intramedullary pressure. However, because of the intrusive recording methods used in measuring intramedullary pressure (Stein et al., 1957; Azuma, 1964; Arnoldi et al., 1971; Shim et al., 1972; Wilkes and Visscher, 1975; Tondevold, 1983; Bergula et al., 1999; Zachos et al., 2001) and the heterogeneity of intramedullary tissue, which includes minute and numerous venous sinuses, arterioles, and venules, the intramedullary pressure recording may not be the tissue pressure, but the pressure of an artificial blood pool surrounding the recording tip instead. Therefore, it is not surprising that intramedullary pressure recordings show large variations depending on the local vasculature and the degree of the damage (Ficat and Arlet, 1980). Despite the big variation, most of the recordings of the pulsatile and mean intramedullary pressure in long bones under normal conditions fall in the range of 4–30 mm Hg and 10–100 mm Hg, respectively, for humans and larger laboratory animals such as the dog, goat, cat, and rabbit (Ficat and Arlet, 1980).
In summary, in order to evaluate the contribution of blood circulation to the interstitial fluid flow in bone, we have expanded our previous poroelastic models to assess quantitatively the relative contribution of two driving forces, mechanical loading and extravascular pressure due to blood circulation, to the interstitial fluid flow. Our results suggest that mechanical loading is the major contributor to shear stress that acts on the bone cell process membrane and that the dynamic component of the extravascular pressure due to blood circulation induces a much smaller shear stress. The present model suggests that the reduced blood flow-induced interstitial fluid flow is unlikely to account for the periosteal bone formation in venous stasis. The metabolic changes due to venous congestion, such as oxygen tension, carbon dioxide tension, and local pH value, may cause the periosteal response. Finally, we suggest that the increased extravascular fluid pressure in response to venous stasis may pressurize the periosteum, cause its deformation and play a role in the periosteal new bone growth.
Acknowledgments
We are indebted to Dr. Howard Winet for discussions on the subject of this paper and for bringing the work of Ficat and Arlet (1980) to our attention. This work was supported by a NIH/NIAMS grant (AR46429), PSC-CUNY Research Awards (63408, 63428), and a grant from the Whitaker Foundation (RG-01-0440).
Appendix A.
The partial differential equation of interest is
| (A.1) |
with the following boundary conditions:
Assuming P = P1 + N∗P2 + P0, where N = (3pb/σ0BT) and P0 = (3p0/σ0BT), P1 and P2 should satisfy the following equations and boundary conditions:
| (A.2) |
and
| (A.3) |
Using the complex method and separation of variables, the solution to Eq. (A.2) is given as
| (A.4) |
where Re is the real part and
To solve Eq. (A.3), we assume , substitute into Eq. (A.3), and then we get
| (A.5) |
Similar to Eq. (A.2), the solution of Eq. (A.5) is
| (A.6) |
Thus, the solution to Eq. (A.3) is
| (A.7) |
Therefore, the solution to Eq. (A.1) is
| (A.8) |
References
- Ajubi NE, Klein-Nulend J, Nijweide PJ, Vrijheid-Lammers T, Alblas MJ, Burger EH. Pulsating fluid flow increases prostaglandin production by cultured chicken osteocytes—a cytoskeleton-dependent process. Biochemical and Biophysical Research Communications. 1996;225:62–68. doi: 10.1006/bbrc.1996.1131. [DOI] [PubMed] [Google Scholar]
- Allen FD, Hung CT, Pollack SR, Brighton CT. Serum modulates the intracellular calcium response of primary cultured bone cells to shear flow. Journal of Biomechanics. 2000;33:1585–1591. doi: 10.1016/s0021-9290(00)00144-5. [DOI] [PubMed] [Google Scholar]
- Anderson W. Studies of the lymphatic pathways of bone and bone marrow. Journal of Bone and Joint Surgery. 1960;42A:716. [Google Scholar]
- Arnoldi CC, Lemperg R, Linderholm H. Immediate effect of osteotomy on the intramedullary pressure in the femoral head and neck in patients with degenerative osteoarthritis. Acta Orthopaedica Scandinavica. 1971;42:454–455. [PubMed] [Google Scholar]
- Arnoldi CC, Linderholm H, Mussbichler H. Venous engorgement and intraosseous hypertension in osteoarthritis of the hip. Journal of Bone and Joint Surgery, British Volume. 1972;54:409–421. [PubMed] [Google Scholar]
- Azuma H. Intraosseous pressure as a measure of hemodynamic changes in bone marrow. Angiology. 1964;15:396–406. doi: 10.1177/000331976401500903. [DOI] [PubMed] [Google Scholar]
- Bakker AD, Soejima K, Klein-Nulend J, Burger EH. The production of nitric oxide and prostaglandin E(2) by primary bone cells is shear stress dependent. Journal of Biomechanics. 2001;34:671–677. doi: 10.1016/s0021-9290(00)00231-1. [DOI] [PubMed] [Google Scholar]
- Bazantova I. The blood and lymph bed in Haversian bone. Folia Morphol. 1989;37:213–215. [PubMed] [Google Scholar]
- Bergula AP, Huang W, Frangos JA. Femoral vein ligation increases bone mass in the hindlimb suspended rat. Bone. 1999;24:171–177. doi: 10.1016/s8756-3282(98)00165-3. [DOI] [PubMed] [Google Scholar]
- Bronk JT, Meadows TH, Kelly PJ. The relationship of increased capillary filtration and bone formation. Clinical Orthopaedics. 1993;293:338–345. [PubMed] [Google Scholar]
- Brookes M, Revell WJ. Blood Supply to Bone. Springer; London: 1998. [Google Scholar]
- Cheng B, Zhao S, Luo J, Sprague E, Bonewald LF, Jiang JX. Expression of functional gap junctions and regulation by fluid flow in osteocyte-like MLO-Y4 cells. Journal of Bone and Mineral Research. 2001;16:249–259. doi: 10.1359/jbmr.2001.16.2.249. [DOI] [PubMed] [Google Scholar]
- Cooper RR, Milgram JW, Robinson RA. Morphology of the osteon. An electron microscopic study. Journal of Bone and Joint Surgery, American Volume. 1966;48:1239–1271. [PubMed] [Google Scholar]
- Cowin SC. Bone poroelasticity. Journal of Biomechanics. 1999;32:217–238. doi: 10.1016/s0021-9290(98)00161-4. [DOI] [PubMed] [Google Scholar]
- Cowin SC, Weinbaum S, Zeng Y. A case for bone canaliculi as the anatomical site of strain generated potentials. Journal of Biomechanics. 1995;28:1281–1297. doi: 10.1016/0021-9290(95)00058-p. [DOI] [PubMed] [Google Scholar]
- Curtis TA, Ashrafi SH, Weber D. Canalicular communication in the cortices of human long bones. Anatomical Record. 1985;212:336–344. doi: 10.1002/ar.1092120403. [DOI] [PubMed] [Google Scholar]
- Dillaman RM, Roer RD, Gay DM. Fluid movement in bone: theoretical and empirical. Journal of Biomechanics. 1991;24:163–177. doi: 10.1016/0021-9290(91)90386-2. [DOI] [PubMed] [Google Scholar]
- Donahue SW, Jacobs CR, Donahue HJ. Flow-induced calcium oscillations in rat osteoblasts are age, loading frequency, and shear stress dependent. American Journal of Physiology—Cell Physiology. 2001;281(5):C1635–C1641. doi: 10.1152/ajpcell.2001.281.5.C1635. [DOI] [PubMed] [Google Scholar]
- Ficat PR, Arlet J. Ischemia and Necroses of Bone. Williams & Wilkins; Baltimore: 1980. [Google Scholar]
- Fritton SP, Rubin CT. In vivo measurement of bone deformations using strain gauges. In: Cowin SC, editor. Bone Mechanics Handbook. CRC Press; Boca Raton, FL: 2001. pp. 8-1–8-41. [Google Scholar]
- Fritton SP, McLeod KJ, Rubin CT. Quantifying the strain history of bone: spatial uniformity and self- similarity of low-magnitude strains. Journal of Biomechanics. 2000;33:317–325. doi: 10.1016/s0021-9290(99)00210-9. [DOI] [PubMed] [Google Scholar]
- Green NE, Griffin PP. Intra-osseous venous pressure in Legg-Perthes disease. Journal of Bone and Joint Surgery, American Volume. 1982;64:666–671. [PubMed] [Google Scholar]
- Grimm M, Williams J. Measurement of permeability in human calcaneal trabecular bone. Journal of Biomechanics. 1997;30:743–745. doi: 10.1016/s0021-9290(97)00016-x. [DOI] [PubMed] [Google Scholar]
- Hillsley MV, Frangos JA. Bone tissue engineering: the role of interstitial fluid flow. Biotechnology and Bioengineering. 1994;43:573–581. doi: 10.1002/bit.260430706. [DOI] [PubMed] [Google Scholar]
- Hung CT, Pollack SR, Reilly TM, Brighton CT. Realtime calcium response of cultured bone cells to fluid flow. Clinical Orthopaedics. 1995;313:256–269. [PubMed] [Google Scholar]
- Jacobs CR, Yellowley CE, Davis BR, Zhou Z, Cimbala JM, Donahue HJ. Differential effect of steady versus oscillating flow on bone cells. Journal of Biomechanics. 1998;31:969–976. doi: 10.1016/s0021-9290(98)00114-6. [DOI] [PMC free article] [PubMed] [Google Scholar]
- Jiang GL, White CR, Stevens HY, Frangos JA. Temporal gradients in shear stimulate osteoblastic proliferation via ERK1/2 and retinoblastoma protein. American Journal of Physiology—Endocrinology and Metabolism. 2002;283:E383–E389. doi: 10.1152/ajpendo.00547.2001. [DOI] [PubMed] [Google Scholar]
- Johnson DL, McAllister TN, Frangos JA. Fluid flow stimulates rapid and continuous release of nitric oxide in osteoblasts. American Journal of Physiology. 1996;271:E205–E208. doi: 10.1152/ajpendo.1996.271.1.E205. [DOI] [PubMed] [Google Scholar]
- Kasperk C, Bundschuh B, Sommer U, Schweizer B, Lieder A, van den Heuvel L, Soexeri-Ludwig S, Holl M, Nawroth P, Boercsoek I, Liegibel UM. Fluid shear of very low magnitude stimulates growth and improves anchorage of human osteoblastic cells in vitro. ASBMR 24th Annual Meeting; San Antonio, TX. September 20–24, 2002.2002. [Google Scholar]
- Keanini RG, Roer RD, Dillaman RM. A theoretical model of circulatory interstitial fluid flow and species transport within porous cortical bone. Journal of Biomechanics. 1995;28:901–914. doi: 10.1016/0021-9290(94)00157-y. [DOI] [PubMed] [Google Scholar]
- Kelly PJ, Bronk JT. Venous pressure and bone formation. Microvascular Research. 1990;39:364–375. doi: 10.1016/0026-2862(90)90049-w. [DOI] [PubMed] [Google Scholar]
- Kelly PJ, Montgomery RJ, Bronk JT. Reaction of the circulatory system to injury and regeneration. Clinical Orthopaedics. 1990;254:275–288. [PubMed] [Google Scholar]
- Kiaer T. Bone perfusion and oxygenation. Animal experiments and clinical observations. Acta Orthopaedica Scandinavica, Supplemenum. 1994;257:1–41. [PubMed] [Google Scholar]
- Klein-Nulend J, Semeins CM, Ajubi NE, Nijweide PJ, Burger EH. Pulsating fluid flow increases nitric oxide (NO) synthesis by osteocytes but not periosteal fibroblasts—correlation with prostaglandin upregulation. Biochemical and Biophysical Research Communications. 1995;217:640–648. doi: 10.1006/bbrc.1995.2822. [DOI] [PubMed] [Google Scholar]
- Lawson PT. Assistant Laboratory Animal Technician Training Manual. American Association for Laboratory Animal Science; Memphis: 2000. [Google Scholar]
- Li GP, Bronk JT, An KN, Kelly PJ. Permeability of cortical bone of canine tibiae. Microvascular Research. 1987;34:302–310. doi: 10.1016/0026-2862(87)90063-x. [DOI] [PubMed] [Google Scholar]
- Lilly AD, Kelly PJ. Effects of venous ligation on bone remodeling in the canine tibia. Journal of Bone and Joint Surgery, American Volume. 1970;52:515–520. [PubMed] [Google Scholar]
- Liu SL, Ho TC. The role of venous hypertension in the pathogenesis of Legg-Perthes disease. A clinical and experimental study. Journal of Bone and Joint Surgery, American Volume. 1991;73:194–200. [PubMed] [Google Scholar]
- McAllister TN, Frangos JA. Steady and transient fluid shear stress simulate NO release in osteoblasts through distinct biochemical pathways. Journal of Bone and Mineral Research. 1999;14:930–936. doi: 10.1359/jbmr.1999.14.6.930. [DOI] [PubMed] [Google Scholar]
- Mukherjee N, Saris DB, Schultz FM, Berglund LJ, An KN, O'Driscoll S. The enhancement of periosteal chondrogenesis in organ culture by dynamic fluid pressure. Journal of Orthopaedic Research. 2001;19:524–530. doi: 10.1016/S0736-0266(00)00045-0. [DOI] [PubMed] [Google Scholar]
- Owan I, Burr DB, Turner CH, Qiu J, Tu Y, Onyia JE, Duncan RL. Mechanotransduction in bone: osteoblasts are more responsive to fluid forces than mechanical strain. American Journal of Physiology. 1997;273:C810–C815. doi: 10.1152/ajpcell.1997.273.3.C810. [DOI] [PubMed] [Google Scholar]
- Pavalko FM, Chen NX, Turner CH, Burr DB, Atkinson S, Hsieh YF, Qiu J, Duncan RL. Fluid shear-induced mechanical signaling in MC3T3-E1 osteoblasts requires cytoskeleton–integrin interactions. American Journal of Physiology. 1998;275:C1591–C1601. [PubMed] [Google Scholar]
- Qin YX, Kaplan T, Saldanha A, Rubin C. Fluid pressure gradients, arising from oscillations in intramedullary pressure, are correlated with the formation of bone and inhibition of intracortical porosity. Journal of Biomechanics. 2003 doi: 10.1016/S0021-9290(03)00127-1. this issue. [DOI] [PubMed] [Google Scholar]
- Raab-Cullen DM, Thiede MA, Petersen DN, Kimmel DB, Recker RR. Mechanical loading stimulates rapid changes in periosteal gene expression. Calcified Tissue International. 1994;55:473–478. doi: 10.1007/BF00298562. [DOI] [PubMed] [Google Scholar]
- Reich KM, Gay CV, Frangos JA. Fluid shear stress as a mediator of osteoblast cyclic adenosine monophosphate production. Journal of Cellular Physiology. 1990;143:100–104. doi: 10.1002/jcp.1041430113. [DOI] [PubMed] [Google Scholar]
- Rouhana S, Johnson M, Chakkalakal D, Harper R. Permeability of compact bone. Joint ASME-ASCE Conference; Boulder, CO. 1981. pp. 169–172. [Google Scholar]
- Rubin C, Turner AS, Bain S, Mallinckrodt C, McLeod K. Anabolism. Low mechanical signals strengthen long bones. Nature. 2001;412:603–604. doi: 10.1038/35088122. [DOI] [PubMed] [Google Scholar]
- Sakai K, Mohtai M, Iwamoto Y. Fluid shear stress increases transforming growth factor beta 1 expression in human osteoblast-like cells: modulation by cation channel blockades. Calcified Tissue International. 1998;63:515–520. doi: 10.1007/s002239900567. [DOI] [PubMed] [Google Scholar]
- Saris DB, Sanyal A, An KN, Fitzsimmons JS, O'Driscoll SW. Periosteum responds to dynamic fluid pressure by proliferating in vitro. Journal of Orthopaedic Research. 1999;17:668–677. doi: 10.1002/jor.1100170508. [DOI] [PubMed] [Google Scholar]
- Shim SS, Hawk HE, Yu WY. The relationship between blood flow and marrow cavity pressure of bone. Surgery, Gynecology and Obstetrics. 1972;135:353–360. [PubMed] [Google Scholar]
- Smalt R, Mitchell FT, Howard RL, Chambers TJ. Induction of NO and prostaglandin E2 in osteoblasts by wall-shear stress but not mechanical strain. American Journal of Physiology. 1997;273:E751–E758. doi: 10.1152/ajpendo.1997.273.4.E751. [DOI] [PubMed] [Google Scholar]
- Stein AHJ, Morgan HC, Reynolds FC. Variations in normal bone-marrow pressures. Journal of Bone and Joint Surgery. 1957;39-A:1129–1134. [PubMed] [Google Scholar]
- Tondevold E. Haemodynamics of long bones. An experimental study on dogs. Acta Orthopaedica Scandinavica Supplementum. 1983;205:9–48. [PubMed] [Google Scholar]
- Torrance AG, Mosley JR, Suswillo RF, Lanyon LE. Noninvasive loading of the rat ulna in vivo induces a strain-related modeling response uncomplicated by trauma or periostal pressure. Calcified Tissue International. 1994;54:241–247. doi: 10.1007/BF00301686. [DOI] [PubMed] [Google Scholar]
- Torzilli PA, Takebe K, Burstein AH, Zika JM, Heiple KG. The material properties of immature bone. Journal of Biomechanical Engineering. 1982;104:12–20. doi: 10.1115/1.3138297. [DOI] [PubMed] [Google Scholar]
- Trueta J. The role of the vessels in osteogenesis. Journal of Bone and Joint Surgery. 1963;45B:402–418. [Google Scholar]
- Wadhwa S, Godwin SL, Peterson DR, Epstein MA, Raisz LG, Pilbeam CC. Fluid flow induction of cyclo-oxygenase 2 gene expression in osteoblasts is dependent on an extracellular signal-regulated kinase signaling pathway. Journal of Bone and Mineral Research. 2002;17:266–274. doi: 10.1359/jbmr.2002.17.2.266. [DOI] [PubMed] [Google Scholar]
- Wang L, Fritton SP, Cowin SC, Weinbaum S. Fluid pressure relaxation depends upon osteonal microstructure: modeling an oscillatory bending experiment. Journal of Biomechanics. 1999;32:663–672. doi: 10.1016/s0021-9290(99)00059-7. [DOI] [PubMed] [Google Scholar]
- Wang L, Cowin SC, Weinbaum S, Fritton SP. Modeling tracer transport in an osteon under cyclic loading. Annals of Biomedical Engineering. 2000;28:1200–1209. doi: 10.1114/1.1317531. [DOI] [PubMed] [Google Scholar]
- Weinbaum S, Cowin SC, Zeng Y. A model for the excitation of osteocytes by mechanical loading-induced bone fluid shear stresses. Journal of Biomechanics. 1994;27:339–360. doi: 10.1016/0021-9290(94)90010-8. [DOI] [PubMed] [Google Scholar]
- Welch RD, Johnston CE, 2nd, Waldron MJ, Poteet B. Bone changes associated with intraosseous hypertension in the caprine tibia. Journal of Bone and Joint Surgery, American Volume. 1993;75:53–60. doi: 10.2106/00004623-199301000-00008. [DOI] [PubMed] [Google Scholar]
- Wilkes CH, Visscher MB. Some physiological aspects of bone marrow pressure. Journal of Bone and Joint Surgery, American Volume. 1975;57:49–57. [PubMed] [Google Scholar]
- Williams JL, Iannotti JP, Ham A, Bleuit J, Chen JH. Effects of fluid shear stress on bone cells. Biorheology. 1994;31:163–170. doi: 10.3233/bir-1994-31204. [DOI] [PubMed] [Google Scholar]
- You L. PhD Thesis. City University of New York; New York: 2002. A new view of mechanotransduction in bone cells. [Google Scholar]
- You L, Cowin SC, Schaffler MB, Weinbaum S. A model for strain amplification in the actin cytoskeleton of osteocytes due to fluid drag on pericellular matrix. Journal of Biomechanics. 2001a;34:1375–1386. doi: 10.1016/s0021-9290(01)00107-5. [DOI] [PubMed] [Google Scholar]
- You J, Reilly GC, Zhen X, Yellowley CE, Chen Q, Donahue HJ, Jacobs CR. Osteopontin gene regulation by oscillatory fluid flow via intracellular calcium mobilization and activation of mitogen-activated protein kinase in MC3T3-E1 osteoblasts. Journal of Biological Chemistry. 2001b;276:13365–13371. doi: 10.1074/jbc.M009846200. [DOI] [PubMed] [Google Scholar]
- Zachos TA, Aiken SW, DiResta GR, Healey JH. Interstitial fluid pressure and blood flow in canine osteosarcoma and other tumors. Clinical Orthopaedics. 2001;385:230–236. doi: 10.1097/00003086-200104000-00034. [DOI] [PubMed] [Google Scholar]
- Zaman G, Dallas SL, Lanyon LE. Cultured embryonic bone shafts show osteogenic responses to mechanical loading. Calcified Tissue International. 1992;51:132–136. doi: 10.1007/BF00298501. [DOI] [PubMed] [Google Scholar]
- Zeng Y, Cowin SC, Weinbaum S. A fiber matrix model for fluid flow and streaming potentials in the canaliculi of an osteon. Annals of Biomedical Engineering. 1994;22:280–292. doi: 10.1007/BF02368235. [DOI] [PubMed] [Google Scholar]
- Zhang D, Weinbaum S, Cowin SC. Estimates of the peak pressures in bone pore water. Journal of Biomechanical Engineering. 1998;120:697–703. doi: 10.1115/1.2834881. [DOI] [PubMed] [Google Scholar]