

Abstract
Overexpression of special AT-rich sequence binding protein 1 (SATB1), a global genome organizer, as a predictor of poor prognosis in cutaneous malignant melanoma (CMM) attracted great interest in previous research. In this article, upregulated SATB1 was observed in three melanoma cell lines and in eight CMM tissues. After downregulating SATB1 by RNAi, proliferation of A375 was suppressed in vitro and in vivo. In summary, the proliferation of CMM could be related closely to the SATB1 gene. Interference of this gene may be a promising method for CMM therapy.
Key words: : cutaneous, melanoma, proliferation, SATB1
Introduction
Cutaneous malignant melanoma (CMM), a deadly skin malignancy, presented a rapidly increasing incidence rate recently.1 Prognosis for patients with localized melanoma and with no nodal or distant metastases is generally good, but for patients with metastasis is usually unfavorable.2 Among the prognostic factors, vertical growth (named Breslow thickness), which represents the proliferation capacity of the tumor, is very significant. Increasing thickness means ascending rate of recurrence and metastasis.3–5
Special AT-rich sequence binding protein 1 (SATB1) is a nuclear matrix attachment DNA-binding protein, which is predominantly expressed in thymocytes and central nervous system.6,7 SATB1, generally acknowledged as a genome organizer, tethers multiple genomic loci and recruits chromatin-remodeling enzymes to regulate the chromatin structure and gene expression.8 Aberrant expression of SATB1 has been shown to play an important role in the initiation and progression of breast cancer,9,10 lymphoma,11 gastric cancer,12 and various other cancers.
Recently, it is reported that SATB1 was positive in CMM by immunohistochemistry, and its density was significantly correlated with Breslow thickness and other prognostic factors,13 which suggests that aberrant expression of the SATB1 gene might be involved in the proliferation of CMM. However, there are no other in vivo or in vitro tests to testify the result further.
In this study, we observed that the expression level of SATB1 was upregulated in CMM tissues and in melanoma cell lines by semiquantitative reverse transcriptase–polymerase chain reaction (semi-qRT-PCR). To investigate the role of SATB1 in melanoma genesis, this research was designed to study whether inhibition of SATB1 has an effect on the cell proliferation of A375 in vitro and in vivo.
Materials and Methods
Clinical samples
The samples were surgically obtained from 8 patients with primary invasive CMM, 6 patients with compound nevi and 2 patients with redundant prepuce, who were diagnosed and treated at the Institute of Dermatology, Chinese Academy of Medical Sciences between September 2009 and September 2010. Except patients with redundant prepuce, all the CMM patients were diagnosed pathologically before definitive surgery, and no chemotherapy or radiation were used. In these eight CMM samples, seven were acral melanomas and one was located in the skin of the thigh. Lymph node metastases were detected in 2 patients. Clark classification revealed that most of them were level 3 or level 4. Six samples of compound nevi, confirmed nonmalignant by two dermatopathologists, were used as controls. All these CMM and compound nevi samples were stored in −70°C. Additionally, two samples of prepuce skin, obtained by circumcision, were collected to separate melanocytes. This study was approved by the Chinese Academy of Medical Sciences Ethics Committee and informed consent was obtained from all subjects.
Cell lines, cell isolation, and culture conditions
Human melanoma cell lines A375, M14, and MV3 were obtained from American type culture collection. Cell lines A375, M14 and MV3 were cultured in the RPMI-1640 medium (Invitrogen) with 10% fetal bovine serum (Invitrogen) at 37°C with 5% CO2. The normal melanocytes were separated from the two samples of healthy donors with redundant prepuce (being named as MC1 and MC2, respectively), and cultured with the M254 medium (Invitrogen) containing human melanocyte growth supplements. The culture condition was the same as that of the melanoma cell lines.
Semiquantitative reverse transcriptase–polymerase chain reaction
Total RNA was extracted, respectively, from melanoma cell lines (A375, M14, MV3) and normal melanocytes (MC1 and MC2) using the TRIzol reagent (Invitrogen). The purity and concentration of RNA were confirmed by the radio of optical density (OD) at 260 and 280 nm. For semi-qRT-PCR, a quantity of 1 μg of total RNA was reverse transcribed using the Reverse Transcription System (Promega), according to the manufacturer's instructions. The specific primers for each gene were synthesized by Invitrogen and the sequences were as follows: SATB1-Forward: 5′-GCTGAAGAAGGCAATTGAAGATG-3′, SATB1-Reverse: 5′-CATTTTCTGGCTCCAGGGATG-3′; β-actin-Forward: 5′-GAAGGATTCCTATGTGGGCGAC-3′, β-actin-Reverse: 5′-AGCCTGGATAGCAACGTACATGG-3′. β-actin served as an internal control. Reaction system: 10 μL 5× Green GoTaq® Flexi Buffer, 4 μL MgCl2(25 mM), 1 μL dNTP Mix (10 mM each), 0.25 μL GoTaq DNA Polymerase (5 U/μL) (Promega), 20 pmol forward and reverse primers, and 2 μL DNA template were brought up to 50 μL with purified water. Reaction conditions: 95°C for 2 minutes, 94°C for 30 seconds, 56°C for 30 seconds, 72°C for 40 seconds followed by 30 cycles, and 72°C for 10 minutes. Semi-qRT-PCR was independently performed 3 times for all cell lines.
RT-PCR products (5 μL of each DNA) were separated by 2% agarose (Ultra-pure Bio-Rad) gel electrophoresis, stained with ethidium bromide (1 mg/L), and density was estimated by QuantiOne software (BioRad). The expression level of SATB1 mRNA was calculated as follows: 10× (the density of SATB1/the density of β-actin).
Western blotting assay
After washed twice with PBS, total proteins were extracted from melanoma cell lines and normal melanocytes, eight samples of CMM and six samples of compound nevi with a lysis buffer (50 mM pH 8.0 Tris-HCl, 150 mM NaCl, 0.02% NaN3, 0.1% SDS, 1% nonidet P-40, 0.5% sodium deoxycholate, 100 mg/mL of phenylmethylsulfonyl fluoride, 1 mg/mL of aprotinin, 1 mg/mL of leupeptin, 1 mg/mL of pepstatin A). The concentration of protein was determined by a spectrophotometer. Seventy micrograms of protein separated by 10% SDS-polyacrylamide gel electrophoresis (Bio-Rad), and subsequently transferred onto polyvinylidene difluoride (PVDF) membrane by electroblotting. PVDF membrane was then stained with a polyclonal anti-rabbit SATB1 antibody, and the β-actin antibody worked as internal control. Peroxidase-conjugated anti-rabbit IgG was used as a secondary antibody and visualized by the enhanced chemiluminescence method. The relative quantity of protein was quantified with Glyco Band-Scan software 4.5 (Prozyme).
siRNA transfection
The human melanoma cell line A375 was used for these experiments. As previously reported,9 one short hairpin RNA (shRNAs), which was designed against the SATB1 mRNA sequence (GenBank accession number NM_002971), was subcloned into the pRNAT-U6.2/Lenti siRNA expression vector (Genscript). After the recombinant plasmid identified by PCR and sequencing, transfection was performed using Fugene HD (Roche) in the Opti-DMEM without antibiotics (Invitrogen). Optimizing the transfection factors according to the manufacturer's protocol, 2 μg of DNA was mixed with 5 μL of Fugen HD in a six-well plate with 2 mL of culture medium. The cultures were incubated overnight, the plasmid-containing medium was removed, and a fresh medium was added to the cultures. Forty-eight hours later, cells containing integrated recombinant plasmid were selected in a medium with 1000 μg/mL G418 (Invitrogen) for 2 weeks. Negative control A375 was transfected with a nonrecombinant plasmid pRNAT-U6.2/Lenti. Cells stably expressing shRNA-SATB1 were designated A375/pRNAT-SATB1, and cells expressing nonrecombinant plasmid pRNAT-U6.2/Lenti were designated A375/pRNAT. The clones, expressing the bright green fluorescent under a fluorescent microscope, were picked out for further study.
Cell proliferation analysis
Cell proliferation was evaluated by the Cell Counting Kit-CCK8 assay (Dojindo). A375/pRNAT-SATB1, A375/pRNAT, and A375/parental were seeded in a 96-well plate with the concentration of 4×10³/mL. After incubation for 24, 48, and 72 hours, the cells were treated with a fresh medium containing 10% volume of CCK-8 and then incubated at 37°C for 4 hours. The OD values at 450 nm were quantified by a spectrophotometer (Bio-Rad). Assays were performed in three replicated wells and each experiment was repeated three times independently.
Subcutaneous tumor formation in nude mice
We randomly assigned female nude mice (3–4 weeks of age) to three groups as follows: group A375/pRNAT-SATB1; group A375/pRNAT; group A375/parental. Tumor cells were injected subcutaneously into the nude mice in the right axilla with 2×10⁶ cells. The animals were then monitored for tumor formation and growth. When the subcutaneous tumor xenografts were palpable, the shortest and longest diameters of the tumors were measured with calipers every other day, and the tumor volume (mm3) was calculated as follows: 0.5×length×width2. Twenty-four days after injection, tumors were dissected and the wet weight of each tumor was determined. The animal care and usage protocol was carried out with approval from our Institution's Animal Care and Ethics Committee.
Statistical analysis
Data are expressed as the mean±standard deviation (M±SD). Statistical analysis was performed with Stata 8.2 statistic software package (Stata Corp.). Differences of parametric variables between groups were tested by the Student's t-test. A P-value of <0.05 was considered statistically significant.
Results
SATB1 was upregulated in cell lines
The expression of SATB1 in A375, M14, and MV3 was compared with that in normal melanocytes. As shown in Figure 1, SATB1 was overexpressed in the three melanoma cell lines (A375, M14, and MV3), especially in A375, but was nearly negative in normal melanocytes analyzed by semi-qRT-PCR analysis.
FIG. 1.

SATB1 in cell lines was analyzed by semiquantitative reverse transcriptase–polymerase chain reaction analysis, and the β-actin level worked as loading controls. (A) The relative density of SATB1 at 627 bp: 0.14 for MC1, 0.22 for MC2, 3.88 for MV3, 2.02 for M14, and 6.68 for A375. (B) The column diagram of relative density of SATB1 in cells. SATB1, special AT-rich sequence binding protein 1.
By western blotting assay, the expression of the SATB1 protein in the three melanoma cell lines was strongly positive, while in normal melanocytes was negative. In A375, the density of the 106-kDa band was the highest (Fig. 2). We chose A375 for further studies.
FIG. 2.
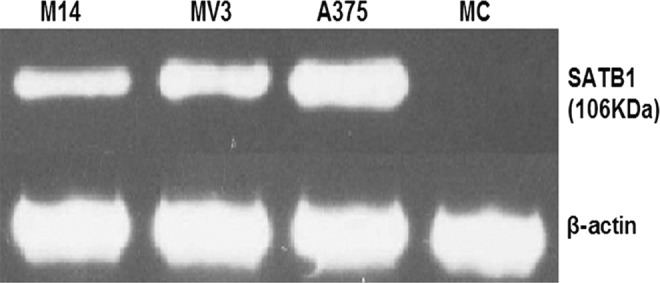
SATB1 in cell lines was analyzed by western blot. The relative density of SATB1 at 106 KDa: 0.03 for MC1, 0.85 for MV3, 0.87 for M14, and 0.91 for A375.
SATB1 was upregulated in melanoma tissues
By western blotting assay, the expression of SATB1 in eight melanoma tissues and in six cases of nevi was all investigated (Fig. 3). However, the band density in nevi (0.53±0.28) was significantly lower than that in melanoma tissues (1.10±0.32) (p=0.0048).
FIG. 3.
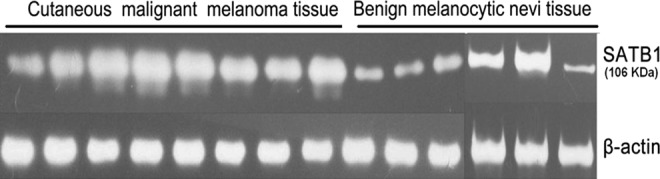
The relative quantity of SATB1 in eight melanomas and in six nevi. The t-test was performed and statistical difference was obvious.
SATB1 gene silencing suppressed the viability of A375 in vitro
To investigate whether SATB1 was involved in the proliferation of melanoma, a specific shRNA against the SATB1 mRNA sequence was stably transfected into the melanoma cell line A375 in which the expression of SATB1 was the highest. As a control, the empty vector pRNAT-U6.2/Lenti was stably transfected into A375 cells. The interference effect against SATB1 was observed by western blot. As shown in Figure 4, after inhibiting the expression of SATB1 effectively, the SATB1 level in A375/pRNAT-SATB1 significantly declined compared with A375/pRNAT and A375/parental.
FIG. 4.
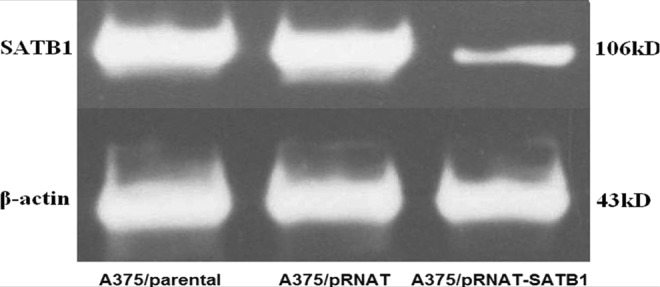
Decrease of SATB1 after the transfection of short hairpin RNA-SATB1 in the A375 cell line. The relative quantification of SATB1.
We then examined the effect of SATB1 interference on cell viability with cell counting assay. As shown in Table 1, the growth rate of A375/pRNAT-SATB1 cells was lower when compared with that of A375/pRNAT cells and A375/parental cells at 24, 48, and 72 hours. The significant difference started to be obvious from 24 hours (p=0.002) and increased in the following 2 days (p<0.001). Transfection of shRNA-SATB1 could inhibit cell viability in vitro.
Table 1.
The Optical Density Value of the Transfected and Nontransfected A375 After Culture for 24, 48, and 72 Hours
| Groups | 24 hours | 48 hours | 72 hours |
|---|---|---|---|
| A375/parental | 0.35±0.06 | 1.74±0.11 | 2.31±0.03 |
| A375/pRNAT | 0.37±0.014 | 1.66±0.24 | 2.30±0.06 |
| A375/pRNAT-SATB1 | 0.24±0.06a | 0.85±0.13a | 1.37±0.07a |
Statistical differences were analyzed with t-test. The values are shown as mean±SD, n=9.
p<0.05 relative to A375/parental group and A375/pRNAT group.
SATB1, special AT-rich sequence binding protein 1.
SATB1 gene silencing suppressed tumorigenesis of melanoma cells in vivo
Besides the in vitro activity, we also examined the effect of SATB1 on tumorigenesis in vivo. Consistent with the results in vitro, tumors of the A375/pRNAT-SATB1 group formed palpable tumors in 8.17±2.86 days (Fig. 5A), which were longer compared with A375/pRNAT and A375/parental (5.33±0.82 and 4.83±1.17 days, respectively) (p=0.0245 and p=0.0417, respectively). The volume of tumor xenografts were measured at regular intervals. The results showed that the growth speed of subcutaneous tumors in the group of A375/pRNAT-SATB1 was slower than that in the groups of A375/pRNAT and A375/parental (Fig. 5B). In addition, the weight of tumors of the A375/pRNAT-SATB1 group (0.65±0.36 g) was smaller compared with A375/pRNAT and A375/parental (1.52±0.74 g and 1.44±0.75 g, respectively) (p=0.0279 and p=0.0416, respectively) (Fig. 5C, D). Interference of SATB1 had significantly negative effects on the proliferation of A375.
FIG. 5.

The growth speed of the tumor xenografts. (A) The formation times of the tumor xenografts. (B) Growth curves were determined by the tumor volume measured at regular intervals. (C) The size of tumor xenografts when executed in the nude mice. (D) The weight of tumor xenografts when executed in the nude mice (error bars=standard deviation, n=6, *p<0.05 relative to the two control groups).
Discussion
SATB1 is a tissue-specific nuclear matrix attachment DNA-binding protein, which is located on chromosome 3p23. With a functional nuclear architecture, which is a cage-like protein distribution surrounding heterochromatin, SATB1 selectively tethers specialized DNA sequences onto its network,14 recruits chromatin remodeling/modifying enzymes to genomic DNA, modulates the spatial conformation of chromatin, and hence acts as a genome organizer and gene regulator.15 Overexpression of SATB1 could regulate the expression of more than 1000 genes and these genes are involved activities such as apoptosis, cell–cell adhesion, carbohydrate metabolism, cell differentiation, proliferation, DNA recombination and repair, immune response, kinase activity, oxidoreductase activity, and signal transduction.9,16,17 The investigations of SATB1 were carried out mainly in immune cells in the past. In SATB1 null mice, the expression of lots of genes was inhibited at inappropriate stages of T-cell development, which resulted in blocked thymocyte development.17 By specifically binding to a cis-regulatory element within the CD8 enhancer, SATB1 acted as an essential regulator of CD8 lineage fate.18,19 Early in apoptotic T cells, removal of SATB1 was needed for nuclear degradation.20 Additionally, SATB1 could upregulate the epsilon-globin gene and regulate globin gene expression during early erythroid differentiation,21 enable gene silencing by Xist in lymphoma and embryonic cells,11 and promote trophoblast stem cell renewal and inhibit differentiation.22
Recently, as shown in reference 9, SATB1 was necessary for breast cancer cells to become metastatic and was closely related to prognosis. Removal of SATB1 from aggressive breast cancer cells not only reversed metastatic phenotypes, but also inhibited tumor growth. When ectopically expressed, SATB1 in nonmetastatic cells can induce invasive activity in vivo. Once SATB1 expression was knockdown, the expression of over 1000 genes altered in highly aggressive breast cancer cells MDA-MB-231, indicating its key role in cancer progression.9 SATB1 expression was upregulated in multidrug-resistant breast cancer cells, which exhibited higher invasive potential than the parental cells, and SATB1 depletion could partially reverse the multidrug-resistant phenotype.12 More interestingly, a decoy DNA against SATB1 inhibited the proliferation of MDA-MB-231 cells, and drastically reduced the invasive and metastatic capacity of MBA-MB-231 cells, which suggested that SATB1 decoy DNA may be an effective candidate for treatment of poor prognosis breast cancer.23
Overexpression of SATB1 was found correlating with not only CMM,12 but many other tumors, such as gastric cancer and breast cancer.9–11,24 However, SATB1 was not always upregulated in tumors. Significant loss of SATB1 expression was found in squamous preinvasive lesions and in nonsmall cell lung cancers and the loss of SATB1 independently predicted poor cancer-specific survival in squamous cell carcinomas.25 In Sézary syndrome, deficiency of SATB1 expression in Sézary cells played an important role in the pathogenesis through causing apoptosis resistance.26 This reveals that the role of SATB1 in the tumor is complicated.
In our study, SATB1 mRNA was overexpressed in the three melanoma cell lines, but was nearly negative in normal melanocytes, which was confirmed further by western blotting assay. SATB1 was upregulated in all the eight CMM tissues compared with six benign melanocytic nevi. However, SATB1 was positive in all samples from the six benign melanocytic nevi tissues also.
We next investigated whether SATB1 was required for the proliferation of CMM cells. By stably transfecting a specific shRNA against the SATB1 mRNA sequence into the melanoma cell line A375, which overexpressed SATB1, the expression of SATB1 was remarkably reduced at mRNA and protein levels (23.21% and 34.57% of the parental cells, respectively). In vitro, the cell number of the A375/pRNAT-SATB1 group was obviously less compared with control groups in the period of observation. In vivo, the A375/pRNAT-SATB1 group formed palpable tumors in 8.17±2.86 days, longer than the other two groups. The tumor volume was smaller too. Above all, when the overexpression of SATB1 was depressed, the proliferation of melanoma was inhibited both in vitro and in vivo.
In summary, this study showed that SATB1, which upregulated in CMM tissues and melanoma cell lines, may be involved in the malignant biologic behavior of melanomas. Also, the proliferation of CMM can be partially inhibited by SATB1 interference.
Acknowledgments
This study is supported by the Doctoral Fund of Ministry of Education of China (Grant No. 20091106120001) and the National Natural Science Foundation of China (Grant No. 30672474).
Disclosure Statement
There are no existing financial conflicts.
References
- 1.Tuong W, Cheng LS, Armstrong AW. Melanoma: Epidemiology, diagnosis, treatment, and outcomes. Dermatol Clin 2012;30:113. [DOI] [PubMed] [Google Scholar]
- 2.Bhatia S, Tykodi SS, Thompson JA. Treatment of metastatic melanoma: An overview. Oncology (Williston Park) 2009;23:488. [PMC free article] [PubMed] [Google Scholar]
- 3.Breslow A. Thickness, cross-sectional areas and depth of invasion in the prognosis of cutaneous melanoma. Ann Surg 1970;172:902. [DOI] [PMC free article] [PubMed] [Google Scholar]
- 4.Breslow A. Tumor thickness, level of invasion and node dissection in stage I cutaneous melanoma. Ann Surg 1975;182:572. [DOI] [PMC free article] [PubMed] [Google Scholar]
- 5.Messeguer F, Agustí-Mejías A, Traves V, et al. Mitotic rate and subcutaneous involvement are prognostic factors for survival after recurrence in patients with only locoregional skin metastasis as the first site of recurrence from cutaneous melanoma. J Eur Acad Dermatol Venereol 2013;27:436. [DOI] [PubMed] [Google Scholar]
- 6.Wang B, Dickinson LA, Koivunen E, et al. A novel matrix attachment region DNA binding motif identified using a random phage peptide library. J Biol Chem 1995;270:23239. [DOI] [PubMed] [Google Scholar]
- 7.Huang Y, Zhang L, Song NN, et al. Distribution of Satb1 in the central nervous system of adult mice. Neurosci Res 2011;71:12. [DOI] [PubMed] [Google Scholar]
- 8.Richon VM. A new path to the cancer epigenome. Nat Biotechnol 2008;26:655. [DOI] [PubMed] [Google Scholar]
- 9.Han HJ, Russo J, Kohwi Y, et al. SATB1 reprogrammes gene expression to promote breast tumour growth and metastasis. Nature 2008;452:187. [DOI] [PubMed] [Google Scholar]
- 10.Patani N, Jiang W, Mansel R, et al. The mRNA expression of SATB1 and SATB2 in human breast cancer. Cancer Cell Int 2009;9:18. [DOI] [PMC free article] [PubMed] [Google Scholar]
- 11.Agrelo R, Souabni A, Novatchkova M, et al. SATB1 defines the developmental context for gene silencing by Xist in lymphoma and embryonic cells. Dev Cell 2009;16:507. [DOI] [PMC free article] [PubMed] [Google Scholar]
- 12.Li QQ, Chen ZQ, Xu JD, et al. Overexpression and involvement of special AT-rich sequence binding protein 1 in multidrug resistance in human breast carcinoma cells. Cancer Sci 2010;101:80. [DOI] [PMC free article] [PubMed] [Google Scholar]
- 13.Chen H, Takahara M, Oba J, et al. Clinicopathologic and prognostic significance of SATB1 in cutaneous malignant melanoma. J Dermatol Sci 2011;64:39. [DOI] [PubMed] [Google Scholar]
- 14.Cai S, Han HJ, Kohwi-Shigematsu T. Tissue-specific nuclear architecture and gene expression regulated by SATB1. Nat Genet 2003;34:42. [DOI] [PubMed] [Google Scholar]
- 15.Yasui D, Miyano M, Cai S, et al. SATB1 targets chromatin remodelling to regulate genes over long distances. Nature 2002;419:641. [DOI] [PubMed] [Google Scholar]
- 16.Galande S, Purbey PK, Notani D, et al. The third dimension of gene regulation: Organization of dynamic chromatin loopscape by SATB1. Curr Opin Genet Dev 2007;17:408. [DOI] [PubMed] [Google Scholar]
- 17.Alvarez JD, Yasui DH, Niida H, et al. The MAR-binding protein SATB1 orchestrates temporal and spatial expression of multiple genes during T-cell development. Genes Dev 2000;14:521. [PMC free article] [PubMed] [Google Scholar]
- 18.Nie H, Yao X, Maika SD, et al. SATB1 is required for CD8 coreceptor reversal. Mol Immunol 2008;46:207. [DOI] [PMC free article] [PubMed] [Google Scholar]
- 19.Cai S, Lee CC, Kohwi-Shigematsu T. SATB1 packages densely looped, transcriptionally active chromatin for coordinated expression of cytokine genes. Nat Genet 2006;38:1278. [DOI] [PubMed] [Google Scholar]
- 20.Galande S, Dickinson LA, Mian IS, et al. SATB1 cleavage by caspase 6 disrupts PDZ domain-mediated dimerization, causing detachment from chromatin early in T-cell apoptosis. Mol C ell Biol 2001;21:5591. [DOI] [PMC free article] [PubMed] [Google Scholar]
- 21.Wen J, Huang S, Rogers H, et al. SATB1 family protein expressed during early erythroid differentiation modifies globin gene expression. Blood 2005;105:3330. [DOI] [PubMed] [Google Scholar]
- 22.Asanoma K, Kubota K, Chakraborty D, et al. SATB homeobox proteins regulate trophoblast stem cell renewal and differentiation. J Biol Chem 2012;287:2257. [DOI] [PMC free article] [PubMed] [Google Scholar]
- 23.Yamayoshi A, Yasuhara M, Galande S, et al. Decoy-DNA against special AT-rich sequence binding protein 1 inhibits the growth and invasive ability of human breast cancer. Oligonucleotides 2011;21:115. [DOI] [PubMed] [Google Scholar]
- 24.Lu X, Cheng C, Zhu S, et al. SATB1 is an independent prognostic marker for gastric cancer in a Chinese population. Oncol Rep 2010;24:981. [DOI] [PubMed] [Google Scholar]
- 25.Selinger CI, Cooper WA, Al-Sohaily S, et al. Loss of special AT-rich binding protein 1 expression is a marker of poor survival in lung cancer. J Thorac Oncol 2011;6:1179. [DOI] [PubMed] [Google Scholar]
- 26.Wang Y, Su M, Zhou LL, et al. Deficiency of SATB1 expression in Sezary cells causes apoptosis resistance by regulating FasL/CD95L transcription. Blood 2011;117:3826. [DOI] [PubMed] [Google Scholar]