Abstract
Computerized tomography is a standard method for obtaining internal structure of objects from their projection images. While CT reconstruction requires the knowledge of the imaging directions, there are some situations in which the imaging directions are unknown, for example, when imaging a moving object. It is therefore desirable to design a reconstruction method from projection images taken at unknown directions. Another difficulty arises from the fact that the projections are often contaminated by noise, practically limiting all current methods, including the recently proposed diffusion map approach. In this paper, we introduce two denoising steps that allow reconstructions at much lower signal-to-noise ratios (SNRs) when combined with the diffusion map framework. In the first denoising step we use principal component analysis (PCA) together with classical Wiener filtering to derive an asymptotically optimal linear filter. In the second step, we denoise the graph of similarities between the filtered projections using a network analysis measure such as the Jaccard index. Using this combination of PCA, Wiener filtering, graph denoising, and diffusion maps, we are able to reconstruct the two-dimensional (2-D) Shepp–Logan phantom from simulative noisy projections at SNRs well below their currently reported threshold values. We also report the results of a numerical experiment corresponding to an abdominal CT. Although the focus of this paper is the 2-D CT reconstruction problem, we believe that the combination of PCA, Wiener filtering, graph denoising, and diffusion maps is potentially useful in other signal processing and image analysis applications.
Keywords: computerized tomography, diffusion maps, graph denoising, principal component analysis, Wiener filtering, Jaccard index, small world graph, Shepp–Logan phantom
1. Introduction
Transmission computerized tomography (CT) currently is a standard method for obtaining internal structures nondestructively, which is routinely used in medical imaging [13, 24, 31, 32]. The classical two-dimensional (2-D) CT problem is the recovery of a function from its Radon transform. In the parallel beam model, the Radon transform of f is given by the line integral
where θ ∈ S1 is perpendicular to the beaming direction θ⊥ ∈ S1 (S1 is the unit circle), and . The reconstruction of f from its Radon transform Rθf is made possible due to the Fourier projection slice-theorem that relates the one-dimensional (1-D) Fourier transform of the Radon transform to the 2-D Fourier transform f̂ of the function [13, 24, 31, 32]:
| (1.1) |
In other words, the 1-D Fourier transform of each projection is the restriction of the 2-D Fourier transform to the central line in the θ direction. Thus, the collection of the discrete 1-D Fourier transforms of all projections corresponds to the Fourier transform of the function f sampled on a polar grid. Therefore, the function f can be recovered by a suitable 2-D Fourier inversion. This reconstruction requires the knowledge of the beaming direction θ of each and every projection Rθf.
There are cases, however, in which the beaming directions are unknown, for example, when imaging certain biological proteins or other moving objects. In such cases, one is given samples of the Radon transform Rθi(·) for a finite but unknown set of n directions , and the problem at hand is to estimate the underlying function f without knowing the directions. The sampling set for the parameter s is usually known and is dictated by the physical setting of the acquisition process; for example, if the detectors are equally spaced, then the values of s correspond to the location of the detectors along the line of detectors, while the origin may be set at the center of mass. An alternative method for estimating the shifts will be discussed in section 8.
In this paper we address the reconstruction problem for the 2-D parallel-beam model with unknown acquisition directions. Formally, we consider the following problem: Given n projection vectors (Rθif(s1), Rθif(s2), . . . , Rθif(sp)) taken at unknown directions that were randomly drawn from the uniform distribution over S1 and given that s1, s2, . . . , sp are fixed p equally spaced pixels in s, find the underlying density function f of the object. The observed n projection vectors are often contaminated by noise; in such cases, the problem is to find the beaming directions of the noisy projections.
This 2-D reconstruction problem from unknown directions was previously considered by Basu and Bresler in [2, 3]. In particular, in [3] they derive conditions for the existence of unique reconstruction from unknown directions and shifts. The recovery problem is formulated as a nonlinear system using the Helgason–Ludwig consistency conditions, which are used to derive uniqueness conditions. Stability conditions for the angle recovery problem under deterministic and stochastic perturbation models are derived in [2], where Cramér–Rao lower bounds on the variance of direction estimators for noisy projections are also given. An algorithm for estimating the directions is introduced in [2], and it consists of three steps: (1) initial direction estimation; (2) direction ordering; and (3) joint maximum likelihood refinement of the directions and shifts. Step (2) uses a simple symmetric nearest neighbor algorithm for projection ordering. Once the ordering is determined, the projection directions are estimated to be equally spaced on the unit circle, as follows from the properties of the order statistics of the uniform distribution. Thus, the problem boils down to sorting the projections with respect to their directions.
A different approach to sorting the projections with respect to their directions was employed in [12], where the ordering was obtained by a proper application of the diffusion map framework [11, 27]. Specifically, the method of [12] consists of constructing an n × n matrix whose entries are obtained from similarities between pairs of projections, followed by a computation of the first few eigenvectors of the similarity matrix. This method was demonstrated to be successful at relatively low SNRs, especially when the projections were first denoised using wavelet spin-cycling [10].
In this paper, we combine the diffusion map approach of [12] with two other denoising techniques that together allow reconstructions at much lower SNRs. The first denoising step consists of using principal component analysis (PCA) together with the classical Wiener filtering approach for minimizing the mean squared error. The advantage of the basis found by PCA over the wavelet basis that was used in [12] is in its adaptivity to the data. Empirically, we have observed that for many images, a few principal components capture most of the variability of their Radon transform, and projecting the 1-D projections onto this basis diminishes the noise while capturing most of the signal features. We derive an asymptotically optimal linear filter in the limit n, p → ∞ and with p/n = γ fixed by employing the Wiener filtering approach together with recent results concerning PCA in high dimensions (see, e.g., [22]). Our filter requires us to estimate the noise variance, the number of components, and their corresponding eigenvalues. To that end, we use the method of Kritchman and Nadler [25, 26].
We then compute the Euclidean distances between all pairs of filtered projections and use these distances to construct a matrix of their pairwise similarities. Our second denoising step consists of further denoising the similarity matrix using a network analysis measure such as the Jaccard index (see, e.g., [18], where the Jaccard index was used to denoise protein interaction maps). When two projections share a similar beaming direction, then it is expected not only that the similarity between the two of them would be significant, but also that their similarity to all other projections of nearby beaming directions would be large. Fixing a pair of projections, the Jaccard index is a way of measuring the number of projections that are similar to both of them. The similarity measure between projections is often sensitive to noise: when the SNR is too low, we may assign a large similarity to projection pairs of completely different beaming directions. We use the Jaccard index to identify such false matchings of projections, because we do not expect a pair of projections of different beaming directions to have many projections that are similar to both of them.
We performed numerical experiments for testing this combination of PCA, Wiener filtering, graph denoising, and diffusion maps, and were able to reconstruct the 2-D Shepp–Logan phantom from simulative noisy projections at SNRs well below their currently reported threshold values [12]. We also report the results of a numerical experiment corresponding to an abdominal CT. Although the focus of this paper is the 2-D CT reconstruction problem, we believe that such a combination of PCA, Wiener filtering, graph denoising, and diffusion maps has the potential to become a useful tool for other signal processing and image analysis applications. In particular, we expect the asymptotically optimal linear filter that we derive here (see (4.30)) to be useful in many other applications, regardless of the other steps of our proposed algorithm.
The paper is organized in the following way. In section 2 we discuss the underlying geometry of the Radon projections as a 1-D closed curve in a high-dimensional ambient space. In section 3 we give a brief introduction to the diffusion map method and review its application to the 2-D reconstruction problem as proposed in [12]. In section 4 we develop the PCA-Wiener filter for the optimal weighted projection. In section 5 we explain the usage of the Jaccard index for denoising the graph of similarities. In section 6 we summarize the algorithm for solving the 2-D reconstruction problem. The algorithm has only two free parameters, and we describe a method for choosing them automatically. In section 7 we detail the results of our numerical experiments. Finally, section 8 is a summary and discussion.
2. Underlying geometry
The following proposition is given as an exercise in Epstein's book on the mathematics of medical imaging [15, Exercise 6.6.1, p. 215].
Proposition 2.1
Suppose that and that f vanishes outside the unit disk. Then, Rθf is in for all θ, and tends to zero as θ2 approaches θ1. In other words, the map is a continuous map from S1 into .
Proof. See Appendix A.
From Proposition 2.1 it follows that the image of the Radon transform is a compact and connected continuous curve in parameterized by θ, whenever f is in and has compact support. Note that the function f is not required to be continuous. For example, the function f corresponding to the Shepp–Logan phantom is discontinuous, yet Proposition 2.1 guarantees that its Radon transform is a continuous function of θ, a fact that can also be verified by a direct calculation.
We note that it is possible for the closed curve to intersect with itself. We refer to closed curves without self-intersections as simple curves. For example, if f has some axis of symmetry, then the closed curve intersects with itself and is therefore nonsimple. Symmetry, however, is not the only case for which is nonsimple. There are other nonsymmetric functions that give rise to nonsimple curves. From the slice-theorem it follows that is self-intersecting iff there are θ1 = θ2 such that f̂(ξθ1) = f̂(ξθ2) for all (notice that for with compact support, f is also in , and as a result f̂ is continuous). In what follows we assume that has compact support and that its curve is simple.
The measurements are assumed to be discrete samples of the Radon transform of f. Every projection vector (Rθf(s1), Rθf(s2), . . . , Rθf(sp)) can be viewed as a point in . When varying the beaming direction θ⊥ over S1, the projection vectors sample a closed curve, denoted in . The discretization operator can be viewed as a projection operator from to its finite-dimensional subspace . The continuity of the projection operator and the fact that is a compact, continuous, closed curve in imply that is also a compact, continuous, closed curve in . In the limit of an infinitely large number of discretization points p → ∞, the projections sample a simple closed curve in . The collection of n projection vectors (Rθif(s1), . . . , Rθif(sp)) (i = 1, . . . , n) are therefore n sampling points of a closed curve in that approximates a simple closed curve in . In order to have a unique solution for the finite-dimensional problem, we need to assume that the closed curve is also simple. Note that noise contamination perturbs , and its effect is examined later.
3. Diffusion maps
Diffusion mapping is a nonlinear dimensionality reduction technique [11, 27], whose application to the reconstruction problem at hand was studied in [12]. As discussed above, although the sampled projections are points in a high-dimensional Euclidean space, they are restricted to a 1-D closed curve. This curve may have a complicated nonlinear structure that may not be captured by projecting it linearly onto a low-dimensional subspace. Unlike linear methods such as PCA, the diffusion map technique successfully finds the correct parametrization of the nonlinear curve. In this section, we give a brief description of the diffusion map technique and discuss some of its properties and limitations. Readers who are familiar with [12] are advised to proceed to the next section.
We now outline the steps of the diffusion map algorithm. Suppose is a collection of n data points to be embedded in a lower-dimensional space. The first step is to construct an n × n matrix W of similarities between the data points. The similarities are defined using the Euclidean distances between the data points and a kernel function scaled by a parameter ε > 0 in the following way:
| (3.1) |
Clearly, the matrix W is symmetric. The second step is to normalize W into a probability transition matrix A of a random walk on the data points by letting
where D is a diagonal matrix whose entries are given by
The matrix A is similar to the symmetric matrix D–1/2WD–1/2 through
Therefore, A has a complete set of eigenvectors ϕ0, ϕ1, . . . , ϕn–1 with corresponding eigenvalues 1 = λ0 ≥ λ1 ≥ · · · ≥ λn–1 ≥ –1, where ϕ0 = (1, 1 . . . , 1)T. The eigenvectors ϕ0, . . . , ϕn–1 are vectors in , and we denote their ith element by ϕ0(i), ϕ1(i), . . . , ϕn–1(i). Moreover, for positive definite kernel functions in the sense of Bochner (see, e.g., [35, pp. 329–332]), the matrix W is positive definite, and as a consequence all the eigenvalues of A are positive. For example, by Bochner's theorem, the Gaussian kernel K(u) = exp{–u2/2} is positive definite, because its Fourier transform is positive. In the last step, the data points are embedded in (m ≤ n – 1) via
| (3.2) |
where t > 0 is a parameter. The map is known as the diffusion map.
Whenever the data points are sampled from a d-dimensional Riemannian manifold, the discrete random walk over the data points converges to a continuous diffusion process over that manifold in the limit of n → ∞ and ε → 0, provided that nεd/2+1. This convergence can be stated in terms of the normalized graph Laplacian L, which is defined as
where I is the n × n identity matrix. In the case where the data points are independent samples from a probability density function p(x) whose support is a d-dimensional manifold , the graph Laplacian converges pointwise to the Fokker–Planck operator, as we have the following proposition [4, 20, 27, 36]: if is a smooth function (e.g., ), then with high probability
| (3.3) |
where ΔM is the Laplace–Beltrami operator on and the potential term U is given by U(x) = –2log p(x). In the special case of a uniform density (p and U are constants, and ∇U vanishes) the limiting operator is merely the Laplace–Beltrami operator. The error consists of two terms: a bias term O(ε) and a variance term that decreases as , but also depends on ε. Balancing the two terms can lead to an optimal choice of the parameter ε as a function of the number of points n. In the case of uniform sampling, Belkin and Niyogi [5] have proved spectral convergence, that is, they showed that the eigenvectors of the normalized graph Laplacian converge almost surely in the L2 sense to the eigenfunctions of the Laplace–Beltrami operator on the manifold, which is stronger than the pointwise convergence stated in (3.3). We refer the reader to Theorem 2.1 in [5] for the precise conditions and statement of their theorem.
It is possible to recover the Laplace–Beltrami operator also for nonuniform sampling processes using a different normalization of the similarity matrix [11]. Indeed, if one defines the matrix W̃ as W̃ = D–1WD–1, the matrix D̃ as a diagonal matrix with , and the matrix à as à = D̃–1W̃, then L̃ = I – à converges pointwise to the Laplace–Beltrami operator even if the sampling process is nonuniform. Belkin and Niyogi [5, last paragraph of section 1 and first paragraph of section 2] observed that the arguments in their paper are likely to allow one to show the spectral convergence of L̃ to the Laplace–Beltrami operator, although to the best of our knowledge no such proof currently exists in the literature. The proof of the spectral convergence in the nonuniform case is beyond the scope of this paper.
In our case, the data points are the projections which are restricted to the closed curve . Although the beaming directions are assumed to be uniformly distributed over S1, the projections are not necessarily uniformly distributed over , due to the nontrivial Jacobian of the transformation from S1 to (and to ) that takes θ to Rθf (and its discretization in ). Assuming that the spectral convergence result by Belkin and Niyogi also holds in the case of nonuniform sampling, the eigenvectors of L computed by the diffusion map will therefore be discrete approximations of the eigenfunctions of the Fokker–Planck operator over . If instead we apply the normalization that leads to the Laplace–Beltrami operator, then (again, assuming that the result of Belkin and Niyogi holds also for this particular normalization) the computed eigenvectors will be discrete approximations of the eigenfunctions of the Laplace–Beltrami operator over which are nothing but the trigonometric functions of the normalized arclength l given by 1, sin(2πjl), cos(2πjl), j = 1, 2, . . . , where the arclength l is normalized such that the total arclength of is 1. In particular, a diffusion map with m = 2 in (3.2) that uses the first two nontrivial eigenfunctions sin(2πl) and cos(2πl) embeds onto the unit circle S1 in (note that the eigenvalues associated with these eigenfunctions are equal). In practice, the eigenvectors and their corresponding eigenvalues are only an approximation of their continuous counterparts, and so the embedding may not coincide exactly with the unit circle but can be more “wiggly.”
Suppose we compute the first and second nontrivial eigenvectors of L̃ and denote them by and . The eigenvectors and are vectors of length n, and from the convergence theorem stated above it follows that their ith components and approximate the corresponding values of the eigenfunctions of the Laplace–Beltrami operator over at the point xi. Since the first and second eigenfunctions of the Laplace–Beltrami operator are known to be sin(2πl) and cos(2πl), it follows that and , where l(xi) is a particular choice of the normalized arclength function. We can therefore estimate the ordering of the (perpendicular) beaming directions θ1, . . . , θn ∈ S1 by the ordering of the phases
In other words, the embedding practically solves the problem, up to some nonlinear (“warp”) transformation which is due to the arclength function l(x). Still, the monotonicity of the arclength function ensures that the ordering of the beaming directions is estimated correctly. Once the ordering is revealed, the beaming directions are estimated by equally spacing them over the unit circle. This estimator is consistent due to the underlying assumption about the uniform distribution of the beaming directions.
We remark that it is also possible to use the eigenvectors ϕ1 and ϕ2 of L in order to estimate the beaming directions, despite the fact that L approximates the Fokker–Planck operator and that the eigenfunctions of the Fokker–Planck operator are no longer the sine and cosine functions. As discussed in [12], the Fokker–Planck operator over a simple closed curve is a Sturm–Liouville operator with periodic boundary conditions and positive coefficients, and from the classical Sturm–Liouville theory of [9] it follows that the embedding of into given by also circles the origin exactly once in such a manner that the angle is monotonic (here, ϕ1 and ϕ2 are eigenfunctions rather than eigenvectors). In other words, upon writing the embedding in polar coordinates
the argument φ(l) is a monotonic function of l, with φ(0) = 0, φ(1) = 2π. Despite the fact that the explicit form of the eigenfunctions is no longer available, the graph Laplacian embedding reveals the ordering of the projections through the angle φi attached to xi. Once the order of the beaming directions is revealed, they are estimated by spreading them evenly over S1 (see also section III in [12]). This is a consistent estimator of the beaming directions if they are assumed to be uniformly distributed.
Note that the correct ordering of the beaming directions is revealed even if the beaming directions are not uniformly distributed. However, it is impossible to accurately estimate the beaming directions without prior knowledge of the underlying nonuniform density. This is perhaps the main difference between the 2-D reconstruction problem considered here and its three-dimensional (3-D) analogue that corresponds to the reconstruction of macromolecules from their 2-D tomographic images taken at unknown random directions as in cryoelectron microscopy images [17]. In the 3-D problem, the slice-theorem implies that any two central slices share a common line of intersection that can be used to find the unknown imaging directions even when they are not uniformly distributed. This implication is of great importance since the imaging directions are nonuniform whenever the biological object has a preferred orientation, as is often the case. However, in the 2-D problem, the implication of the slice-theorem is trivial, as it implies only that any two line projections intersect at a point (the origin in the Fourier domain). This trivial intersection cannot be used to improve the estimate of the beaming directions beyond their ordering.
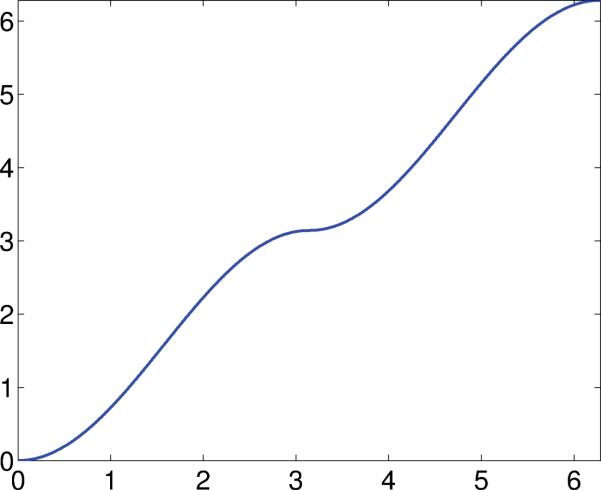
We now give a detailed explanation for the impossibility of accurately estimating the beaming directions if their distribution is not known in advance and is not necessarily uniform. To that end, suppose that f(x, y) is the image to be reconstructed and f̂(ωx, ωy) is its Fourier transform. We assume that f is compactly supported and is in L2 so that both its Radon and Fourier transforms are continuous. In light of the projection slice-theorem, it is convenient to regard the frequency ω = (ωx, ωy) as a complex number and its representation in polar coordinates as ω = reıθ, where r is the modulus of the frequency and θ is the phase. Now, suppose that g : S1 → S1 is a continuous, 1-to-1, and onto mapping from the unit circle to itself, also satisfying g(–ω) = –g(ω) for all ω ∈ S1. The last condition implies that g maps antipodal points to antipodal points. As a result, g can be regarded as a continuous, 1-to-1, and onto mapping from the projective space to itself. That is, g maps central lines to central lines. The rigid mapping that rotates the circle by a fixed angle is an example of such a mapping. However, there are many nonrigid (nonlinear) transformations that “warp” the circle. Note that only rigid transformations preserve the underlying distribution of the beaming directions. For example, the uniform distribution remains uniform under rotation. Nonrigid transformations change the distribution. For example, if g is differentiable, then the density is changed according to the derivative of g. See Figure 1 for the following example of such a nonrigid transformation g:
Consider now the function h(x, y) whose Fourier transform ĥ is given by ĥ(ωx, ωy) = ĥ(reıθ) = f̂(rg(eıθ)). Clearly, ĥ and f̂ agree on central lines (though possibly at different angles). Combined with the slice-theorem, this means that the set of line projections of h is the same as the set of lines projections of f. Of course, this does not mean that the Radon transform of h equals the Radon transform of f. However, this establishes that f and h are indistinguishable given just samples of their Radon transforms at unknown angles, unless the distribution of the viewing directions is known in advance, such as uniform.
Figure 1.
An example of a nonrigid transformation g (both axes are from 0 to 2π).
We comment that it is also possible to search for the underlying closed curve directly, an approach that boils down to solving the traveling salesman problem (TSP) in high dimensions. Although the TSP is NP hard, there are many algorithms (heuristics and approximation algorithms) for finding its solution. The diffusion map approach that we invoke here is an efficient way of finding a solution to this specific case of TSP (which is far from being the general TSP problem, as the underlying geometry corresponds to a closed curve). Due to noise, however, the original Euclidean distances between the Radon projections are not so meaningful for low SNRs. Thus, TSP solvers face the same difficulties as the diffusion mapping approach faces, emphasizing the importance of denoising.
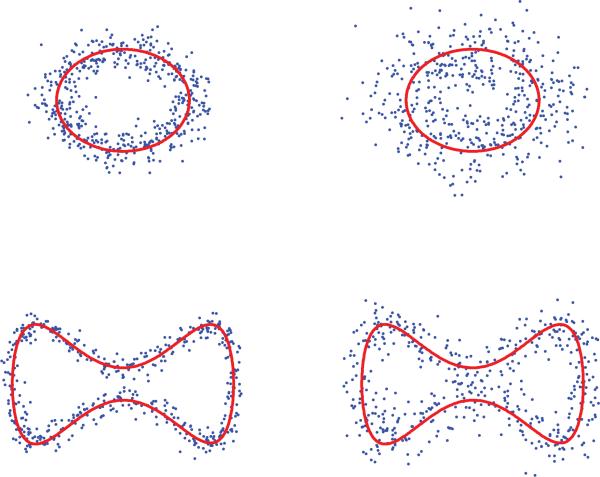
Indeed, noise is the main limitation of the diffusion mapping approach, since the measurement noise causes the data points to deviate from the curve. The perturbation of the data points by noise may distort the topology of the data set from being a simple closed curve. This is conceptually illustrated in Figure 2. It is reported in [12] that for noisy projections of the Shepp–Logan phantom, the diffusion map approach succeeds only for an SNR above 10.5dB (the SNR is later defined in (7.1)). It is further reported in [12] that applying classical wavelet noise filtering techniques prior to the diffusion mapping step allowed successful reconstructions for SNR above 2dB. This significant improvement encourages us to explore other denoising techniques, with our main goal being to further improve the robustness of the algorithm to noise. We proceed to show that it is possible to significantly increase the robustness to noise by applying PCA, Wiener filtering, and graph denoising prior to the diffusion mapping step.
Figure 2.
Upper row: The data (blue points) sampled from a circle (red line) at different noise levels. Lower row: The data (blue points) sampled from a closed curve (red line) at different noise levels.
4. PCA and Wiener filtering
Clearly, noise perturbs the topology through making the distances between projections (data points) less meaningful. It is therefore desirable to denoise the projections prior to computing the similarity matrix W. A good denoising procedure will retain most characteristic features of the true signal while diminishing the contribution of noise. Thus, it is more beneficial to construct a similarity matrix W from the properly denoised projections. For example, in [12], denoising the projections using wavelet spin-cycling significantly improved the noise tolerance of the diffusion map algorithm. A possible limitation of the wavelet denoising approach is that the prechosen wavelet basis is not adaptive to the data, and it is reasonable to believe that an adaptive basis will lead to improved denoising. One way of constructing such an adaptive basis is using PCA. The main contribution of this section is the derivation of the linear filtering procedure (4.29), which we prove to be asymptotically optimal in the mean squared error sense in the limit n, p → ∞ and with p/n = γ fixed.
4.1. PCA: The basics
PCA is a linear dimensionality reduction method dating back to 1901 [34] and is one of the most useful techniques in data analysis. Indeed, usually the first step in the analysis of most types of high-dimensional data is performing PCA, and the situation here is no different. PCA finds an orthogonal transformation which maps the data to a new coordinate system such that the greatest variance by any projection of the data comes to lie on the first coordinate (called the first principal component), the second greatest variance on the second coordinate, and so on. Given a p-dimensional random variable x with mean and a p × p covariance matrix , the solution to the maximization problem
is given by the top eigenvector u1 of Σ satisfying Σu1 = λ1u1. The eigenvalues of Σ denoted λ1 ≥ λ2 ≥ · · · ≥ λp ≥ 0 are also known as the population eigenvalues. Similarly, the first d eigenvectors u1, . . . , ud corresponding to λ1, . . . , λd are the solution to
The d-dimensional subspace spanned by the first d eigenvectors is therefore optimal in the sense that it captures the most variability of the data. From an alternative point of view, the first principal component u1 is the axis which minimizes the sum of squared distances from the mean shifted data points to their orthogonal projections on that axis:
In general, the first d principal components span a d-dimensional linear subspace that minimizes the mean square of the approximation error of the data by its orthogonal projection (after mean shift).
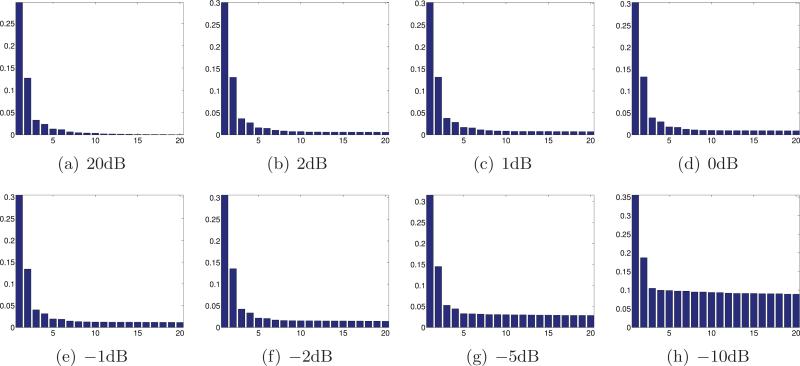
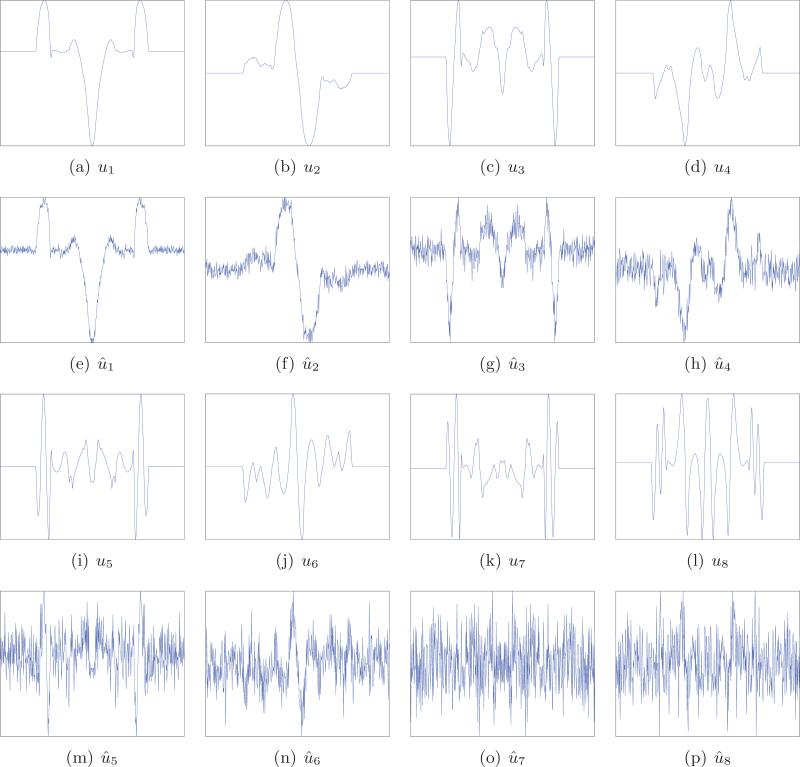
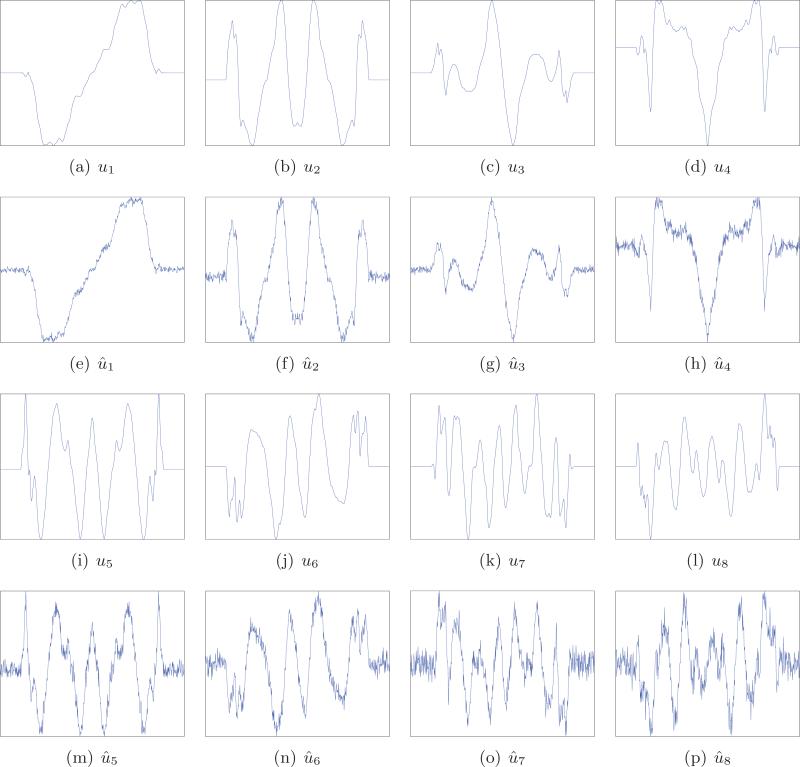
Many real world data sets, though possibly complex and nonlinear, are well approximated by a low-dimensional subspace, hence the usefulness of PCA. In our case, Figure 7(a) shows the top 20 eigenvalues of the sample covariance matrix for projections with very high SNR of the Shepp–Logan phantom. The rapid decay of the eigenvalues is evident. As a result, projecting the data onto the subspace spanned by the first 15 or so principal components results in a very small approximation error. This means that although the curve is highly nonlinear, its deviations from this 15-dimensional linear subspace in are small. We illustrate the first 8 principal components in Figure 8. Since white noise is evenly distributed over all components, projecting the data onto that 15-dimensional subspace would decrease the energy of the noise by a factor of 15/p while almost completely preserving the true signal features. This has, of course, a most desirable denoising effect.
Figure 7.
Bar plots of the first 20 eigenvalues of the sample covariance matrix corresponding to noisy projections at different levels of noise. The numbers of significant principal components K̂ determined by [25] are 49, 12, 10, 10, 8, 7, 6, and 3.
Figure 8.
The first eight principal components for clean projections and the first eight principal components for noisy projections with SNR = –5dB. Note that the principal components are determined up to an arbitrary sign, and we choose the signs so that corresponding pairs of components are positively correlated.
4.2. Linear Wiener filtering
We see in the example of the Shepp–Logan phantom that PCA can be used to denoise the 1-D projections. But what about other phantoms, and how many components should be used in general? And, would it be perhaps more beneficial to use a weighted projection? To answer these questions, we revisit the classical linear Wiener filtering approach [38] for finding the optimal weighted projection.
Consider the additive noise model, where the noisy observation y is given by
| (4.1) |
where x is the underlying clean signal and ξ is an additive white noise.1 We assume that and , while and . Given the noisy observation y, we want to derive an estimator x̂ for its unknown underlying clean signal x. A possible optimality criterion for deriving the estimator x̂ is the minimum conditional mean squared error
| (4.2) |
The well-known minimizer of (4.2) is the conditional expectation
| (4.3) |
However, computation of the conditional expectation (4.3) requires the knowledge of the probability distribution of x, which is not available to us: Only the second order statistics of x is assumed to be known.2 An alternative approach is therefore required. One of the standard alternative approaches consists of two modifications: first, replacing the conditional mean squared error in (4.2) by the mean squared error (i.e., removing the conditioning on y), and second, restricting the minimizer of (4.2) to a smaller class of linear estimators instead of all possible estimators. That is, the estimator x̂ is restricted to be of the form
| (4.4) |
where H is a p × p matrix which is the solution to the minimization problem
| (4.5) |
The solution to (4.5) is given by (see, e.g., [28, Chap. 46, eqs. (46.9)–(46.12), pp. 550–551])
| (4.6) |
This solution is obtained in two steps. First, rewrite the mean squared error using the trace
| (4.7) |
where we used the independence of noise and signal as well as their first and second order moments. Second, differentiate (4.7) with respect to H (using the fact that ) to obtain
whose solution is given in (4.6). Plugging (4.6) into (4.4) provides the “optimal” linear filter
| (4.8) |
The estimator x̂ has a simple form when written in the basis of eigenvectors of Σ:
| (4.9) |
where uk is the kth eigenvector of Σ, that is,
| (4.10) |
and
| (4.11) |
can be considered as the SNR of the kth component.
4.3. PCA in high dimensions
The filtering formula (4.9) requires knowledge of the first and second order moments μ, Σ, and σ2. In practice, however, these are unknown and need to be estimated from a finite collection of noisy observations. Once estimated, the naive approach to filtering would be to replace μ, Σ, and σ2 in (4.9) by their estimated counterparts. However, as we show below, the optimal filter turns out to be different from this naive procedure. But before constructing the optimal filter, it is important to quickly review a few recent results regarding PCA in high dimensions. The reader is referred to [22] for an extensive review of this topic.
Let be n noisy observations from the additive noise model (4.1). The sample mean estimator is defined as
and by the law of large numbers (almost surely) as n → ∞.
The sample covariance matrix Sn is defined as the following p × p matrix:
| (4.12) |
We denote by l1 ≥ l2 ≥ · · · ≥ lp the eigenvalues of the sample covariance matrix Sn and by û1, û2, . . . , ûp the corresponding computed eigenvectors, that is,
| (4.13) |
The sample covariance matrix converges to Σ+σ2Ip×p as n → ∞ (while p is fixed). Assuming that Σ is rank deficient (i.e., its smallest eigenvalue is 0), the noise variance σ2 and the covariance matrix Σ can be estimated from the sample covariance matrix in a straightforward manner. Our assumptions about the function f imply that the covariance matrix is indeed rank deficient. Specifically, recall that f is assumed to be compactly supported in a disk. As a result, in the 1-D projections, the pixel values at the boundaries correspond to noise without any signal contribution. It follows that σ2 can be accurately and simply estimated using the second order statistics of the values of the boundary pixels, provided that regardless of the value of p. If, in addition, , then we can also estimate Σ from the sample covariance matrix and the estimate for σ2.
More thought is needed whenever the number of samples n is not exceedingly large (compared to p), and indeed much attention has been given in recent years to the analysis of PCA in the regime p, n → ∞ with p/n = γ fixed (0 < γ < ∞) [22]. This is also the interesting regime of parameters for the 2-D tomography problem at hand, since typical values for p and n range between several hundreds to several thousands. In such cases, the largest eigenvalue due to noise can be significantly larger than σ2. It is therefore possible for the smaller eigenvalues of Σ to be “buried” inside the limiting Marcenko–Pastur (MP) distribution for the eigenvalues of the noise covariance matrix. As a result, the principal components that correspond to such small eigenvalues cannot be identified. The identifiability of the principal components from the eigenvalues of the sample covariance matrix was studied in [1, 33]. The key result is the presence of a phase transition phenomenon: In the joint limit p, n → ∞, p/n → γ, only components of Σ whose eigenvalues are larger than the critical value
| (4.14) |
can be identified (almost surely) in the sense that their corresponding sample covariance eigenvalues “pop” outside the MP distribution. Formally (see, e.g., [30, Theorem 2.3]), if ξ is white noise and ξ and x have finite fourth moments, then in the joint limit p, n → ∞, p/n = γ, the kth eigenvalue (k is fixed, e.g., k = 2) of the sample covariance matrix converges with probability one to
| (4.15) |
Moreover, the dot product between the population eigenvector uk and the eigenvector ûk computed by PCA also undergoes a phase transition almost surely:
| (4.16) |
This behavior is illustrated in Figure 7: As the level of noise σ increases, fewer components can be identified (here we varied σ and fixed p and n, but similarly, the theory can also be tested by varying any of the three parameters). Figure 8 shows principal components computed from clean projections and principal components that are computed from noisy projections. The resemblance between the two sets of components is evident, with the correlation between the “noisy” components and their “clean” counterparts being greatest for the first component and monotonically decreasing until it becomes completely random due to the phase transition, as predicted by the theory.
4.4. Linear Wiener filter using PCA in high dimensions
Motivated by the form of the optimal linear filter (4.9), we propose the following linear filter:
| (4.17) |
where the scalar coefficients h1, . . . , hp, which we refer to as the filter coefficients, are to be determined from the minimum mean squared error criterion similar to (4.5). In other words, the filter coefficients are the solution to the minimization problem
| (4.18) |
Using (4.1) and the fact that û1, û2, . . . , ûp form an orthonormal basis to , we have
| (4.19) |
Since ξ is white noise with variance σ2 independent of x, and , we get
| (4.20) |
It follows that
| (4.21) |
The optimal filter is therefore given by
| (4.22) |
In practice, however, this filter cannot be used, since σ2, Σ, and μ are unknown. Instead, we determine the filter coefficients in the limit n, p → ∞ and with p/n = γ fixed, and refer to the resulting filter as the asymptotically optimal filter. First, converges (almost surely) to μ in the limit, so the term converges to zero for all k. Second, from (4.10) it immediately follows that
| (4.23) |
From (4.16) it follows that the first term on the right-hand side of (4.23) converges almost surely to . We proceed to show that the second term (involving the summation) tends to 0 under appropriate rapid decay assumptions about the population eigenvalues. For example, under the “spike” model [22], where Σ is assumed to have only a finite number K of nonzero eigenvalues (i.e., λ1 ≥ λ2 ≥ · · · λK > 0 and λK+1 = · · · = λp = 0), we have that
Let c̃kuk be the orthogonal projection of ûk onto uk, that is, ûk = c̃kuk + rk, where rk is perpendicular to uk, and (notice that almost surely as p → ∞). Since uk is perpendicular to ul for l ≠ k, we have that |〈ûk, ul〉|2 = |〈rk, ul〉|2. The vector rk is a random vector uniformly distributed over the (p – 1)-dimensional sphere of radius [6, 29]. As a result, the expected value of the squared correlation is (recall that the expected value for the squared correlation of any unit vector with a random unit vector in is ). Moreover, with a probability that goes to 1 as p → ∞, the squared correlation is bounded by for some C > 0. Altogether, we get that for l ≠ k, |〈ûk, ul〉|2 = |〈rk, ul〉|2 → 0 (almost surely) as p → ∞. Therefore, in the spike model we obtain that
| (4.24) |
almost surely for all k. The spike model may be considered to be too restrictive for the tomography problem at hand. We would like to relax the assumption about the finite number of nonzero eigenvalues. A more realistic assumption would be that the eigenvalues decay sufficiently quickly. For example, suppose that there exists α < 1 such that
| (4.25) |
The assumption (4.25) does not hold for all images. For example, it does not hold for a 2-D image consisting of white noise windowed to a disk, as in this case Tr(Σ2) = O(p). However, (4.25) is expected to hold for a large class of images that arise in CT. We conjecture, without providing a formal proof, that assumption (4.25) implies (4.24). We are motivated to make this conjecture by the following heuristic arguments. The Cauchy–Schwarz inequality and (4.25) imply
where C > 0 is some constant. We foresee a large deviation bound for the term
since each of its p–1 individual summands is expected to concentrate at O(1/p2). A Bernsteinlike inequality would then imply that this term is with high probability that goes to 1 as p → ∞. Since for α < 1, we expect the conjecture to hold true.
Under the spike model or, alternatively, assumption (4.25) (provided that the above conjecture holds true), the optimal filter coefficients (4.22) converge almost surely to
| (4.26) |
where SNRk is given in (4.11). Using (4.16), we rewrite the filter coefficients as
| (4.27) |
where
| (4.28) |
We conclude that in the limit n, p → ∞ and with p/n = γ fixed, the asymptotically optimal linear Wiener filter is given by
| (4.29) |
Comparing (4.29) and (4.9), we find that filtering using the computed eigenvectors is more aggressive compared to filtering using the population eigenvectors, in the sense that the decay of the filter coefficients is faster due to the extra terms. We explain the excess aggressiveness of the filter (4.29) in its need to compensate for the fact that the computed principal components are noisier for smaller population eigenvalues.
Although we derived the optimal filter (4.29) in the limit n, p → ∞, we suggest using it in the practical case of a finite number of sample points. That is, the filter we propose using is
| (4.30) |
where K̂ is the number of components estimated to satisfy .
In order to use the filter (4.30) in practice, we need to know the noise variance σ2 and the eigenvalues λ1, . . . , λp. These are, however, unknown and need to be estimated from the data. We mentioned earlier that σ2 can be estimated using the boundary pixels that correspond merely to noise. Here we adapt the estimation method suggested recently by Kritchman and Nadler [25, 26] and conveniently use their MATLAB code.3 The exact details of their procedures are beyond the scope of this paper, but the interested reader is urged to check their papers for details, analysis, and the history of the problem. Their method provides an estimator for the noise variance and an estimator K̂ for the number of components satisfying (4.14) under the (more restrictive) spike model assumption. The top K̂ population eigenvalues λ1, . . . , λK̂ are then estimated as the positive solutions to the decoupled quadratic equations
as implied by (4.15). Figure 7 illustrates the estimators for a particular example.
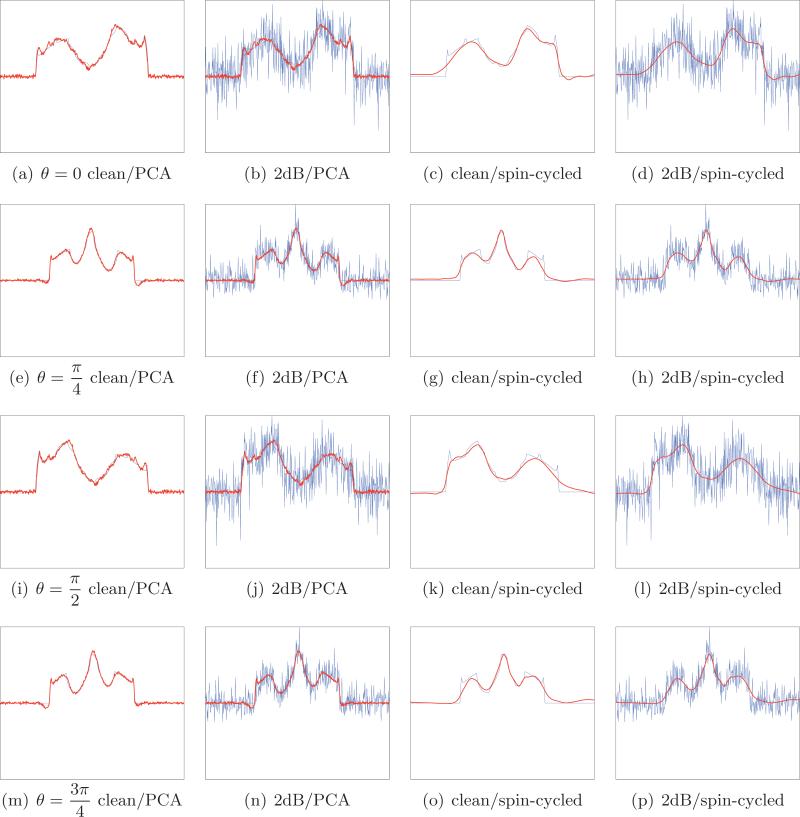
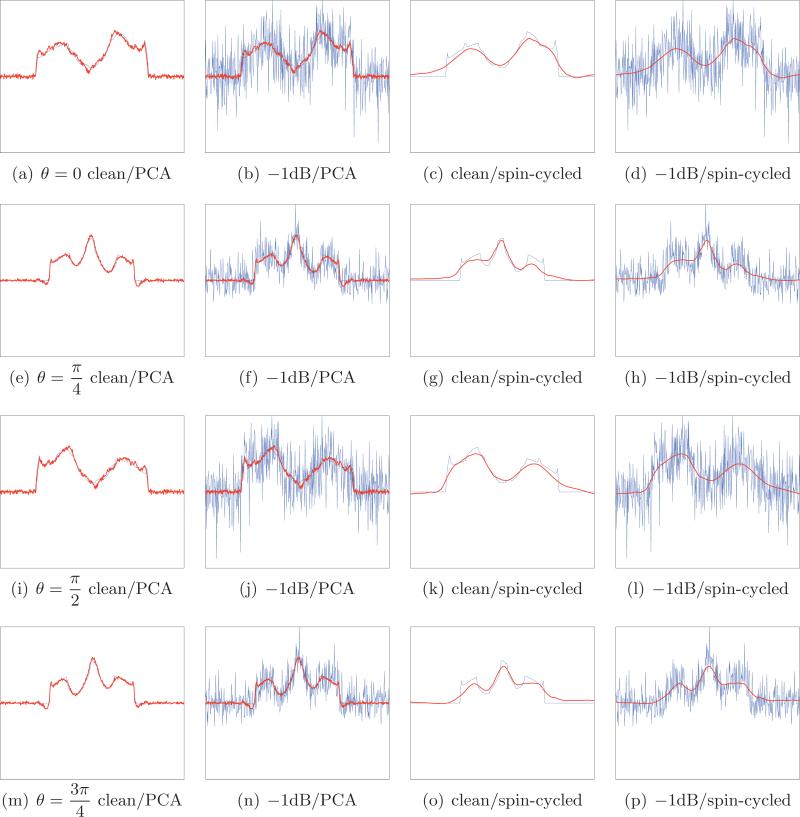
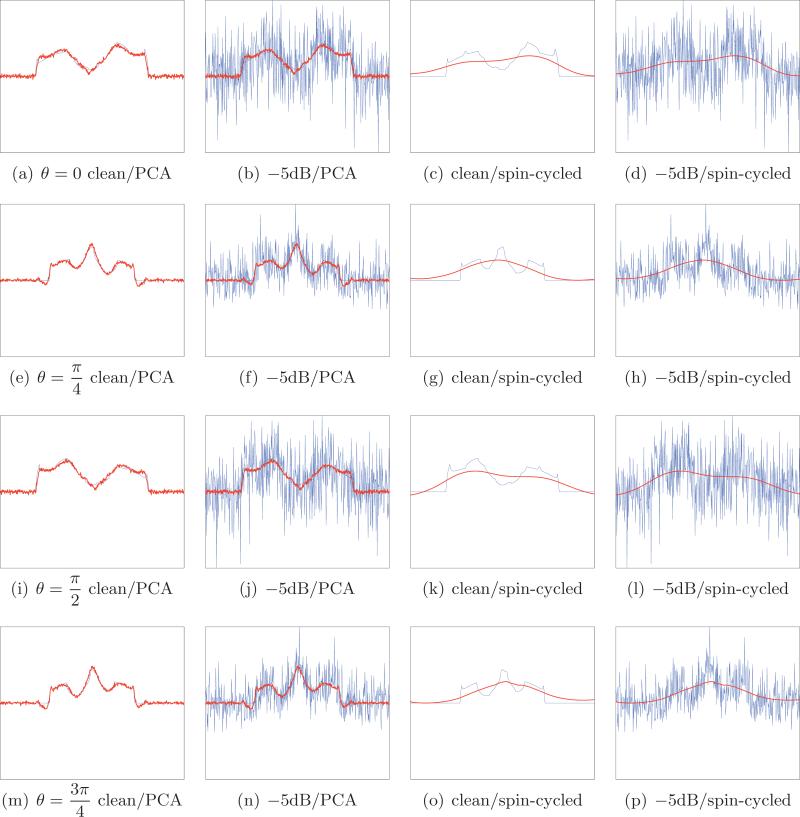
Figures 11 and 12 show several denoised projections using (4.30) for different viewing directions and different levels of noise. The root mean squared error (RMSE) using the combined PCA-Wiener filter method is significantly smaller than the RMSE of the wavelet spin-cycling method. We emphasize that the PCA-Wiener filtering method does not require any external parameters: It is completely adaptive to the data and is free of any tuning parameters.
Figure 11.
Comparison between the combined PCA-Wiener filtering and wavelet denoising for four different noisy projections with SNR = 2dB taken at , and . (a) Clean projection (blue) and the PCA denoising of the noisy projection (red); (b) noisy projection (blue) and its filtered version using PCA (red); (c) clean projection (blue) and the wavelet denoising of the noisy projection (red); (d) noisy projection (blue) and its filtered version using wavelets (red). The number of principal components used by the Wiener filter is 12. RMSE: 0.464 for the PCA-Wiener scheme and 0.612 for wavelets.
Figure 12.
Comparison between the combined PCA-Wiener filtering and wavelet denoising for four different noisy projections with SNR = –1dB taken at , and . (a) Clean projection (blue) and the PCA denoising of the noisy projection (red); (b) noisy projection (blue) and its filtered version using PCA (red); (c) clean projection (blue) and the wavelet denoising of the noisy projection (red); (d) noisy projection (blue) and its filtered version using wavelets (red). The number of principal components used by the Wiener filter is 8. RMSE: 0.514 for the PCA-Wiener scheme and 0.745 for wavelets.
We remark that while optimality of the filter is guaranteed in the limit n, p → ∞, we cannot claim optimality in the finite sample case. The deviation of (4.26) from (4.22) due to finite sample effects is not explored in this paper and is left for future research. It is plausible that suitable finite sample corrections would lead to an improved filtering procedure in the practical finite sample case.
Finally we remark on the possibility of using “sparse PCA” [7, 23] for an improved filtering scheme. The clean projections (shown in Figure 11) and the clean principal components shown in Figure 8 are piecewise smooth functions and are therefore expected to have a sparse representation in a suitable wavelet basis. We emphasize that while this property seems to hold for the Shepp–Logan phantom, it is not expected to hold in general for all possible 2-D images. In cases where the components are piecewise smooth, one may benefit from applying sparse PCA techniques [7, 23] in order to produce more accurate, and, under certain conditions, even consistent, estimators of the principal components and their eigenvalues. Our empirical experience with sparse PCA for the 2-D tomography problem is positive, but we postpone the derivation of the optimal filter for sparse PCA to future investigation.
4.5. Parity of components and their minimal required number
We conclude with a discussion of two PCA related issues that are more specific to the 2-D tomography problem. The first issue concerns the parity of the principal components. The perceptive reader has probably noticed that all components shown in Figure 8 are either even or odd functions. This is not a mere coincidence: The principal components are either even or odd functions, regardless of the underlying image, whether it is the Shepp–Logan phantom or another image. To see this, note that the projection taken at direction –θ is related to the projection at direction θ through
| (4.31) |
This motivates us to artificially double the number of projections from n to 2n by including all mirrored projections that correspond to the antipodal directions. The resulting sample covariance matrix commutes with the reflection matrix; therefore its eigenvectors are either even or odd, as inspected. However, the reflected projections are clearly dependent on the original ones; in particular, the realizations of noise are no longer independent, a necessary assumption for the method of [25, 26]. Thus, we cannot simply employ [25, 26] using the parameters 2n for the number of samples and p for the dimension. Fortunately, there is a simple remedy to this problem. Instead of doubling the number of projections, we first project the n projections onto the two orthogonal linear subspaces of even and odd functions, each of which is of dimension p/2 (for simplicity, we assume p is even). The even and odd projectors, restricted to the positive axis s > 0, are denoted PE and PO, respectively, and are given by
| (4.32) |
and
| (4.33) |
We restrict the projected projections to the positive axis (s > 0), hence representing each projection with just p/2 pixels, form two sample covariance matrices of size (p/2) × (p/2), compute their eigenvectors and eigenvalues, and reflect the computed eigenvectors to the negative axis (s < 0) based on the parity (even or odd). This procedure results in exactly the same eigenvectors and eigenvalues of the p × p sample covariance formed from the n original projections and their n reflections. Also, the realization of noise in the two sample covariance matrices remains independent. Thus, we apply the method of [25, 26] for each of the two (p/2) × (p/2) sample covariance matrices separately, using parameters p/2 for the effective dimension and n for the number of samples.
The second issue concerns the minimum number of principal components required to solve the 2-D tomography problem. Clearly, it is impossible to determine the viewing directions of the projections by using just the top principal component; at least two principal components are necessary to preserve the topology of a closed curve. But is it also a sufficient number of components? Figure 9 shows the embedding of the closed curve of projections of the Shepp–Logan phantom onto the subspace spanned by the top two principal components. Clearly, the projected curve has a nontrivial self-intersection, rendering the impossibility of unique viewing direction determination.4 The self-intersection is a byproduct of the parity of the top two principal components. Note that in the case of the Shepp–Logan phantom, the first principal component u1 is an even function, while the second component u2 is an odd function. Consider the expansion of the projection Rθf in terms of the mean projection μ and the principal components u1, u2, . . . :
Suppose θ* is a viewing direction for which a2(θ*) = 0, that is, Rθ* f – μ is perpendicular to u2: Such a direction must exist due to the continuity of the Radon transform (Proposition 2.1) and due to the fact that
The reflection property (4.31), the fact that the mean μ and the first component u1 are even functions, and a2(θ*) = 0 together imply that the projections onto the top two principal components of R–θ* f and Rθ* f coincide:
This explains the nontrivial self-intersection of the 2-D PCA map in the case of the Shepp–Logan phantom. While the above discussion focused on the Shepp–Logan example, it can be easily generalized to any image, and it allows us to conclude that, for a general image, at least two odd principal components are needed in order to avoid nontrivial self-intersections. This is a necessary condition, although it may not be sufficient. Returning to the Shepp–Logan example, we observe that the 3-D PCA mapping of also exhibits a nontrivial self-intersection, since u3 happens to be an even function. The fourth component u4 turns out to be an odd function, and Figure 9 shows that the PCA mappings in dimension four (and therefore also in higher dimensions) successfully preserve the topology of . This is also demonstrated by the 2-D diffusion map embeddings shown in Figure 10. From this discussion we also conclude a theoretical limitation of any PCA-based method for solving the 2-D tomography problem in the case of a general underlying image. Indeed, recall that the identifiable components are those whose eigenvalues are greater than the critical value (4.14) (where the effective dimension is p/2 instead of p as discussed above). It follows that there exists a theoretical limitation for any PCA-based method such as ours: A necessary condition is that the number of samples n is sufficiently high as well as that the noise variance σ2 is sufficiently low so that at least two odd components can be identified; i.e., their corresponding eigenvalues must be greater than .
Figure 9.
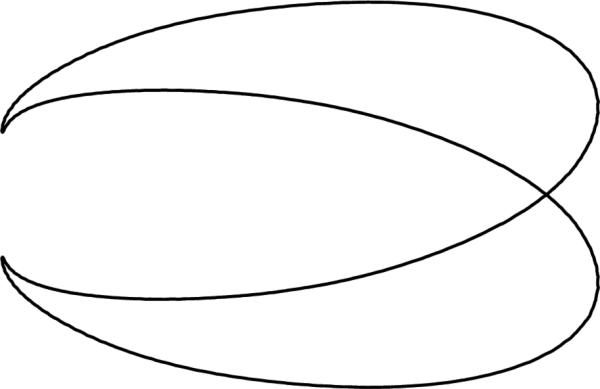
Projecting the curve of clean projections of the Shepp–Logan phantom onto the linear subspace spanned by the top two principal components. The projected curve has a nontrivial self-intersection, implying the insufficiency of just two principal components.
Figure 10.
The diffusion map embedding of after the latter was mean shifted and projected onto the linear subspace of the top K principal components (K = 2, 3, 4, 5). As expected from the parity sequence of the principal components, at least four components are required to avoid nontrivial self-intersections.
5. Graph denoising
As mentioned above, the diffusion map method is limited in the presence of noise, as the latter may change the topology of the underlying manifold, even when using the combined PCA-Wiener filtering scheme. In our case, noise can “shortcut” the curve (see, e.g., Figure 2). It is therefore desirable to detect such shortcut edges in advance and remove them from the similarity matrix W.
After their introduction by Watts and Strogatz [37], small-world graphs were extensively used to describe many natural phenomena [21]. We briefly describe the small-world graph model. A d-regular ring graph is a graph whose vertices can be viewed as equally spaced points on the circle, and whose edges connect every point to its d nearest neighbors. The small-world network is constructed from the ring graph by randomly perturbing its edges: With probability q each ring edge is rewired to a random vertex, and with probability 1 – q it remains untouched. We refer to the rewired edges as “shortcuts.”
The small-world graph obtained by rewiring the edges of the ring graph has the following useful property: The number of common neighbors for the vertices i and j with a “shortcut” edge e = (i, j) between them is expected to be much smaller than the number of common neighbors of two nearby vertices [37]. Thus, the number of common neighbors can be used as a measure for detecting shortcut edges from the edges of the original ring graph. One of the many possible measures for this detection is the Jaccard index, defined by
| (5.1) |
where Ni is the set of vertices connecting to vertex i. It is therefore expected that the Jaccard index of shortcut edges will be smaller than that of the original ring edges.
Using the Jaccard index we can therefore detect the shortcut edges in the graph and further remove them in order to reveal the structure of the original graph. This observation was used in [18] to reveal the underlying structure of protein interaction maps. In our case, noise can fool us to believe that two projections of entirely different beaming directions correspond to two similar beaming directions. While the underlying geometry of the graph should be that of a simple closed curve, such confusion due to noise is realized by shortcut edges that may change its topology. This change in topology can affect the long time behavior of the random walk on the graph. Indeed, it was observed in [37] that the mixing time of the random walk on a small-world graph having a relatively small number of shortcut edges is significantly shorter compared to the mixing time of the random walk on the ring graph. It is therefore desirable to detect and remove the shortcut edges prior to estimating the beaming directions using the diffusion map technique. We use the Jaccard coefficient in order to detect and remove such shortcut edges. Specifically, we set the similarity Wij to zero for all edges (i, j) for which the Jaccard index J(i, j) is below some threshold. The threshold value is chosen by the number of edges we wish to keep.
The Jaccard index can be computed efficiently as follows. Suppose W is the adjacency matrix of the graph (that is, the entries of W are either 0 or 1). The graph may be either directed or undirected, where in the latter case the matrix W is symmetric. The number of common neighbors to i and j is
and the number of neighbors of i is
where 1 = (1, 1, . . . , 1)T is the all-ones vector. The inclusion-exclusion principle implies that
The Jaccard index J(i, j) can therefore be written as
| (5.2) |
or, equivalently, in matrix notation
| (5.3) |
where ./ denotes elementwise division (as in MATLAB). Note that J is a symmetric matrix; that is, J = JT even if W is nonsymmetric as in the directed graph case.
The benefit of using (5.1) together with diffusion maps can be summarized by the viewpoint of different time scales. On the one hand, the beaming directions are estimated from the top first and second nontrivial eigenvectors of the random walk matrix A. These eigenvectors correspond to the long time behavior of the random walk over the data points, since they correspond to the largest (nontrivial) eigenvalues of A. On the other hand, the computation of (5.1) involves only the common neighbors, which is related to the diffusion process at a short time scale, corresponding to at most two steps of the random walk. While the purpose of the Jaccard index is to remove the “bad” edges, the purpose of the diffusion mapping using the top two eigenvectors is to reveal the global ordering of the beaming directions.
6. Algorithm
In this section we summarize the steps of our reconstruction algorithm. The input to the algorithm consists of n noisy projections y1, . . . , yn, each of which is a vector in corresponding to the discretization of the p equally spaced detectors. The algorithm depends on only two parameters, denoted α and β, that are explained in Steps 2 and 3 below. These parameters either can be prechosen by the user or the algorithm can automatically search for their optimal values.
Step 1: PCA and linear filtering. Project y1, . . . , yn onto the subspace of even functions and onto the subspace of odd functions; see (4.32)–(4.33). Perform PCA twice, once for each subspace, and extend the computed eigenvectors to vectors of length p based on the parity. Each PCA can be computed by either forming the sample covariance matrix or by using the singular value decomposition (SVD), which is the preferred method due to computational considerations.5 The computed eigenvalues are fed into the method of [25] to estimate the number of components K, the noise variance6σ2, and the signal-to-noise ratios SNRγ,k. Denoise all projections using the filter (4.30), and denote the filtered projections . Compress each filtered projection to using its first K̂ expansion coefficients 〈x̂i, ûk〉 (k = 1, . . . , K̂), and denote
| (6.1) |
Step 2: Similarity matrix W. For each of the n compressed projections in search for its N nearest neighbors with respect to the Euclidean distance . Assuming that changing the beaming direction by α degrees has a small effect on the Radon projection, choose . If α is not prechosen by the user, then the algorithm is repeated with different values for α, and in Step 6 of the algorithm it automatically chooses the optimal reconstruction based on a criterion described in Step 6. From the results of the nearest neighbors search, construct a directed graph with n vertices corresponding to the projections, and put a directed edge from i to j iff projection j is one of the N nearest neighbors of projection i (that is, iff j ∈ Ni). Construct an n × n similarity matrix Wα whose entries are defined by
| (6.2) |
Note that Wα is not necessarily symmetric. That is, we may have a pair of nodes i and j satisfying j ∈ Ni, but i ∉ Nj.
Step 3: Graph denoising. Calculate the Jaccard index Jα(i, j) for all edges. The second parameter of our algorithm is the threshold value β. Remove all edges whose Jaccard index is less than β. Moreover, keep only edges for which both i ∈ Nj and j ∈ Ni. We denote the thresholded matrix by Wα,β, that is,
| (6.3) |
Note that Wα,β is a symmetric matrix that can be viewed as the adjacency matrix of an undirected graph. If β is not prechosen by the user, then the algorithm tries several different values of β and executes the following steps for each of them separately. That is, the remaining steps of the algorithm are performed on several Wα,βs with different values for β, until Step 6, where we automatically detect the optimal threshold value β, based on the criterion described in Step 6. We remark that for large values of β some nodes may become isolated, that is, all their edges have been removed. We remove such nodes from the graph and, as a result, estimate only the beaming directions of the projections that correspond to the remaining nodes.
Step 4: Diffusion map embedding. Form an n × n diagonal matrix Dα,β with , the normalized weighted matrix W̃α,β := (Dα,β)–1Wα,β(Dα,β)–1, and an n × n diagonal matrix D̃α,β so that . Then we compute the top two nontrivial eigenvectors ϕ1 and ϕ2 of Aα,β whose entries are given by . The embedding reveals the ordering of the beaming directions. We estimate the beaming directions as equally spaced points on S1 according to their ordering.
Step 5: 2-D reconstruction. Invert the Radon transform to reconstruct the 2-D image fα,β from the noisy projections and their estimated beaming directions.
Step 6: Automatic estimation of parameters (optional). At this stage we get several different 2-D image reconstructions fα,β corresponding to the different choices of the parameters α and β used in Steps 2 and 3. Out of all available reconstructions we need to automatically choose the best one using some optimality criterion. One possible criterion is to use the norm of the expansion of the reconstructed image in a wavelet basis. Specifically, for each reconstruction, we compute the 2-D wavelet decomposition of the image fα,β/∥fα,β∥2. Then, we choose the reconstruction whose wavelet coefficient vector has the smallest norm. For the wavelet transform we use the Daubechies db2 mother wavelet with 4-level decomposition. The motivation for this step is that the underlying clean image is expected to be sparse in the wavelet domain. While this heuristic seems to perform well for the Shepp–Logan phantom (see section 7), we do not find it to perform well for many other natural images, including the image that is used in subsection 7.1. For such images other quality measures are expected to perform better, depending on the application domain. We do not explore other quality measures in this paper, and we do not claim that the heuristic is optimal in any sense. We emphasize that Step 6 is optional, and in practice the user may want to use parameters α and β that are predetermined using some sort of manual training.
7. Numerical results
We performed several numerical simulations in order to test the performance of our algorithm. In the first set of experiments the underlying 2-D object was the Shepp–Logan phantom, while in the other set of experiments the underlying 2-D image was a more realistic abdominal CT. For the simulations with the Shepp–Logan phantom, the number of projections was n = 1024, and the number of discretization points was p = 512. In each simulation, we added to the clean projections a Gaussian zero-mean white noise of a fixed variance σ2. We define the SNR (measured in dB) by
| (7.1) |
where S is the array of the noiseless projections. As a reference to later reconstructions, Figure 3(a) shows the original Shepp–Logan phantom, while Figures 3(b)–3(e) show reconstructions of the Shepp–Logan phantom from noisy projections with known beaming directions at different levels of noise.
Figure 3.

Reconstruction of the Shepp–Logan phantom image from projections with known beaming directions at different levels of noise.
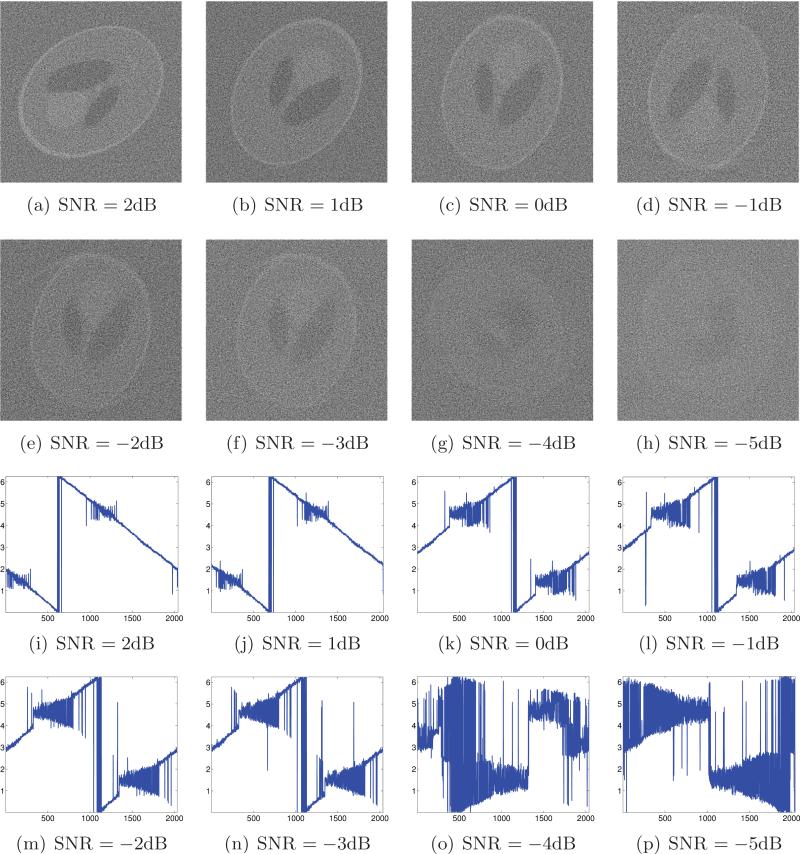
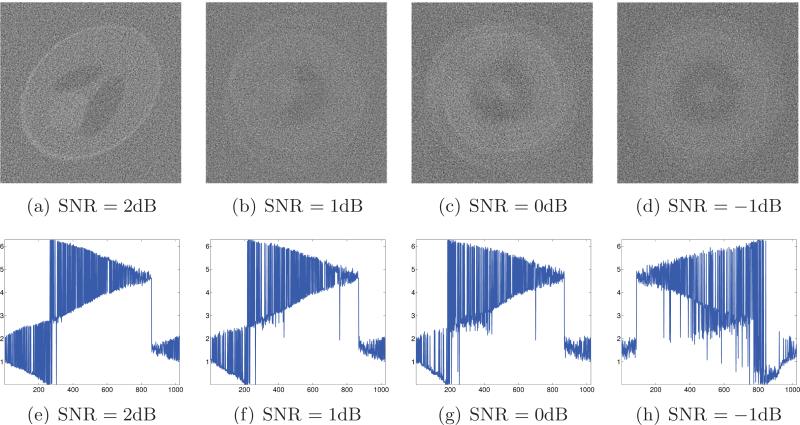
The results of applying the algorithm described in section 6 to noisy projections with unknown beaming directions are illustrated in Figure 4. These results are obtained by fixing the parameter values to α = 6 and β = 0.5. That is, the final optional step of the algorithm was not applied. Obviously, for same level of noise, the reconstructions in Figure 3 have better quality compared to the reconstructions in Figure 4, which are missing the extra knowledge of the beaming directions. Still, our algorithm succeeds in providing similar reconstructions (up to the unavoidable degrees of freedom of rotation and reflection) even when the beaming directions are unknown for SNR = –3dB and above. The main features of the original Shepp–Logan phantom are visible in our reconstructions even at such low SNRs. Figures 4(i)–4(p) demonstrate that the beaming directions are estimated successfully and mostly follow their true ordering for SNR = –3dB and above.
Figure 4.
Top: Reconstruction from noisy projections at unknown directions using the algorithm described in section 6 (excluding Step 6) at different levels of noise with fixed α = 6 and β = 0.5. Bottom: Estimated beaming directions (y-axis) against their correct ordering (x-axis).
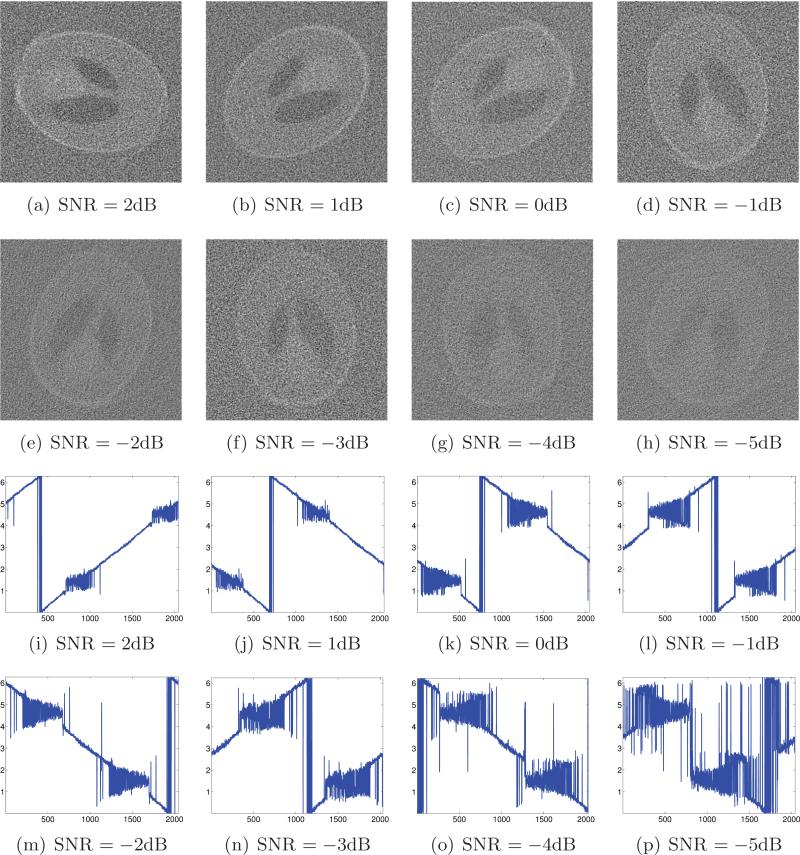
Figure 4 indicates that the algorithm fails to produce a reasonable estimation of the angles for SNR = –4dB and below when using the fixed parameter values α = 6 and β = 0.5. We therefore turned to explore the behavior of the algorithm when the final step is also applied. We searched the parameter space by letting α ∈ {3, 4, 5, 6, 7, 8, 9, 10} and β ∈ {0.35, 0.36, . . . , 0.74, 0.75}. The reconstructions and the beaming angle estimation are shown in Figure 5. The result for SNR = –4dB is much more satisfactory (compared to Figure 4). Even for SNR = –5dB the ordering of the estimated beaming directions is not completely random, and some features of the phantom can still be observed, although the image is quite fuzzy. The optimal values for α and β that were found in Step 6 of the algorithm are summarized in Table 1.
Figure 5.
Top: Reconstruction from noisy projections at unknown directions using the algorithm described in section 6 (including Step 6) at different levels of noise. Bottom: Estimated beaming directions (y-axis) against their correct ordering (x-axis).
Table 1.
The optimal parameter values for α and β as a function of the SNR.
| SNR [dB] | α | β |
|---|---|---|
| 3 | 5 | 0.40 |
| 2 | 5 | 0.41 |
| 1 | 5 | 0.42 |
| 0 | 5 | 0.40 |
| -1 | 5 | 0.40 |
| -2 | 7 | 0.45 |
| -3 | 4 | 0.43 |
| -4 | 4 | 0.46 |
| -5 | 4 | 0.41 |
Figure 6 shows reconstructions obtained by applying the method described in [12] to the same sets of noisy projections. That method uses wavelet spin-cycling denoising instead of PCA and diffusion maps without the graph denoising step, and provides successful reconstructions only for SNR = 2dB and above.
Figure 6.
Top: Reconstructions from noisy projections at unknown directions using the algorithm described in [12] for different levels of noise. Bottom: Estimated beaming directions (y-axis) against their correct ordering (x-axis).
In the following we describe the numerical results that are specific to the different steps of the algorithm. We start with Step 1 for PCA and Wiener filtering in order to denoise the projections. Bar plots of the 20 largest eigenvalues of the sample covariance matrix (including both odd and even functions) corresponding to different levels of noise are shown in Figure 7. The caption of Figure 7 details the number of identifiable components as predicted by [25]. Figure 8 shows the principal components obtained from clean projections as well as the principal components obtained from noisy projections at SNR = –5dB.
Figure 9 shows the 2-D embedding of clean projections obtained by linearly projecting them onto the subspace spanned by the top two principal components. The embedded curve exhibits a nontrivial self-intersection rendering the impossibility of unique determination of the beaming directions when only two components are used. This phenomenon is explained in section 4, where we emphasize that at least two odd principal components are necessary to avoid nontrivial self-intersections. Examination of the parity of the principal components shown in Figure 8 reveals that at least the top four components are needed in order to avoid nontrivial self-intersections. This finding is confirmed by the 2-D diffusion mappings of clean projections after linearly projecting them to subspaces spanned by the top K principal components (K = 2, 3, 4, 5), as shown in Figure 10.
A comparison between denoising the noisy projections using our combined PCA-Wiener filtering approach and denoising using wavelets is illustrated in Figures 11, 12, and 13. The wavelet denoising procedure consists of using the full spin-cycle algorithm [10] with hard thresholding of the Daubechies db2 wavelet coefficients of each projection image, as described in [12]. The comparison shows that both denoising methods do relatively well for SNR = 2dB (Figure 11), but the combination of PCA with the Wiener filter is clearly better for SNR = –1dB (Figure 12) and SNR = –5dB (Figure 13). We attribute the success of the combined PCA-Wiener filter approach at relatively low SNRs to the adaptivity of the principal components and to the optimality criterion of the Wiener filter.
Figure 13.
Comparison between the combined PCA-Wiener filtering and wavelet denoising for four different noisy projections with SNR = –5dB taken at , and . (a) Clean projection (blue) and the PCA denoising of the noisy projection (red); (b) noisy projection (blue) and its filtered version using PCA (red); (c) clean projection (blue) and the wavelet denoising of the noisy projection (red); (d) noisy projection (blue) and its filtered version using wavelets (red). The number of principal components used by the Wiener filter is 6. RMSE: 0.587 for the PCA-Wiener scheme and 0.919 for wavelets.
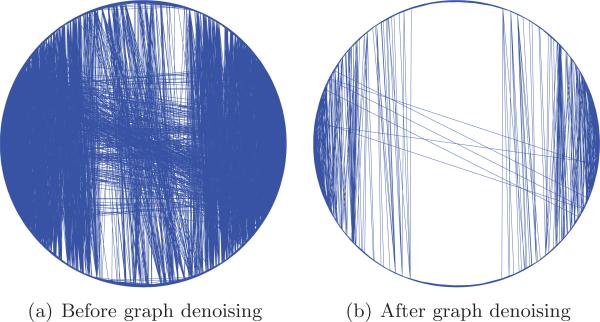
The effect of graph denoising in Step 3 of the algorithm is demonstrated in Figure 14 corresponding to SNR = –4dB. The vertices are arranged on a circle according to the beaming directions of the projections they represent, while edges are represented by chords. The left panel shows the edges of the nearest neighbors graph that is formed in Step 2 with α = 6, while the right panel shows the edges after Step 3 with a thresholding level β = 0.5. A large portion of the “shortcut” edges were successfully removed. We attribute the seemingly nonrandom behavior of the shortcut edges that are left in the denoised graph shown in Figure 14(b) to the particular shape of the Shepp–Logan phantom, which gives rise to somewhat similar projections that are taken at particular different beaming directions.
Figure 14.
The effect of graph denoising (Step 3) for SNR = –4dB and α = 6 by thresholding edges whose Jaccard index is below β = 0.5. (a) The graph after Step 2 with edges given by Wα (6.2), and (b) the graph after Step 3 with edges given by Wα,β (6.3).
Finally, we conducted a large scale experiment with 100 different realizations of noise for each value of the SNR. For that experiment we also incorporated the final step of the algorithm and searched for the optimal parameter values, with α ∈ {3, 4, 5, 6, 7, 8, 9, 10} and β ∈ {0.35, 0.36, . . . , 0.74, 0.75}. The results are summarized in Table 2. Note that the standard deviation of the norm is considerably smaller for SNR = –5dB compared to other SNR values. We explain this by the constant failure of our algorithm to produce satisfactory reconstructions at such a low SNR (the poor reconstruction is indicated by the large norm associated with this SNR).
Table 2.
Performance analysis of our algorithm. For each level of noise we performed 100 independent runs of the algorithm, corresponding to different independent realizations of noise and beaming directions. The table reports the mean and standard deviation (over 100 runs) of the RMSE for denoising using PCA with the asymptotically optimal linear filter, the optimal parameter values α and β, and the norm of the wavelet expansion of the reconstructed image.
| SNR [dB] | RMSE | α | β | |
|---|---|---|---|---|
| 10 | 0.350 ± 0.001 | 7.1 ± 2.5 | 0.41 ± 0.02 | 228.9 ± 1.3 |
| 5 | 0.417 ± 0.001 | 5.2 ± 1.1 | 0.41 ± 0.02 | 256.3 ± 1.6 |
| 3 | 0.448 ± 0.001 | 5.1 ± 0.9 | 0.44 ± 0.05 | 266.7 ± 8.4 |
| 2 | 0.464 ± 0.002 | 5.3 ± 1.0 | 0.45 ± 0.05 | 270.4 ± 9.4 |
| 1 | 0.478 ± 0.002 | 5.3 ± 0.9 | 0.44 ± 0.05 | 271.1 ± 8.8 |
| 0 | 0.497 ± 0.002 | 5.6 ± 1.0 | 0.44 ± 0.04 | 271.4 ± 7.7 |
| –1 | 0.514 ± 0.002 | 6.0 ± 1.1 | 0.45 ± 0.05 | 273.6 ± 8.4 |
| –2 | 0.532 ± 0.002 | 6.4 ± 1.4 | 0.45 ± 0.05 | 273.1 ± 6.1 |
| –3 | 0.550 ± 0.002 | 6.4 ± 1.6 | 0.45 ± 0.05 | 275.3 ± 7.1 |
| –4 | 0.568 ± 0.002 | 6.3 ± 1.8 | 0.47 ± 0.06 | 284.3 ± 8.8 |
| –5 | 0.588 ± 0.002 | 7.5 ± 2.1 | 0.53 ± 0.06 | 292.0 ± 0.2 |
7.1. Numerical experiment for abdominal CT
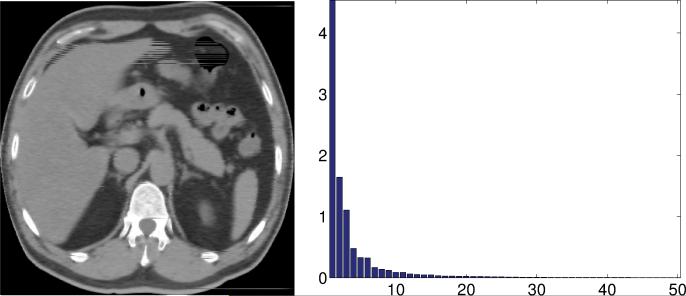
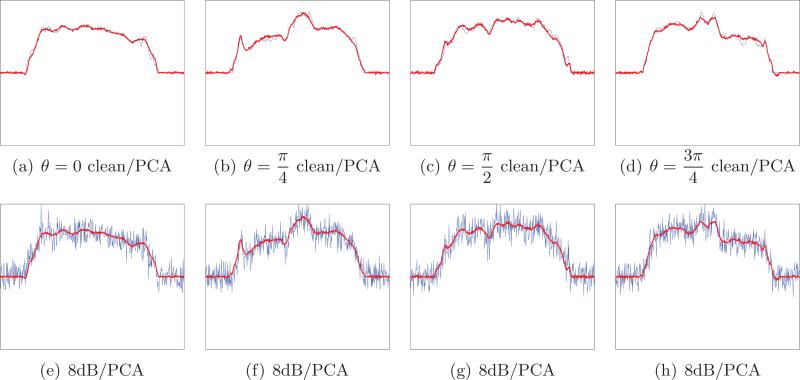
In this section we demonstrate the applicability of our algorithm to a real abdominal CT image (the image is a CT of the second author's father and is used with his permission). The CT image (Figure 15) was obtained by a Toshiba Aquilion 64 CFX CT scanner and is of size 380 × 380 pixels. We randomly picked n = 1024 angles from [0, π] and generated the projections related to these angles. The number of discretization points of each projection is p = 541. The clean projections were contaminated by Gaussian white noise at different noise levels SNR [dB] = 30, 10, 8, 5, 4, 3. The first 50 eigenvalues of the covariance matrix of the clean projections are shown in Figure 15; the first eight eigenvectors of the covariance matrix of the clean projections and the covariance matrix of the noisy projections (SNR = 8dB) are shown in Figure 16. There are only a few dominant principal components although their number is larger compared to the case of the Shepp–Logan phantom. We found that the criterion proposed in Step 6 did not perform well in this case. Instead, we fix the parameters α = 5 and β = 0.6 in all experiments. While these parameters were found to be optimal for the Shepp–Logan phantom, they are not necessarily optimal for the real CT image. Still, by eyeballing the reconstructions that our algorithm produced, we confirmed that these parameters gave satisfactory results. At the moment we do not have a better automatic way of choosing the parameters for images of this kind.
Figure 15.
Left: The abdominal CT image. Right: The first 50 eigenvalues of the covariance matrix of its clean projections.
Figure 16.
The first eight principal components for clean projections of the abdominal CT image and the first eight principal components for noisy projections with SNR = 8dB. Notice that the principal components are determined up to an arbitrary sign, and we choose the signs so that corresponding pairs of components are positively correlated.
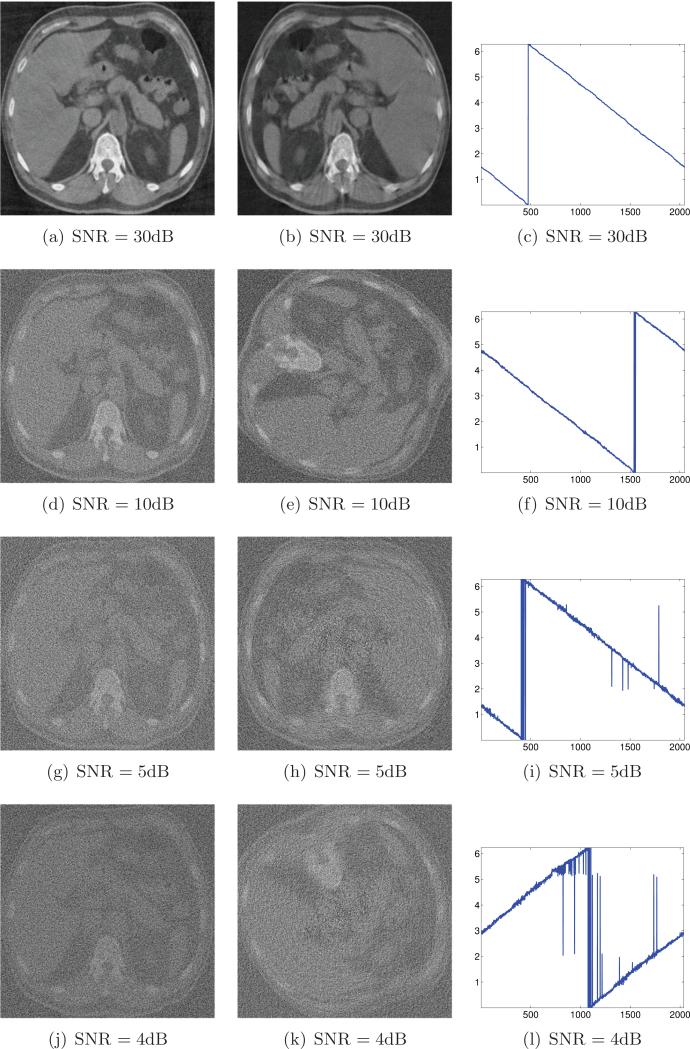
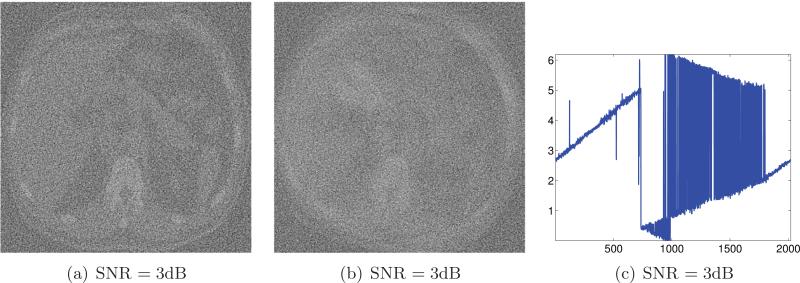
The PCA-based denoising results are demonstrated in Figure 17 when the noise level is 8dB. Figure 18 shows the reconstruction results obtained by applying the entire algorithm (Steps 1–5, excluding Step 6). When the noise level is 4dB, the estimation of the projection angles is accurate, and the large structures are distinguishable; for example, the spinal cord and the liver are visible, although the other parts are blurred. The algorithm fails when the noise level is 3dB or below, as shown in Figure 19.
Figure 17.
Results of the combined PCA-Wiener filtering for four different noisy projections with SNR = 8dB taken at , and . Top: Clean projection (blue) and the PCA denoising of the noisy projection (red). Bottom: Noisy projection (blue) its filtered version using PCA (red).
Figure 18.
Left column: Reconstructions from noisy projections at known directions for different levels of noise. Middle column: Reconstructions from noisy projections at unknown directions using the proposed algorithm for different levels of noise. Right column: Estimated beaming directions (y-axis) against their correct ordering (x-axis). The number of principal components used by the Wiener filter is 95, 21, 15, and 13 for the noise level 30dB, 10dB, 5dB, and 4dB.
Figure 19.
The algorithm fails when SNR = 3dB. Left: Reconstruction from noisy projections at known directions. Middle: Reconstruction from noisy projections at unknown directions. Right: Estimated beaming directions (y-axis) against their correct ordering (x-axis). The number of principal components used by the Wiener filter is 10.
8. Summary and discussion
In this paper we introduced a reconstruction method of 2-D objects from noisy tomographic projections taken at unknown beaming directions. The method combines diffusion maps for finding the unknown beaming directions with two preliminary denoising steps. The first denoising step consists of a combination of PCA and classical Wiener filtering, while the second denoising step consists of denoising the graph of similarities between denoised projections using the Jaccard index from network analysis. The additional denoising steps significantly improve the noise tolerance of the reconstruction method for the Shepp–Logan phantom from a benchmark of SNR = 2dB reported in [12] using diffusion maps and wavelet denoising, to SNR = –3dB obtained here.
We expect the combination of PCA, Wiener filtering, graph denoising, and diffusion maps to be useful in many other applications that require the organization of high-dimensional data with an underlying nonlinear low-dimensional structure. While the diffusion map framework is well adjusted to studying and analyzing complex data sets, it is somewhat limited by noise that may change both the dimensionality and the topology of the underlying data.
The role of PCA in our procedure is to denoise the noisy projections by projecting them onto a low-dimensional subspace that captures most of the variability of the data and is adaptive to the data in that sense. We combined recent results for PCA in high dimensions with the classical Wiener filtering approach in order to derive an asymptotically optimal filter. We believe that this result may be valuable in many other applications. Our asymptotically optimal filter requires the estimation of the noise variance, the number of identifiable principal components, and the population eigenvalues. These are estimated in practice using the method of [25]. Our numerical experiments show that denoising by PCA outperforms denoising by a prechosen basis such as a wavelet basis, and we attribute this success to the data adaptivity of the PCA basis.
The second denoising step in our procedure consists of denoising the graph using the Jaccard index. The objective in this denoising step is to restore the correct topology of the data by removing “bad” edges that shortcut the underlying manifold.
Throughout this paper we assumed that the projections are centered, but in practice the projections may be shifted with unknown, though usually small, shifts. The problem of finding both the beaming directions and the shifts was considered in [2, 3]. We remark that we can still use the diffusion map framework by associating similarity weights wij with the translational-invariant distances dij that are given by
where Tτ is the translation operator over satisfying Tτf(x) = f(x + τ), and Ri denotes the noisy version of Rθif. These distances factor out the single degree of freedom associated with translations so that diffusion maps should recover the correct parameterizations of the closed curve as before. Moreover, if the shift of projection Ri is , then the relative shift of projections Ri and Rj is τi – τj, which can be estimated from computing
After the diffusion map step, but prior to reconstruction, the shifts τis can be estimated by solving an overdetermined least squares problem of the form τi – τj = τij for all (i, j) with similar beaming directions θi and θj (as estimated by the diffusion map).
Finally, we note that better reconstructions can be achieved by regularizing the inverse Radon transform (Step 5). The reconstruction problem can be viewed as finding the original function f from its projections Rθf. So once the beaming directions are estimated, this can be cast as an overdetermined linear system of the form Ax = b, where the operator A is the Radon projection operator, x relates to the function f, and b are the Radon samples. One way to reconstruct would be to minimize (least squares method), and this can be done efficiently using conjugate gradient iterations, where the matrices A (projection) and AT (backprojection) can be applied quickly using the slice-theorem and the nonuniform FFT algorithm of Dutt and Rokhlin [14]. It is also possible to add a regularization term of the form , where is the wavelet transform and μ > 0 is the regularization parameter. This will encourage the reconstruction to have a sparse representation in the wavelet basis.
Acknowledgments
The authors would like to thank Yoel Shkolnisky for providing them with his code and for subsequent useful discussions. H.-T. Wu also thanks Ingrid Daubechies for her encouragement and support. The authors thank the associate editor and the anonymous reviewers for their many useful comments and suggestions.
The work of this author was partially supported by award DMS-0914892 from the NSF, by award FA9550-09-1-0551 from AFOSR, by award R01GM090200 from the National Institute of General Medical Sciences, and by the Alfred P. Sloan Foundation.
This author's work was supported by FHWA grant DTFH61-08-C-00028.
Appendix A
Proof of Proposition 2.1
Suppose is a function like f that vanishes outside the unit disk. Clearly, Rθh vanishes outside the interval [–1, 1] since h vanishes outside the unit disk. The fact that implies that Rθh is in L2([–1, 1]), since Cauchy–Schwarz inequality gives the following estimate:
That is,
| (A.1) |
In fact, it can be similarly shown that
that is, (see, e.g., [15, Proposition 6.6.2, p. 214]), but we do not need this finer estimate here.
Continuous functions that vanish outside the unit disk are dense in L2(B1), where B1 denotes the unit disk. Therefore, for any ε > 0, we can find a continuous function g that vanishes outside B1 such that . From the linearity of the Radon transform and the estimate (A.1) we get
| (A.2) |
Since g is a continuous function and the unit disk is compact, g is uniformly continuous and there exists δ > 0 such that |g(x) – g(y)| < ε for all x, y ∈ B1 satisfying ∥x – y∥ < δ.
Suppose that θ2, θ1 ∈ S1 satisfy ∥θ2 – θ1∥ < δ. Then, for s2 + r2 ≤ 1, we have
Therefore,
The triangle inequality thus gives
for all s ∈ [–1, 1]. Hence,
| (A.3) |
From (A.2), (A.3), and the triangle inequality, we get that
whenever ∥θ2 – θ1∥ < δ. This shows that
| (A.4) |
Footnotes
Received by the editors July 2, 2009; accepted for publication (in revised form) September 4, 2012; published electronically February 5, 2013. http://www.siam.org/journals/siims/6-1/76465.html
In some situations errors can be correlated; in such cases, a standard procedure consists of prewhitening the noise prior to the PCA step. Notice that the noise is not assumed to be Gaussian, just white. Later on, in subsections 4.3 and 4.4 we also require the noise to have finite fourth moments.
Finding the probability density of x given noisy samples y1, . . . , yn is a deconvolution problem (assuming knowledge of the distribution of noise, e.g., Gaussian noise). This high-dimensional deconvolution problem is ill-conditioned, especially for Gaussian noise; see [16]. We remark that in cases where it may be possible to estimate and use higher (than second) order moments of x, but we do not pursue this possibility here.
The MATLAB code is freely available from Nadler's website at http://www.wisdom.weizmann.ac.il/~nadler/Rank_Estimation/rank_estimation.html.
Since there is a single intersection, it is possible to “traverse” the curve in two different ways, giving rise to two different viewing direction orderings. The user may still be able to correctly choose between the two possibilities, either automatically by using multiway clustering methods [8], or manually by examining the two resulting reconstructions.
For large values of n and p, even the SVD may be computationally infeasible. In such cases we recommend using the recently proposed randomized algorithms for computing the SVD; see [19] for a comprehensive review of such methods.
Each of the two PCAs may give a slightly different estimate for the noise variance. We therefore estimate the noise variance by averaging the two estimators. Alternatively, the noise variance can be estimated using the boundary pixels.
REFERENCES
- 1.Baik J, Silverstein JW. Eigenvalues of large sample covariance matrices of spiked population models. J. Multivariate Anal. 2006;97:1382–1408. [Google Scholar]
- 2.Basu S, Bresler Y. Feasibility of tomography with unknown view angles. IEEE Trans. Image Process. 2000;9:1107–1122. doi: 10.1109/83.846252. [DOI] [PubMed] [Google Scholar]
- 3.Basu S, Bresler Y. Uniqueness of tomography with unknown view angles. IEEE Trans. Image Process. 2000;9:1094–1106. doi: 10.1109/83.846251. [DOI] [PubMed] [Google Scholar]
- 4.Belkin M, Niyogi P. Proceedings of the 18th Conference on Learning Theory (COLT), Lecture Notes in Comput. Sci. 3559. Springer-Verlag; Berlin: 2005. Towards a theoretical foundation for Laplacian-based manifold methods; pp. 486–500. [Google Scholar]
- 5.Belkin M, Niyogi P. Convergence of Laplacian eigenmaps, in Advances in Neural Information Processing Systems 19. The MIT Press; Cambridge, MA: 2007. pp. 129–136. [Google Scholar]
- 6.Benaych-Georges F, Nadakuditi RR. The eigenvalues and eigenvectors of finite, low rank perturbations of large random matrices. Adv. Math. 2011;227:494–521. [Google Scholar]
- 7.Bickel PJ, Levina E. Covariance regularization by thresholding. Ann. Statist. 2008;36:2577–2604. [Google Scholar]
- 8.Chen G, Lerman G. Spectral curvature clustering (SCC) Int. J. Comput. Vision. 2009;81:317–330. [Google Scholar]
- 9.Coddington EA, Levinson N. Theory of Ordinary Differential Equations. Krieger; Malabar, FL: 1984. [Google Scholar]
- 10.Coifman RR, Donoho D. Wavelets and Statistics, Lecture Notes in Statist. Vol. 103. Springer-Verlag; New York: 1995. Translation-invariant de-noising; pp. 125–150. [Google Scholar]
- 11.Coifman RR, Lafon S. Diffusion maps. Appl. Comput. Harmon. Anal. 2006;21:5–30. [Google Scholar]
- 12.Coifman RR, Shkolnisky Y, Sigworth FJ, Singer A. Graph Laplacian tomography from unknown random projections. IEEE Trans. Image Process. 2008;17:1891–1899. doi: 10.1109/TIP.2008.2002305. [DOI] [PubMed] [Google Scholar]
- 13.Deans SR. The Radon Transform and Some of Its Applications. Krieger; Malabar, FL: 1993. [Google Scholar]
- 14.Dutt A, Rokhlin V. Fast Fourier transforms for nonequispaced data. SIAM J. Sci. Comput. 1993;14:1368–1393. [Google Scholar]
- 15.Epstein CL. Introduction to the Mathematics of Medical Imaging. Pearson Education; Upper Saddle River, NJ: 2003. [Google Scholar]
- 16.Fan J. On the optimal rates of convergence for nonparametric deconvolution problems. Ann. Statist. 1991;19:1257–1272. [Google Scholar]
- 17.Frank J. Three-Dimensional Electron Microscopy of Macromolecular Assemblies: Visualization of Biological Molecules in Their Native State. 2nd ed. Oxford University Press; New York: 2006. [Google Scholar]
- 18.Goldberg DS, Roth FP. Assessing experimentally derived interactions in a small world. Proc. Natl. Acad. Sci. USA. 2003;100:4372–4376. doi: 10.1073/pnas.0735871100. [DOI] [PMC free article] [PubMed] [Google Scholar]
- 19.Halko N, Martinsson PG, Tropp JA. Finding structure with randomness: Probabilistic algorithms for constructing approximate matrix decompositions. SIAM Rev. 2011;53:217–288. [Google Scholar]
- 20.Hein M, Audibert J, von Luxburg U. Proceedings of the 18th Conference on Learning Theory (COLT), Lecture Notes in Comput. Sci. 3559. Springer-Verlag; Berlin, Heidelberg: 2005. From graphs to manifolds—weak and strong pointwise consistency of graph Laplacians; pp. 470–485. [Google Scholar]
- 21.Humphries MD, Gurney K. Network ‘small-world-ness’: A quantitative method for determining canonical network equivalence. PLoS ONE. 2008;3:e0002051. doi: 10.1371/journal.pone.0002051. [DOI] [PMC free article] [PubMed] [Google Scholar]
- 22.Johnstone IM. Proceedings of the International Congress of Mathematicians, Madrid, Spain, 2006. European Mathematical Society Publishing House; Zurich: 2007. High dimensional statistical inference and random matrices; pp. 307–333. [Google Scholar]
- 23.Johnstone IM, Lu AY. On consistency and sparsity for principal components analysis in high dimensions. J. Amer. Statist. Assoc. 2009;104:682–693. doi: 10.1198/jasa.2009.0121. [DOI] [PMC free article] [PubMed] [Google Scholar]
- 24.Kak AC, Slaney M. Principles of Computerized Tomographic Imaging. SIAM; Philadelphia: 2001. [Google Scholar]
- 25.Kritchman S, Nadler B. Determining the number of components in a factor model from limited noisy data. Chem. Intell. Lab. Syst. 2008;94:19–32. [Google Scholar]
- 26.Kritchman S, Nadler B. Non-parametric detection of the number of signals, hypothesis testing and random matrix theory. IEEE Trans. Signal Process. 2009;57:3930–3941. [Google Scholar]
- 27.Lafon S. Ph.D. thesis. Yale University; New Haven, CT: 2004. Diffusion Maps and Geometric Harmonics. [Google Scholar]
- 28.MacKay DJC. Information Theory, Inference and Learning Algorithms. Cambridge University Press; Cambridge, UK: 2004. [Google Scholar]
- 29.Nadakuditi RR, Benaych-Georges F. The breakdown point of signal subspace estimation. 2010 IEEE Sensor Array and Multichannel Signal Processing Workshop (SAM) 2010:177–180. [Google Scholar]
- 30.Nadler B. Finite sample approximation results for principal component analysis: A matrix perturbation approach. Ann. Statist. 2008;36:2791–2817. [Google Scholar]
- 31.Natterer F. The Mathematics of Computerized Tomography. SIAM; Philadelphia: 2001. [Google Scholar]
- 32.Natterer F, Wübbeling F. Mathematical Methods in Image Reconstruction. SIAM; Philadelphia: 2001. [Google Scholar]
- 33.Paul D. Asymptotics of sample eigenstructure for a large dimensional spiked covariance model. Statist. Sinica. 2007;17:1617–1642. [Google Scholar]
- 34.Pearson K. On lines and planes of closest fit to systems of points in space. Philosophical Magazine. 1901;2:559–572. [Google Scholar]
- 35.Reed M, Simon B. Methods of Modern Mathematical Physics, Volume 1, Functional Analysis. Academic Press; San Diego, CA: 1981. [Google Scholar]
- 36.Singer A. From graph to manifold Laplacian: The convergence rate. Appl. Comput. Harmon. Anal. 2006;21:128–134. [Google Scholar]
- 37.Watts DJ, Strogatz SH. Collective dynamics of ‘small-world’ networks. Nature. 1998;393:440–442. doi: 10.1038/30918. [DOI] [PubMed] [Google Scholar]
- 38.Wiener N. Extrapolation, Interpolation, and Smoothing of Stationary Time Series: With Engineering Applications. The MIT Press; Cambridge, MA: 1964. [Google Scholar]


