

Abstract
A hydrogen peroxide (H2O2)-activated cell-penetrating peptide was developed through incorporation of a boronic acid-containing cleavable linker between polycationic cell-penetrating peptide and polyanionic fragments. Fluorescence labeling of the two ends of the molecule enabled monitoring its reaction with H2O2 through release of the highly adhesive cell-penetrating peptide and disruption of fluorescence resonance energy transfer. The H2O2 sensor selectively reacts with endogenous H2O2 in cell culture to monitor the oxidative burst of promyelocytes and in vivo to image lung inflammation. Targeting H2O2 has potential applications in imaging and therapy of diseases related to oxidative stress.
Hydrogen peroxide (H2O2) is a reactive oxygen species (ROS) endogenously produced in living organisms. A growing body of evidence suggests that H2O2 plays an active role in the regulation of various physiological processes.1,2 Nevertheless, its overabundance results in oxidative stress that can lead to extensive cellular damage. Indeed, high levels of H2O2 have been implicated in many pathological conditions including diabetes,3 cardiovascular diseases,4,5 neurodegenerative disorders,6 and cancer.7 Consequently, there is increased interest in the role of H2O2 in normal and pathological conditions, as well as in its potential as a target in directed therapeutics delivery for oxidative stress related diseases. Traditionally, these objectives are pursued separately, through the development of dedicated molecular imaging probes8−11 or drug delivery vehicles.12−14 Current H2O2 imaging agents that are in vivo compatible can only be applied to transgenic animals8,9 or through localized administration,10,11 while drug delivery vehicles aimed at H2O2 require its presence at supranatural concentrations to achieve sufficient activation.12,13 Therefore, progress could be made toward both objectives by developing molecular targeting agents that respond to physiological levels of H2O2 in intact animals, and that could be harnessed with interchangeable cargo according to need.
An activatable cell-penetrating peptide (ACPP) uses a generic targeting mechanism based on selective and local unleashing of a cell-penetrating peptide (CPP).15 It is a hairpin shaped molecule consisting of a polycationic CPP (d-Arg9) and an inhibitory polyanion (d-Glu9) connected through a cleavable linker. When intact, the polyanion neutralizes the polycation and largely masks the adhesiveness of the CPP. Extracellular cleavage of the linker enables dissociation of the inhibitory polyanion from the CPP, releasing the CPP and associated cargo to adhere to and then penetrate into nearby cells. Through appropriate design of linkers, ACPPs have been directed toward extracellular enzymes such as matrix metalloproteinases,16 elastases17 and thrombin,18 enabling in vivo detection of their spatially localized enzymatic activity by various imaging modalities. Thus, ACPPs are broadly applicable tools for concentrating cargo of interest at the site of its activation.
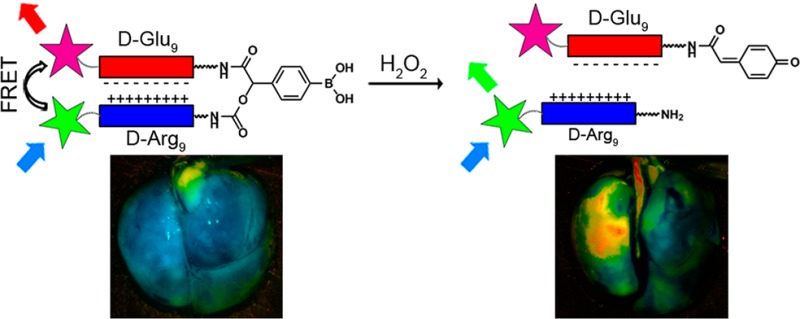
Here, we report the development of H2O2 targeting agents based on ACPPs and demonstrate their ability to selectively image endogenous levels of H2O2 in live cells and in vivo. We envisioned making an ACPP reactive toward H2O2 by incorporation of 4-boronic mandelic acid as a keystone in its linker architecture (Figure 1A). The reaction of a phenylboronic acid with H2O2 to form a phenol19−22 has been extensively utilized to generate a wide range of small-molecule sensors for H2O2.23
Figure 1.
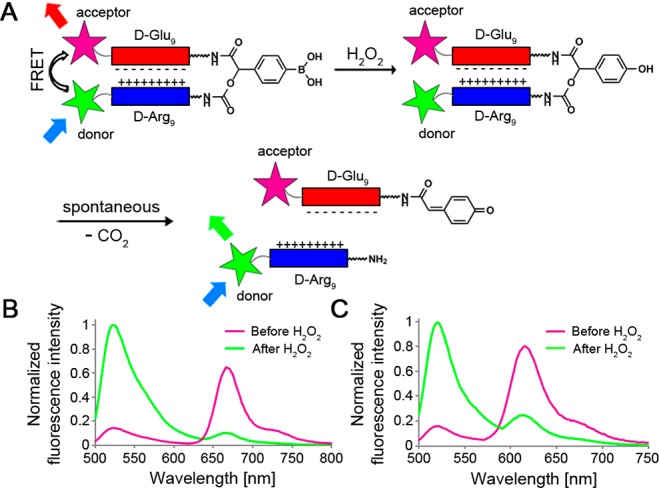
Schematic illustration of H2O2-ACPP structure and its H2O2-triggered fragmentation process. (A) Fluorescence labeling of H2O2-ACPP peptide domains enables visualization of its cleavage through FRET disruption. Shown are the fluorescence emissions of (B) ACPP 1 and (C) ACPP 2 (1 μM each) before (purple) and 20 min after (green) reaction with H2O2 (2 mM).
In our design, oxidation of the boronic acid by H2O2 will form a phenolate that will subsequently undergo a spontaneous 1,6-elimination, resulting in fragmentation of the ACPP and release of the CPP domain. Visualization of the ACPP’s reaction with H2O2 could be facilitated by fluorescent labeling of both of its peptide domains. The close proximity enforced by the hairpin structure should lead to fluorescence resonance energy transfer (FRET), which would be disrupted by H2O2-mediated cleavage.
In line with the design presented in Figure 1A, ACPP 1 (Figure S1, Supporting Information (SI)) was prepared through a combination of in-solution and solid-phase synthesis (Schemes S1 and S2 (SI)). The polycationic and polyanionic domains of 1 were labeled with fluorescein (donor) and Cy5 (acceptor), respectively. When intact, ACPP 1 produces strong FRET, as evident by low emission from the donor (fluorescein, ∼524 nm) and strong re-emission from the acceptor (Cy5, ∼670 nm) (Figure 1B). Cleavage of the ACPP by H2O2 leads to disruption of the FRET, which could be visualized through the increase in donor emission (∼6-fold) and decrease in the acceptor re-emission (∼7-fold). The combined ∼40-fold ratio change is comparable with our previously reported FRET-ACPPs24 and should provide a sufficient dynamic range to differentiate between H2O2 levels. To test whether other donor/acceptor pairs are permissible in this design, we synthesized ACPP 2 (Figure S1 and Scheme S3 (SI)), where fluorescein and Cy5 were replaced with Alexa488 and Alexa594, respectively. Similar to ACPP 1, ACPP 2 showed efficient FRET that was disrupted in the presence of H2O2 (Figure 1C).
Under normal physiological conditions, H2O2, although diffusible, forms a concentration gradient across cellular membranes,25,26 with an intracellular concentration estimated at 0.5–7 × 10⁻⁷ M27,28 and an extracellular concentration that is ∼10-fold higher.29 In pathological conditions, local extracellular concentrations of H2O2 are additionally elevated to as high as 10–50 μM.30−35 Therefore, to effectively target extracellular H2O2, a sensitivity level in the low micromolar range is required. To determine its lowest detection limit, ACPP 1 (1 μM) was incubated with increasing concentration of H2O2 (0–250 μM) and fluorescence emissions at 524 vs 672 nm (λex = 488 nm) were monitored over 20 min. The FRET ratio change (R/R0) was calculated by dividing the ratio of 524/672 nm emissions at each time-point (R) by the ratio before H2O2 addition (R0). This assay established a linear dependence of ACPP 1’s FRET ratio change on H2O2 concentration (R2 = 0.9962) in a physiologically relevant range, with a detection limit of ∼5 μM (Figures 2A and S2 (SI)).
Figure 2.
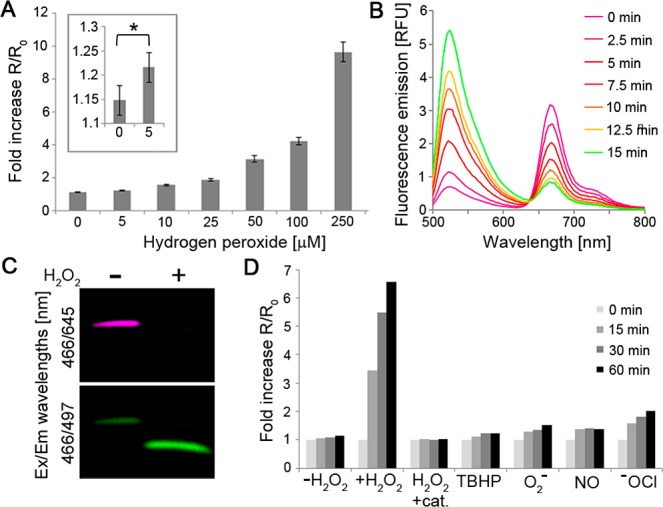
Selective and concentration-dependent cleavage of ACPP 1 by H2O2. (A) Fold increase in fluorescein/Cy5 emission ratio (524/672 nm) after 20 min incubation of ACPP 1 (1 μM) with indicated concentrations of H2O2. Error bars represent ± standard deviation. *p < 0.05. (B) Time course fluorescence emission spectra of ACPP 1 (1 μM) in the presence of H2O2 (1 mM). (C) H2O2-dependent cleavage of ACPP 1 (1 μM) after 30 min incubation with 1 mM H2O2. (D) Fold increase in fluorescein/Cy5 emission ratio at indicated times of ACPP 1 (1 μM) with indicated ROS or their donors (100 μM, catalase 0.5 mg/mL).
The changes in FRET could be monitored in real-time (Figures 2B and S3 (SI)), and cleavage of the ACPP was further confirmed by SDS-polyacrylamide gel electrophoresis (PAGE) (Figure 2C) and by high-performance liquid chromatography mass spectrometry (HPLC–MS) (Figure S4 (SI)). To verify that the observed FRET change is not due to nonspecific peptide cleavage or damage to the fluorophores, we synthesized ACPP 3 (Figure S1 and Scheme S4 (SI)), an uncleavable version of 1, in which the boronic acid-containing linker was replaced with a polyethylene glycol-6 (PEG6) molecule. No ratio change was observed when the uncleavable ACPP 3 (1 μM) was incubated with H2O2 (2 mM) over a period of 60 min (Figure S3 (SI)).
The response of ACPP 1 to H2O2 requires the occurrence of the following three consecutive steps: reaction of the boronic acid with H2O2 to form a phenolate, 1,6-elimination and dissociation of the polypeptides from one another. The linear dependency of the FRET change on H2O2 concentration suggests that the boronic acid oxidation is the rate-limiting step. We therefore explored the kinetics of this process by measuring its second-order rate constant (1 μM ACPP 1 and 1, 2.5, and 5 mM H2O2, Figure S5 (SI)) to find k = 1.34 ± 0.13 M–1 s–1, in agreement with previously reported results.8 We then evaluated the selectivity of the H2O2-ACPP to H2O2 over other biologically relevant extracellular ROS. For this, ACPP 1 (1 μM) was incubated with various ROS (100 μM), and the FRET ratio change was monitored for 60 min. A time-dependent increase in the FRET ratio was observed when ACPP 1 was treated with H2O2 (∼6-fold over 60 min). In contrast, other ROS, or H2O2 in the presence of catalase, had little to no effect on the FRET ratio (Figure 2D). Taken together, these results establish that H2O2-ACPP selectively reacts with physiological levels of H2O2 in a concentration-dependent manner, culminating in fragmentation of the ACPP and release of its CPP domain.
Next, we explored whether H2O2-ACPP could be used to detect H2O2 in the cellular environment. Initial experiments in which ACPP 1 (1 μM) was treated with exogenous H2O2 (10–125 μM) in the presence of HL-60 cells, a human promyelocytic leukemia cell line, demonstrated an increase in FRET ratio with linear dependency on the applied H2O2 concentration (Figures 3A and S6 (SI), R2 = 0.9947).
Figure 3.
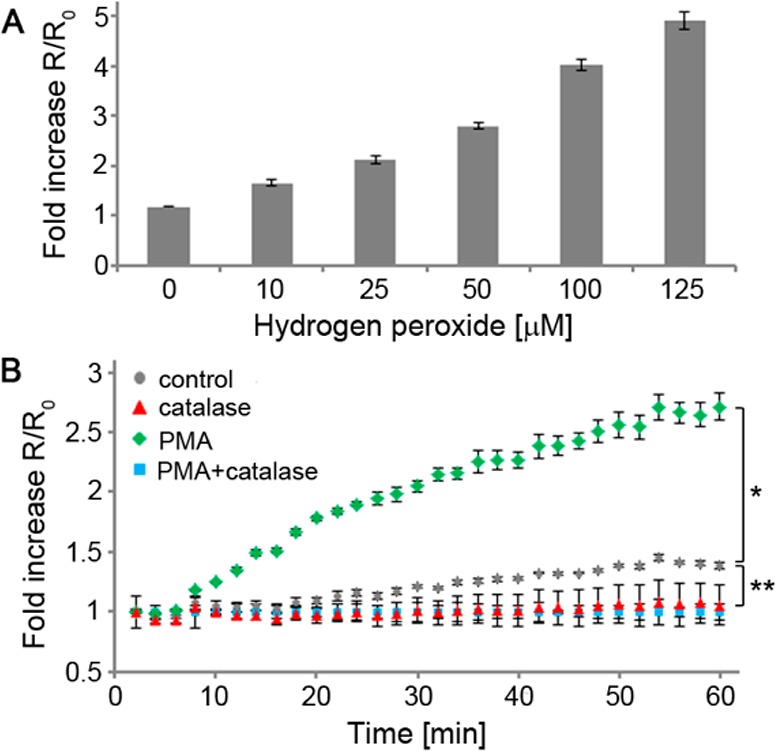
Detection of H2O2 by ACPP 1 in cellular environment. (A) Fold increase in fluorescein/Cy5 emission ratio (524/672 nm) after 30 min of ACPP 1 (1 μM) upon exogenous addition of H2O2 at indicated concentration in the presence of HL-60 cells. Error bars represent ± standard deviation. (B) Time course of fold increase in fluorescein/Cy5 emission ratio (524/672 nm) of ACPP 1 (1 μM) incubated with HL-60 cells at the indicated conditions (catalase 0.5 mg/mL, PMA 0.5 μM). Error bars represent ± standard deviation. *p < 1 × 10⁻¹⁰, **p < 1 × 10⁻⁴.
We then tested the ACPP’s ability to detect endogenous levels of H2O2. HL-60 cells express both membrane and cytoplasmic NADPH oxidase (NOX) subunits. Exposure of these cells to stimulants such as calcimycin, opsonized zymosan, or phorbol 12-myristate-13-acetate (PMA) triggers assembly of functional NOX on the cellular membrane and generation of superoxide,36 which is converted to various ROS including H2O2.37 NOX activity is the main source of ROS generation in the oxidative burst mechanism of immune cells. When HL-60 cells were treated with ACPP 1 (1 μM) and either stimulated with PMA (0.5 μM) or not, a time-dependent increase in FRET ratio was observed in the stimulated cells (Figure 3B).
Using the FRET ratio change from the exogenous H2O2 application experiment as a calibration curve (Figure S5 (SI)), we calculated that under the aforementioned conditions, PMA-stimulated HL-60 cells generate H2O2 at a rate of 0.98 ± 0.05 nmol/104 cells/h, in agreement with previously reported measurements.35,38 Conversely, addition of catalase (0.5 mg/mL) to PMA-stimulated cells completely suppressed the ratio change. Interestingly, nonstimulated HL-60 cells exhibited a slight, but statistically significant (p < 0.0001), increase in ratio compared to catalase-treated cells, whether PMA-stimulated or not, suggesting that nonstimulated cells produce a basal level of H2O2. The rate of H2O2 production by nonstimulated cells was calculated to be 0.050 ± 0.004 nmol/104 cells/h, about 20-fold lower than PMA-stimulated cells. These results demonstrate that H2O2-ACPP has sufficient sensitivity to detect endogenously produced H2O2 in the cellular environment.
Finally, we investigated the potential of H2O2-ACPP to detect H2O2 endogenously produced by activated macrophages and neutrophils, in a lipopolysaccharide (LPS) model of lung inflammation. For this, C57BL/6 mice were either treated (LPS) or not (control) with 10 μg of LPS by intranasal (i.n.) administration for four consecutive days.39 Recruitment of inflammatory cells to the airways of mice treated with LPS was confirmed by hematoxylin and eosin staining (Figure S7 (SI)). Mice were then administered ACPP 1 i.n. (10 nmol), and after 6 h, lungs were harvested, inflated, and imaged for the fluorescein/Cy5 emission ratio. Lungs of LPS-treated mice presented ∼2-fold increase in fluorescein/Cy5 emission ratio compared to control (Figure 4A,B).
Figure 4.
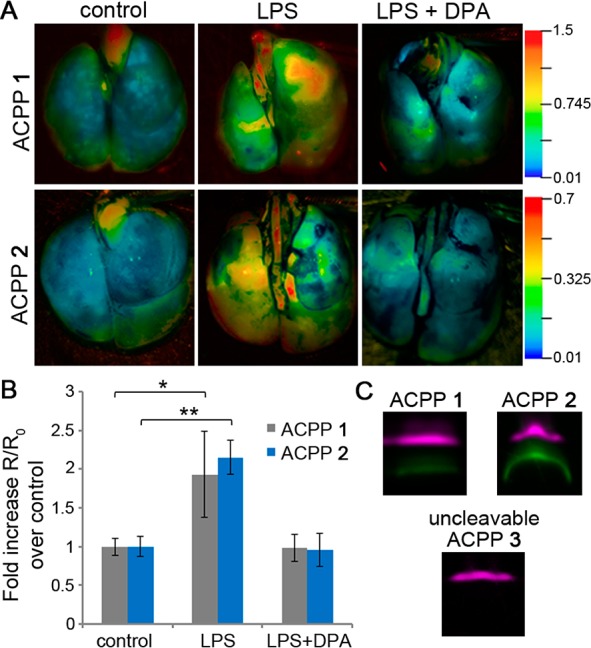
In vivo targeting of H2O2 by ACPPs 1 and 2. (A) Representative ratiometric fluorescent images of fluorescein/Cy5 (ACPP 1) or Alexa488/594 (ACPP 2) emission ratios of mouse lungs in the indicated conditions treated with ACPP 1 (10 nmol) or ACPP 2 (5 nmol) for 6 h. Right: scales of appropriate emission ratios. (B) Mean change in ratios of images presented in (A) with additional animals (n = 5). Error bars represent ± standard deviation. *p < 0.05, **p < 0.005. (C) SDS-PAGE analysis of lung extracts from LPS-mice treated with ACPPs 1–3 for 6 h. Bands were pseudocolored according to their emission spectra (Figure S9 (SI)): intact ACPP (purple) or cleaved ACPP (green).
To test whether H2O2 contributed to the observed increase in ratio, LPS-treated mice were given d-penicillamine (DPA, 1 μmol), a H2O2 scavenger,40−42 5 min prior to ACPP 1 administration. In our in vitro studies, DPA completely inhibited the reaction between ACPP 1 and H2O2 (Figure S8 (SI)). Lungs of LPS- and DPA-treated mice showed a decreased fluorescein/Cy5 emission ratio, at least as low as control mouse lungs. Cleavage of ACPP 1 in lungs of LPS-treated mice was confirmed by SDS-PAGE analysis of homogenized lung extracts (Figure 4C). In contrast, when similar mice were treated with uncleavable ACPP 3, no cleavage products were observed. We repeated the experiments described above with ACPP 2. Results were consistent with those observed with ACPP 1; i.e., lungs of LPS-treated mice showed ∼2-fold increase in ratio (Alexa488/Alexa594 emission) that was completely suppressed by DPA (Figure 4A–C), suggesting that H2O2-ACPP is a platform that can accommodate a range of fluorophores. Taken together, these results suggest that H2O2-ACPP can target and respond to endogenous levels of H2O2 produced in a model of lung inflammation in vivo.
In conclusion, we developed a H2O2 targeting mechanism based on activatable cell-penetrating peptides (H2O2-ACPP). Fluorescence labeling of the H2O2-ACPP enabled visualization of its reaction with H2O2 through FRET disruption. The H2O2-ACPP reacts selectively and in a concentration-dependent manner with H2O2 to release its CPP domain, whose adhesiveness and nondiffusibility preserve spatial resolution. Its low micromolar sensitivity enabled detection and quantification of H2O2 secreted by activated HL-60 cells. Moreover, H2O2-ACPP was sensitive enough to react with endogenous levels of H2O2 in an in vivo model of lung inflammation. Developing ACPPs for H2O2 targeting will potentially enable its imaging by a variety of modalities, including fluorescence, magnetic resonance, and radioactive techniques. Importantly, a similar targeting mechanism could be further used for directed delivery of therapeutics to local sites of oxidative stress related diseases.
Acknowledgments
The authors thank Qing Xiong and Larry Gross for technical assistance and to all other lab members for helpful discussions. This work was supported by the Howard Hughes Medical Institute, National Institute of Health (NIH) Grant 5R01CA158448-02 and Department of Defense (DoD) Grant W81XWH-09-1-0699 (to R.Y.T.), NIH Training Grant 5R25CA153915-03 (to R.W. and C.N.F.), American Asthma Foundation Grant 11-0321 and NIH 1F30HL118998-01 (to C.N.F.).
Supporting Information Available
Experimental details, synthetic procedures, characterization methods, molecules structures, and figures. This material is available free of charge via the Internet at http://pubs.acs.org.
The authors declare the following competing financial interest(s): R. Y. Tsien is a scientific advisor to Avelas Biosiences, which has licensed the ACPP technology from University of California Regents. All the other authors declare no competing financial interests.
Funding Statement
National Institutes of Health, United States
Supplementary Material
References
- D’Autreaux B.; Toledano M. B. Nat. Rev. Mol. Cell Biol. 2007, 8, 813. [DOI] [PubMed] [Google Scholar]
- Veal E. A.; Day A. M.; Morgan B. A. Mol. Cell 2007, 26, 1. [DOI] [PubMed] [Google Scholar]
- Houstis N.; Rosen E. D.; Lander E. S. Nature 2006, 440, 944. [DOI] [PubMed] [Google Scholar]
- Touyz R. M.; Schiffrin E. L. Histochem. Cell Biol. 2004, 122, 339. [DOI] [PubMed] [Google Scholar]
- Cai H. Cardiovasc. Res. 2005, 68, 26. [DOI] [PubMed] [Google Scholar]
- Barnham K. J.; Masters C. L.; Bush A. I. Nat. Rev. Drug Discovery 2004, 3, 205. [DOI] [PubMed] [Google Scholar]
- Reuter S.; Gupta S. C.; Chaturvedi M. M.; Aggarwal B. B. Free Radical Biol. Med. 2010, 49, 1603. [DOI] [PMC free article] [PubMed] [Google Scholar]
- Van de Bittner G. C.; Dubikovskaya E. A.; Bertozzi C. R.; Chang C. J. Proc. Natl. Acad. Sci. U. S. A. 2010, 107, 21316. [DOI] [PMC free article] [PubMed] [Google Scholar]
- Van de Bittner G. C.; Bertozzi C. R.; Chang C. J. J. Am. Chem. Soc. 2013, 135, 1783. [DOI] [PMC free article] [PubMed] [Google Scholar]
- Lee D.; Khaja S.; Velasquez-Castano J. C.; Dasari M.; Sun C.; Petros J.; Taylor W. R.; Murthy N. Nat. Mater. 2007, 6, 765. [DOI] [PubMed] [Google Scholar]
- Karton-Lifshin N.; Segal E.; Omer L.; Portnoy M.; Satchi-Fainaro R.; Shabat D. J. Am. Chem. Soc. 2011, 133, 10960. [DOI] [PubMed] [Google Scholar]
- de Gracia Lux C.; Joshi-Barr S.; Nguyen T.; Mahmoud E.; Schopf E.; Fomina N.; Almutairi A. J. Am. Chem. Soc. 2012, 134, 15758. [DOI] [PMC free article] [PubMed] [Google Scholar]
- Liu J.; Pang Y.; Zhu Z.; Wang D.; Li C.; Huang W.; Zhu X.; Yan D. Biomacromolecules 2013, 14, 1627. [DOI] [PubMed] [Google Scholar]
- Kuang Y.; Balakrishnan K.; Gandhi V.; Peng X. J. Am. Chem. Soc. 2011, 133, 19278. [DOI] [PMC free article] [PubMed] [Google Scholar]
- Jiang T.; Olson E. S.; Nguyen Q. T.; Roy M.; Jennings P. A.; Tsien R. Y. Proc. Natl. Acad. Sci. U. S. A. 2004, 101, 17867. [DOI] [PMC free article] [PubMed] [Google Scholar]
- Olson E. S.; Jiang T.; Aguilera T. A.; Nguyen Q. T.; Ellies L. G.; Scadeng M.; Tsien R. Y. Proc. Natl. Acad. Sci. U. S. A. 2010, 107, 4311. [DOI] [PMC free article] [PubMed] [Google Scholar]
- Whitney M.; Crisp J. L.; Olson E. S.; Aguilera T. A.; Gross L. A.; Ellies L. G.; Tsien R. Y. J. Biol. Chem. 2010, 285, 22532. [DOI] [PMC free article] [PubMed] [Google Scholar]
- Whitney M.; Savariar E. N.; Friedman B.; Levin R. A.; Crisp J. L.; Glasgow H. L.; Lefkowitz R.; Adams S. R.; Steinbach P.; Nashi N.; Nguyen Q. T.; Tsien R. Y. Angew. Chem., Int. Ed. Engl. 2013, 52, 325. [DOI] [PMC free article] [PubMed] [Google Scholar]
- Ainley A. D.; Challenger F. J. Chem. Soc. 1930, 2171. [Google Scholar]
- Kuivila H. G. J. Am. Chem. Soc. 1954, 76, 870. [Google Scholar]
- Kuivila H. G.; Armour A. G. J. Am. Chem. Soc. 1957, 79, 5659. [Google Scholar]
- Chang M. C. Y.; Pralle A.; Isacoff E. Y.; Chang C. J. J. Am. Chem. Soc. 2004, 126, 15392. [DOI] [PMC free article] [PubMed] [Google Scholar]
- Lippert A. R.; De Bittner G. C. V.; Chang C. J. Acc. Chem. Res. 2011, 44, 793. [DOI] [PMC free article] [PubMed] [Google Scholar]
- Savariar E. N.; Felsen C. N.; Nashi N.; Jiang T.; Ellies L. G.; Steinbach P.; Tsien R. Y.; Nguyen Q. T. Cancer Res. 2013, 73, 855. [DOI] [PMC free article] [PubMed] [Google Scholar]
- Antunes F.; Cadenas E. FEBS Lett. 2000, 475, 121. [DOI] [PubMed] [Google Scholar]
- Seaver L. C.; Imlay J. A. J. Bacteriol. 2001, 183, 7182. [DOI] [PMC free article] [PubMed] [Google Scholar]
- Lennon S. V.; Martin S. J.; Cotter T. G. Cell Proliferation 1991, 24, 203. [DOI] [PubMed] [Google Scholar]
- Antunes F.; Cadenas E. Free Radical Biol. Med. 2001, 30, 1008. [DOI] [PubMed] [Google Scholar]
- Kulagina N. V.; Michael A. C. Anal. Chem. 2003, 75, 4875. [DOI] [PubMed] [Google Scholar]
- Behl C.; Davis J. B.; Lesley R.; Schubert D. Cell 1994, 77, 817. [DOI] [PubMed] [Google Scholar]
- Hyslop P. A.; Zhang Z.; Pearson D. V.; Phebus L. A. Brain Res. 1995, 671, 181. [DOI] [PubMed] [Google Scholar]
- Horoz M.; Bolukbas C.; Bolukbas F. F.; Aslan M.; Koylu A. O.; Selek S.; Erel O. BMC Infect. Dis. 2006, 6, 114. [DOI] [PMC free article] [PubMed] [Google Scholar]
- Sznajder J. I.; Fraiman A.; Hall J. B.; Sanders W.; Schmidt G.; Crawford G.; Nahum A.; Factor P.; Wood L. D. Chest 1989, 96, 606. [DOI] [PubMed] [Google Scholar]
- Suematsu M.; Schmid-Schonbein G. W.; Chavez-Chavez R. H.; Yee T. T.; Tamatani T.; Miyasaka M.; Delano F. A.; Zweifach B. W. Am. J. Physiol. 1993, 264, H881. [DOI] [PubMed] [Google Scholar]
- Szatrowski T. P.; Nathan C. F. Cancer Res. 1991, 51, 794. [PubMed] [Google Scholar]
- Teufelhofer O.; Weiss R. M.; Parzefall W.; Schulte-Hermann R.; Micksche M.; Berger W.; Elbling L. Toxicol. Sci. 2003, 76, 376. [DOI] [PubMed] [Google Scholar]
- Babior B. M. Blood 1999, 93, 1464. [PubMed] [Google Scholar]
- Test S. T.; Weiss S. J. J. Biol. Chem. 1984, 259, 399. [PubMed] [Google Scholar]
- Starkhammar M.; Kumlien Georen S.; Swedin L.; Dahlen S. E.; Adner M.; Cardell L. O. PLoS One 2012, 7, e32110. [DOI] [PMC free article] [PubMed] [Google Scholar]
- Winterbourn C. C.; Metodiewa D. Free Radical Biol. Med. 1999, 27, 322. [DOI] [PubMed] [Google Scholar]
- Ledson M. J.; Bucknall R. C.; Edwards S. W. Ann. Rheum. Dis. 1992, 51, 321. [DOI] [PMC free article] [PubMed] [Google Scholar]
- Sanderud J.; Oroszlan G.; Bjoro K.; Kumlin M.; Saugstad O. D. J. Perinat. Med. 1995, 23, 385. [DOI] [PubMed] [Google Scholar]
Associated Data
This section collects any data citations, data availability statements, or supplementary materials included in this article.