

Abstract
Purpose
The monocarboxylate transporter 1 (MCT1) inhibitor AZD3965 is undergoing Phase I evaluation in the UK. AZD3965 is proposed, via lactate transport modulation, to kill tumor cells reliant on glycolysis. We investigated the therapeutic potential of AZD3965 in small cell lung cancer (SCLC) seeking rationale for clinical testing in this disease and putative predictive biomarkers for trial use.
Experimental Design
AZD3965 sensitivity was determined for 7 SCLC cell lines, in normoxia and hypoxia, and for a tumor xenograft model. Proof of mechanism was sought via changes in intracellular/tumor lactate. Expression of MCT1 and related transporter MCT4 were assessed by western blot. Drug resistance was investigated via MCT4 siRNAi and overexpression. The expression and clinical significance of MCT1 and MCT4 were explored in a tissue microarray from 78 SCLC patients.
Results
AZD3965 sensitivity varied in vitro and was highest in hypoxia. Resistance in hypoxia was associated with increased MCT4 expression. In vivo, AZD3965 reduced tumor growth and increased intra-tumor lactate. In the tissue microarray, high MCT1 expression was associated with worse prognosis (p=0.014). MCT1 and hypoxia marker CA IX expression in the absence of MCT4 was observed in 21% of SCLC tumors.
Conclusions
This study provides a rationale to test AZD3965 in SCLC patients. Our results suggest that patients with tumors expressing MCT1 and lacking in MCT4 are most likely to respond.
Introduction
Small cell lung cancer (SCLC), the most aggressive type of lung cancer, accounts for ~15% of lung cancer cases and is responsible for 25% of lung cancer-related deaths (1). Patients frequently present with widespread metastatic disease. Despite initial sensitivity to platinum-etoposide combination therapy, SCLC patients commonly relapse with progressive chemoresistant disease (2, 3). Despite some progress in characterizing the genetic landscape of SCLC (4-6), this has yet to translate to advances in targeted treatments (7) and there remains pressing need for new approaches to improve outcomes for SCLC patients.
One promising approach gaining considerable momentum in oncology per se exploits altered tumor metabolism, now considered a hallmark of cancer (8). SCLC is a prime example of a tumor type likely to be reliant on glycolysis. It has a rapid doubling time (9) indicative of a high rate of cell division and SCLC tumors often contain regions of hypoxia (10), driving obligate glycolysis (11). SCLC tumors are fluorodeoxyglucose (FDG) avid by positron emission tomography scan (12), consistent with a high uptake of glucose and a glycolytic phenotype. Also, TP53 is frequently mutated and MYC genes are commonly amplified (13). These genes are both associated with a metabolic switch from aerobic respiration to aerobic glycolysis (14, 15).
AZD3965 is an orally bioavailable, monocarboxylate transporter 1 specific inhibitor, derived from AR-C155858 (16). The monocarboxylate transporter (MCT) proteins MCT1 and MCT4 are primarily involved in lactate transport (17) and inhibition of MCTs has been proposed to selectively target highly glycolytic cancer cells (18). Previous studies have demonstrated that MCT1 RNA interference causes cell death in glioma cell lines (19) whilst the non-selective MCT inhibitor CHC inhibits colorectal cancer xenograft growth (20). Furthermore, the specific MCT1/2 inhibitor AR-C155858 impaired proliferation/survival of RAS transformed fibroblasts in vitro and in vivo (21).
MCT1 inhibition has yet to be tested in SCLC. Here we report on preclinical evaluation of AZD3965 including the effect of expression of the alternative lactate transporter MCT4. Expression and clinical significance of MCT1 and MCT4 expression in SCLC patients is also assessed as a prelude to further clinical development in this disease.
Materials and Methods
Cell Culture and Drugs
NCI-H1048, NCI-H526, NCI-H524, NCI-H146, NCI-H82, DMS114, DMS79, MDA-MB-231, SKOV-3, K562 (American Type Culture Collection) and COR-L103 (Prof. Anne White) were cultured in RPMI 1640 media (Life Technologies) supplemented with 10% FBS (Biowest). Lenti-X™ 293T (Clontech) were cultured according to manufacturer’s instructions. All cells were maintained in a humidified atmosphere at 37°C and 5% CO2. Cell lines were authenticated using the Ampflstr system (Applied Biosystems) during the study. For hypoxia treatment, cell cultures were cultured in 1% O2 in an Invivo2 hypoxia workstation 4000 (Biotrace, Fred Baker Ltd.) for 8h prior to drug treatment and maintained under hypoxia for the remainder of the experiment. AZD3965 (AstraZeneca – Supplemental Figure 1) was prepared as a 1 mM stock solution in DMSO and stored as single use aliquots at −20°C. Q-VD-OPh was purchased from Merck. Doxycycline (Sigma) was diluted in water to 1 mg/ml and stored at −20°C. Chloroquine (Sigma) was diluted in water to 50 mM and stored at −20°C.
Concentration Response Assays
Cells were seeded into 96 well plates, allowed to attach overnight and where appropriate transferred to hypoxic conditions for 8 hours prior to drug treatment for 72 hours. For adherent cells (NCI-H1048 and DMS114), plates were stained with sulforhodamine B and processed as previously described (22) to give an indication of cellular biomass. Suspension cells (COR-L103, NCI-H526, NCI-H524, NCI-H146, NCI-H82, DMS79) were subjected to resazurin assay as previously described (23). Fraction unaffected was calculated as the fraction of SRB or resazurin signal at a given AZD3965 concentration compared to untreated cells. A value of 1 represents no effect (i.e. same signal as untreated cells) and 0 total effect (i.e. no cells remaining). To determine logEC50 and minimum fraction unaffected (the fraction unaffected at which increasing concentrations of AZD3965 have no additional affect) log drug concentration was plotted against normalized absorbance/fluorescence and non-linear curve fit analysis performed (Graphpad Prism).
Measurements of Lactate
2×10⁵ cells were resuspended in 50 μl 85% ethanol and incubated on ice for 1h or ground tumor was resuspended in 8 volumes of 85% ethanol and incubated overnight. Extraction was followed by centrifugation for 2 min at 13,000g and supernatant analyzed. Lactate concentration was determined using the L-lactate Assay Kit (Eton Bioscience) according to manufacturer’s instructions.
In vivo efficacy of AZD3965
All experiments were conducted according to Home Office Regulations (UK) and protocols approved under project license 40-3306. COR-L103 xenografts were grown by subcutaneous injection of 5×10⁶ cells in 0.2 ml of 1:1 serum-free RPMI:Matrigel (BD) into the mid-dorsal flank of 8 to 14-week-old male NOD scid gamma mice (Paterson Institute for Cancer Research). Mice were housed in individually vented caging systems in a 12-hour light/12-hour dark environment and maintained at uniform temperature and humidity. Tumor size was measured twice a week using calipers and the volume calculated as tumor length × tumor width2/2. 30 days after implantation, mice bearing tumors between 150 and 250mm3 were randomized into two groups of six and treated with 100 mg/kg BID AZD3965 in 0.5% hydroxypropyl methyl cellulose, 0.1% tween 80 or vehicle only by oral gavage for 21 days. Measurements were continued 3 times a week for the duration of drug treatment to assess tumor growth kinetics. At sacrifice tumors were collected to determine intra-tumor lactate concentration.
Cell Cycle Analysis
Pooled detached and adherent cells were fixed with ice cold 70% ethanol. Fixed cells were incubated with 40 μg/mL propidium iodide and 50 μg/mL RNase A in PBS for 30 min at 37°C in the dark. PI staining intensity was detected by flow cytometry (BDFacsCalibur), and the percentage of cells in each stage of the cell cycle determined using ModFit LT 3.2 modeling software (Verity Software).
Western Blotting
Cell lysis, protein sample preparation and western blotting and was carried out as previously described (22). Anti-MCT1 and MCT4 antibodies were raised in rabbits inoculated with peptides CPDQKDTEGGPKEEESPV and CEPEKNGEVVHTPETSV respectively (supplied by AstraZeneca). Other antibodies used were rabbit anti-cleaved caspase 3 (Cell Signaling), mouse anti-CA IX M75 (a kind gift from Prof. Catherine West), rabbit anti-LC3 (#NB100-2220 Novus Biologicals) and mouse anti-α-tubulin TAT (a kind gift from Prof. Keith Gull).
CK18 ELISA
CK18 is released from dying cells, either as a full length protein for non-apoptotic forms of cell death or a caspase cleaved CK18 fragment when cells die by apoptosis. Media from cells was assayed for the presence of total CK18 and caspase cleaved CK18 using the M65 and M30 Apoptosense ELISAs (Perviva) respectively as previously described (24).
Generation of an Inducible MCT1 and 4 Cell Line
MCT1 or 4 cDNA was inserted into pENTR3C (Life Technology) as an EcoRI/BamHI fragment. pENTR3C-MCT4 or pENTR1A-GFP-N2 (Addgene #19364) were recombined with pLenti-CMV-TRE3G-Dest (Addgene #27565)(25) using LR Clonease (Life Technologies) according to manufacturer’s instructions. Viruses were generated by co-transfecting Lenti-X™ 293T cells with pLenti-CMV-TRE3G-MCT1, MCT4 or GFP or pLenti-CMV-rtTA3G-Blast (Addgene #31797) with pCMV-R8.91 and pMD2.G (kind gift from Dr. Akira Orimo) according to manufacturer’s instructions. NCI-H1048 cells were transduced with pLenti-CMV-rtTA3G-Blast plus 6 μg/ml polybrene (Sigma) and selected with 3 ug/ml blasticidin (Sigma). NCI-H1048 rtTA3G cells were transduced with pLenti-CMV-TRE3G-MCT1 and 4 or GFP virus and selected with 1 ug/ml puromycin (Sigma).
siRNA transfection
Cells were transfected with siRNAs targeted to MCT-4 and non-targeting (NT) control siRNA (Thermo Scientific) using Lipofectamine RNAiMAX (Life Technologies) according to the manufacturer’s instructions. After 24 hours siRNA treated cells was re-plated for further experiments.
Tissue Microarray Construction
Archival SCLC biopsy specimens and clinical data from 78 patients presenting to the University Hospital of South Manchester and the Christie Hospital between 1994 and 2005 were retrieved, processed and analyzed according to local ethical approvals. H&E stained sections for each tumor were examined by a clinically accredited pathologist, with specialism in lung cancer (DN). Nine 1 mm diameter representative cores from the tumor specimens were cut and placed randomly in TMA recipient blocks to generate three TMAs. In addition to examining morphology, SCLC histology was confirmed by IHC analysis for cytokeratin, CD56 and synaptophysin.
Immunohistochemistry
Formalin-fixed paraffin-embedded 4 μm sections were prepared from the TMA or cell line pellets. For MCT1 and MCT4 staining sections were dewaxed, rehydrated, antigen retrieval carried out by incubating in 10 mM Citric Acid:NaOH (pH 6.0) for 15 min at 98°C and endogenous peroxidase blocked with 3% H2O2 for 15 min. Slides were blocked with serum blocking solution (Dako) for 30 min and incubated with 1:500 rabbit anti-MCT1, 1:250 rabbit anti-MCT4 in PBST for 1 h. Secondary antibody from the Envision kit (Dako) was applied for 30 min and staining visualized by incubation in DAB solution (Dako) for 3 min. Slides were counterstained with hematoxylin, dehydrated and mounted. Additional IHC was carried out for Carbonic Anhydrase IX (rabbit polyclonal, NB100-417, 1:2000, Novus Biologicals), cytokeratins (mouse AE1/AE3, M3515, 1:60, Dako), CD56 (mouse 1B6, NCL-CD56-1B6, 1:100, Novocastra) and synaptophysin (mouse 27G12, NCL-L-SYNAP-299, 1:200, Novocastra). Antibody incubations and detection were carried out at room temperature on a Menarini IntelliPATH FLX (A. Menarini Diagnostics, U.K.) using Menarini’s reagent buffer and detection kits unless otherwise noted. Antigen retrieval was performed in a pressure cooker using access super retrieval fluid (MP-606-PG1) for all antisera except AE1/AE3, which was 10 min incubation with protease (MP-960-K15) on IntelliPATH.
Analysis of IHC Staining
Staining was evaluated by two independent scorers (one of which was a clinical pathologist, DN) without knowledge of demographic or outcome data. Extent of IHC staining was categorized as 0% (0), 1-25% (1), 26-50% (2), 51-75% (3) or 76-100% (4) and intensity of IHC staining as absent (0), weak (1), moderate (2) or strong (3). Completely crushed and necrotic cores and cores where one or more scorer failed to score were removed. A combined score for each case was calculated as the mean product of extent and intensity for all the cores in a case.
Statistical analysis
Statistical analysis of preclinical studies was carried out with unpaired two-tailed t-tests unless otherwise specified using Graphpad Prism software and a p-value ≤ 0.05 was considered statistically significant. The association between MCT1, MCT4 or CA IX and known prognostic factors (stage, Hb <9 g/L, WBC >10×109/L, platelets <150×109/L, Na <135 mmol/L; LDH >550 IU/L) was evaluated by Fisher’s exact test. Kaplan-Meier analysis was used to assess overall survival (OS) rates and Log Rank test was used for the comparison of the survival distributions. Multivariate analysis was performed using the Cox regression model. Death was defined as the time from biopsy to the time of death. Death due to other causes than SCLC was censored. A p-value ≤ 0.05 was considered statistically significant. The statistical analysis was performed by SPSS version 20 (SPSS Inc.)
Results
Sensitivity of SCLC cell lines to AZD3965
A panel of seven SCLC cell lines was constructed to reflect the mutations in TP53, RB1 and MYC family genes that are common in SCLC (Supplemental Table 1). To assess the efficacy of AZD3965 (Supplemental Figure 1) these cell lines were cultured under normoxic or hypoxic (1% O2) conditions and exposed for 72h to 8 nM AZD3965, a concentration of AZD3965 which inhibited MCT1 activity (data not shown). Generally, cells cultured under hypoxic conditions were more sensitive to AZD3965 than their normoxic counterparts (Figure 1A). There was a wide range of responses of hypoxic cells to AZD3965, with COR-L103, NCI-H526 and NCI-H1048 being relatively sensitive and DMS114, DMS79 and NCI-H146 relatively resistant. NCI-H526, NCI-H1048, NCI-H524 and NCI-H146 cells also demonstrated a reproducible response to AZD3965 under normoxic conditions.
Figure 1. Response to AZD3965 Correlated with Increased Intracellular Lactate.
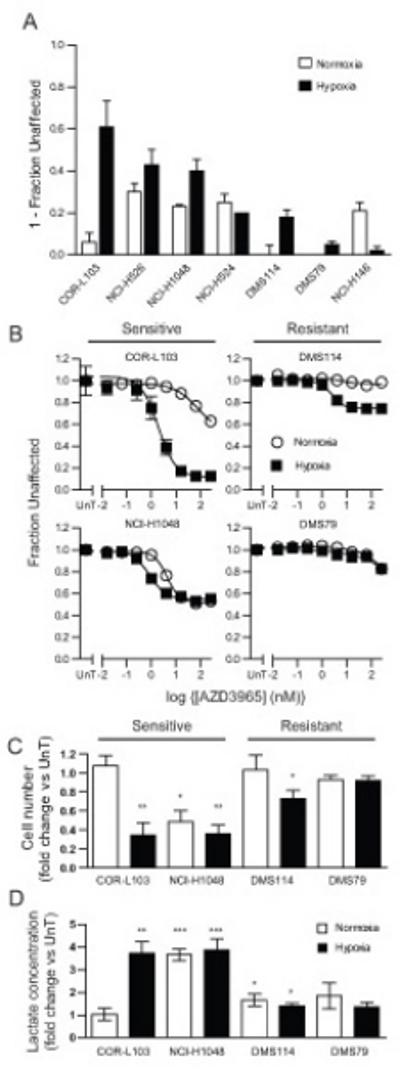
(A) Normoxic (white) or hypoxic (1 % O2, black) SCLC cell lines were treated with 8 nM AZD3965 for 72 hours and the effect of drug relative to vehicle treated cells determined by SRB assay (NCI-H1048 and DMS114 – adherent cells) or resazurin assay (other cell lines – suspension cells). Data is presented as 1-fraction of cells unaffected by AZD3965 relative to untreated control. (B-D) Normoxic or hypoxic COR-L103, NCI-H1048, DMS79 or DMS114 were treated for 72 hours with (A) the indicated concentration of AZD3965 or (B and C) 8 nM AZD3965. (A) SRB (NCI-H1048 and DMS114 – adherent cells) or resazurin assay (COR-L103 and DMS79 – suspension cells) were performed to assess the effect of AZD3965. Open circles, normoxic; closed squares, hypoxia. Data is presented as the fraction of cells unaffected by AZD3965 relative to untreated control. (B) Cell number was counted and expressed relative to untreated cells cultured under the same conditions. (C) Intracellular lactate was measured and expressed relative to untreated cells cultured under the same conditions. All graphs represent mean of at least three independent experiments carried out in triplicate (A and B) or duplicate (C and D) ± SEM. * p<0.05, ** p<0.01, ***p<0.001 according to paired two tailed t-test.
Based on the cell panel data, four cell lines were chosen for further analysis, two which were sensitive to AZD3965 under hypoxia (COR-L103 and NCI-H1048) and two which were relatively AZD3965 resistant (DMS79 and DMS114). Concentration response experiments (Figure 1B) demonstrated that COR-L103 were exquisitely sensitive to AZD3965 but only under hypoxic conditions. NCI-H1048 cells were more sensitive to AZD3965 under hypoxic compared to normoxic conditions although the minimum fraction unaffected was the same in both environments and higher than COR-L103 cells in hypoxia. Of the two resistant cell lines DMS114 exhibited a modest response to AZD3965 under hypoxic conditions whilst DMS79 showed no response until >100 nM AZD3965. Due to the fact COR-L103 and DMS79 grow in suspension it was necessary to utilize the resazurin assay to determine the effect of AZD3965. However, resazurin reduction can be influenced by the metabolic activity of cells and is therefore not necessarily a robust readout of cell number. Therefore, to determine whether the effect of AZD3965 was due to reduced cell number the effect of 8 nM AZD3965 on cell number was determined in the four cell lines cultured under normoxic or hypoxic conditions (Figure 1C). Consistent with the concentration response data, AZD3965 treatment caused a statistically significant reduction in hypoxic COR-L103 (p=0.002), normoxic (p=0.011) and hypoxic (p=0.0023) NCI-H1048 and hypoxic DMS114 cells (p=0.038).
As the primary substrate for MCT1 mediated transport is lactate, the effect of AZD3965 treatment on intracellular lactate was determined (Figure 1D). AZD3965 treatment caused a 3.7 fold increase in intracellular lactate in hypoxic COR-L103 and 3.7 fold and 3.9 fold increases in normoxic and hypoxic NCI-H1048 cells respectively. In all other cases a <1.9 fold increase was observed. These data are consistent with AZD3965 blocking lactate transport in cells where AZD3965 also reduces cell number and is consistent with AZD3965 acting via inhibition of MCT1.
To further confirm that AZD3965 targeted MCT1, NCI-H1048 cells were engineered to inducibly overexpress MCT1. If AZD3965 targeted MCT1 we predicted that overexpressing MCT1 would lead to AZD3965 resistance, as more AZD3965 would be required to effectively inhibit all MCT1. Indeed, when MCT1 was overexpressed (Supplemental Figure 2A) the EC50 of NCI-H1048 was increased from 0.14 nM to 10.5 nM (Supplemental Figure 2B). This is consistent with AZD3965 acting via MCT1 inhibition.
In vivo efficacy of AZD3965
COR-L103 xenograft studies were carried out to determine whether the in vitro effect of AZD3965 was recapitulated in vivo. COR-L103 tumor bearing mice were treated with 100 mg/kg AZD3965 or vehicle BID for 21 days and the tumor volume monitored. Pharmacokinetic analysis demonstrated that 100 mg/kg AZD3965 BID resulted in concentrations of free AZD3965 predicted to inhibit lactate transport (data not shown). AZD3965 treatment significantly reduced the growth of COR-L103 tumors (Figure 2A – p<0.0001; 2 way ANOVA), although tumour regression was not seen, consistent with AZD3965 only targeting the hypoxic fraction of the tumour. Analysis of lactate concentration at sacrifice confirmed that the reduced tumor growth rate was accompanied by a significant increase in intra-tumor lactate (Figure 2B; p=0.0038) consistent with the in vitro observation that AZD3965 affected hypoxic COR-L103 cell proliferation/survival and increased intracellular lactate.
Figure 2. AZD3965 Inhibited COR-L103 Xenograft Growth and Increased Intra-Tumor Lactate Concentration.
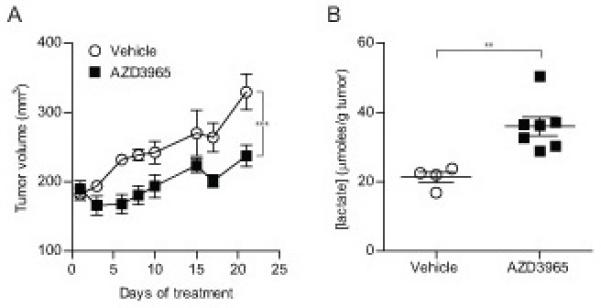
COR-L103 xenograft bearing mice were treated with 100 mg/kg BID AZD3935 or vehicle and the effect on (A) tumor volume or (B) intra-tumor lactate after 21 days of treatment was determined. N=6 for vehicle and N=7 for AZD3965 treated groups (2 vehicle treated animals were sacrificed early so are excluded from lactate concentration analysis). (A) *** p<0.001 according to two way ANOVA. (B) ** p<0.01 according to two-tailed unpaired t-test.
Cell Fate of AZD3965 treated SCLC cells
In order to define the nature of the response to MCT1 inhibition, the cell cycle profile of cells cultured in normoxia or hypoxia and treated with AZD3965 were determined by flow cytometry (Figure 3A and Supplemental Figure 3). AZD3965 had no effect on the cell cycle phase distribution of DMS114 or DMS79 cells cultured in normoxic or hypoxic conditions or on COR-L103 cells cultured in normoxic conditions. However, significant increase in the proportion of cells with sub-G1 DNA content was detected after AZD3965 treatment in both COR-L103 and NCI-H1048 cells cultured in hypoxia and NCI-H1048 cells under normoxia. Increased sub-G1 was most pronounced in COR-L103, which correlated with the effect of AZD3965 reported in Figure 1. To investigate whether the sub-G1 population of cells was caused by AZD3965 induced apoptosis the four cell lines cultured in normoxia and hypoxia and treated with AZD3965 were assayed for the presence of cleaved caspase 3 by western blotting (Figure 3B). Untreated hypoxic NCI-H1048 and normoxic DMS114 showed evidence of cleaved caspase 3, suggesting a degree of spontaneous apoptosis in hypoxic NCI-H1048 and normoxic DMS114. However, AZD3965 did not affect the level of cleaved caspase 3 in any cell line under normoxic or hypoxic conditions. Treatment of COR-L103 cells with the broad spectrum caspase inhibitor Q-VD-OPh did not affect the concentration response under normoxia or hypoxia (Figure 3C). Furthermore, whilst AZD3965 treatment of hypoxic COR-L103 cells led to accumulation of CK18 in the media, a general marker of cell death (26), it was not the caspase cleaved form of CK18 (Figure 3D) consistent with the observed cell death being non-apoptotic.
Figure 3. AZD3965 Induced Non-Apoptotic Cell Death in Hypoxic COR-L103.
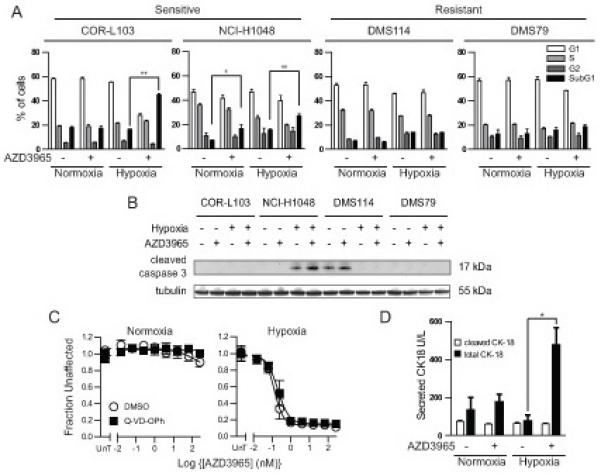
(A) Normoxic or hypoxic COR-L103, NCI-H1048, DMS79 or DMS114 cells were treated with 8 nM AZD3965 for 72 hours. Ethanol fixed cells were stained with propidium iodide and the cell cycle profile determined by flow cytometry. (B) Normoxic or hypoxic COR-L103, NCI-H1048, DMS79 and DMS114 cells were treated with 8 nM AZD3965 for 72 hours and the level of cleaved caspase-3 assayed by western blot. Tubulin is used as a loading control. (C) Normoxic or hypoxic COR-L103 cells were treated with the indicated concentration of AZD3965 as in Figure 1B plus 10 μM Q-VD-OPh or DMSO equivalent. (D) Normoxic and hypoxic COR-L103 were treated with 8 nM AZD3965 for 72 hours and the media assayed for the presence of total or caspase cleaved CK18. Blots are representative of three independent experiments. All graphs represent mean of three independent experiments ± SEM. * p<0.05, ** p<0.01 according to paired two tailed t-test.
If AZD3965 did not cause cell death via apoptosis we reasoned that it may cause autophagy, eventually leading to cell death. To test this hypothesis normoxic and hypoxic COR-L103, NCI-H1048, DMS114 and DMS79 cells were treated with AZD3965 or vehicle control, with and without chloroquine. Chloroquine raises the lysosomal pH, preventing completion of autophagy and therefore making any changes to the rate of autophagy easier to detect. The effect of AZD3965 and/or chlorquine on the level of the autophagic marker LC3-II was assessed by western blotting (Supplemental Figure 4). In all cases chloroquine increased the level of LC3-II, consistent with a degree of background autophagy occurring in all cell lines in both normoxia and hypoxia. However, there was no evidence of AZD3965 affecting the level of LC3-II, regardless of chloroquine treatment. This suggests that AZD3965 does not cause autophagy. Taken together, these data suggest that AZD3965 treatment induced a non-apoptotic, non-autophagic form of cell death, most likely necrotic cell death, in hypoxic COR-L103 and NCI-H1048, which may account for the efficacy of AZD3965 reported in Figures 1 and 2.
Role of MCT4 in SCLC resistance to AZD3965
Previous reports in other cancer types have implicated MCT4 expression as a resistance factor for MCT1 inhibition (21) and MCT4 expression is upregulated by HIF1α in hypoxia (27). To determine whether there is a correlation between MCT1 and MCT4 expression and response to AZD3965 in SCLC, MCT1 and MCT4 expression levels under normoxic and hypoxic conditions in the presence and absence of AZD3965 were assessed by western blot (Figure 4A). Whilst MCT4 expression was undetectable in COR-L103 and NCI-H1048 cells, regardless of oxygen concentration or AZD3965 treatment, MCT4 expression was detectable in normoxic DMS79 cells and hypoxia increased MCT4 expression in both DMS114 and DMS79 cells. Furthermore, hypoxic MCT4 expression correlated with fraction unaffected by 8 nM AZD3965 across the full panel of cell lines (Supplemental Figure 5, p=0.003). IHC staining of COR-L103 xenografts demonstrated that the tumour also expressed high levels of MCT1 but not MCT4 (Supplemental Figure 6). It is interesting to note that the level of MCT1 increased in hypoxic DMS114 cells, although the reason for this is unclear.
Figure 4. Hypoxia-induced MCT4 Expression Correlated with Resistance to AZD3965 and MCT4 Overexpression Caused AZD3965 Resistance.
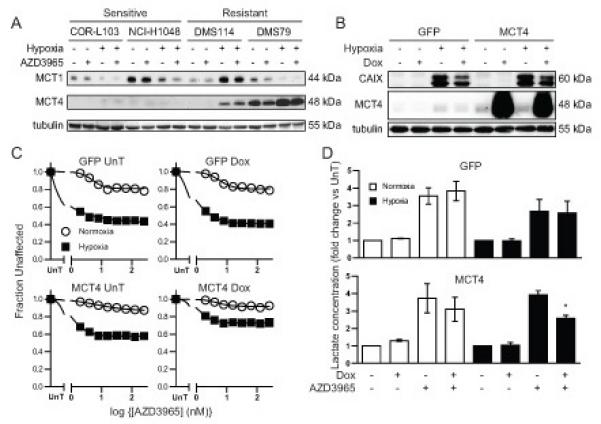
(A) Normoxic or hypoxic COR-L103, NCI-H1048, DMS79 or DMS114 cells were treated with 8 nM AZD3965 for 72 hours. Expression of MCT1 and MCT4 protein was assayed by western blotting. Tubulin was used as a loading control. (B-D) NCI-H1048 cells engineered to overexpress GFP or MCT4 upon the addition of doxycycline (Dox) were cultured under normoxia or hypoxia and treated with 1 μg/ml doxycycline alone (B) or with the indicated concentration of AZD3965 (C) or 8 nM AZD3965 (D). MCT4 and CA IX expression was assayed by western blotting with tubulin used as loading control (B). Cellular biomass was determined as in Figure 1B (C). Intracellular lactate was measured as in Figure 1D and expressed relative to untreated normoxic or hypoxic cells (D). Blots are representative of three independent experiments. All graphs represent mean of at least three independent experiments ± SEM. * p<0.05 according to paired two tailed t-test.
Two approaches were taken to test whether MCT4 caused AZD3965 resistance in SCLC cells. First, the effect of MCT4 overexpression in the AZD3965 sensitive cell line NCI-H1048 was determined. NCI-H1048 cells were engineered to inducibly overexpress GFP or MCT4 in response to doxycycline treatment (Figure 4B). The effect of GFP or MCT4 overexpression on AZD3965 efficacy was determined (Figure 4C). Under hypoxic conditions, GFP expression did not affect the minimum fraction unaffected (0.443 GFP No Dox vs. 0.405 GFP Dox; p=0.522), whilst MCT4 over-expression significantly increased the minimum fraction unaffected (0.572 MCT4 No Dox vs. 0.761 MCT4 Dox; p=0.035). Furthermore, the level of intracellular lactate in hypoxic cells following AZD3965 treatment (Figure 4D) was not affected by GFP expression (2.7 fold GFP No Dox vs. 2.7 fold GFP Dox; p=0.91) but was significantly decreased in MCT4 over-expressing cells (3.9 fold MCT4 No Dox vs. 2.5 fold MCT4 Dox; p=0.01). Together this data suggest that MCT4 over-expression can induce AZD3965 resistance in hypoxic NCI-H1048 SCLC cells.
The effect of MCT4 RNAi on AZD3965 sensitivity was assessed to determine whether MCT4 expression was the cause of AZD3965 resistance in DMS79 and DMS114 cells. MCT4 RNAi depleted MCT4 in both DMS114 and DMS79 cells under normoxic and hypoxic conditions (Figure 5A). In both cases MCT4 knockdown increased the sensitivity to AZD3965 (Figure 5B), with the minimum fraction unaffected decreasing in DMS114 from 0.73 in hypoxic control cells to 0.464 in hypoxic MCT4 RNAi cells (p=0.01) and in DMS79 from 0.94 in hypoxic control cells to 0.75 in MCT4 RNAi hypoxic cells (p=0.0002). Increased AZD3965 sensitivity was associated with a significant increase in intracellular lactate in hypoxic cells treated with AZD3965 (Figure 5C). Specifically, in hypoxic DMS114 cells AZD3965 caused a 1.8 fold lactate increase in control cells and a 2.8 fold lactate increase in MCT4 RNAi (p=0.0002) and in hypoxic DMS79 cells AZD3965 treatment lead to a 1.3 fold lactate increase in control cells and a 2.4 fold lactate increase in MCT-4 RNAi cells (p=0.002). In both cell lines MCT4 knockdown alone did not cause a significant increase in intracellular lactate levels, suggesting that MCT1 and MCT4 are both able to transport lactate in these cells. Taken together, the analysis of endogenous MCT4 expression, MCT4 over-expression and MCT4 RNAi data strongly suggest that MCT4 expression in hypoxic SCLC cells caused resistance to MCT1 inhibition by AZD3965.
Figure 5. MCT4 Knockdown Sensitized Resistant Cells to AZD3965.
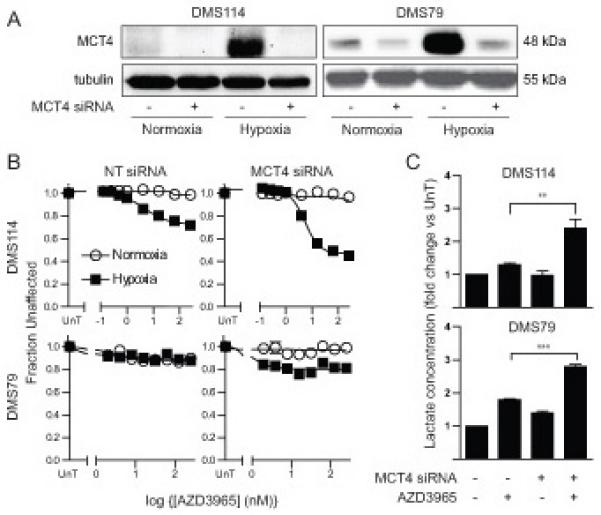
DMS114 and DMS79 cells were transfected with siRNA targeting MCT4 or a non-targeting (NT) control. (A) Expression of MCT4 was assessed by western blotting of cells cultured under normoxia or hypoxia. Tubulin was used as loading control. (B) Effect of AZD3965 on metabolic activity or cellular biomass was determined as in Figure 1B. (C) Intracellular lactate concentration was determined in hypoxic cells as in Figure 1D and expressed relative to untreated cells. Blots are representative of three independent experiments. All graphs represent mean of three independent experiments ± SEM. ** p<0.01, ***p<0.001 according to paired two tailed t-test.
Evaluation of Hypoxia, MCT1 and MCT4 in SCLC Patient Biopsies
The preclinical data suggest that SCLC tumors that express MCT1 but not MCT4 in hypoxic regions may be most sensitive to growth inhibition by AZD3965. To determine whether this is a phenotype observed in SCLC patients a tissue microarray (TMA), generated from tumor cores from 78 SCLC patients, was stained by IHC for expression of MCT1, MCT4 and for the hypoxia marker CA IX (28). Specificity of MCT1 and MCT4 staining was first demonstrated in cell lines with known MCT1 and MCT4 expression levels (Supplemental Figure 7). MCT1, MCT4 and CA IX staining of the TMA revealed the expected plasma membrane staining for all three markers (Supplemental Figure 8A). The TMA was assessed by two independent scorers using predetermined scoring criteria (see materials and methods and Supplemental Figures 8B). Correlation between scorers was evaluated by Pearson test and in all cases has highly significant (Supplemental Figure 9A). The results demonstrated heterogeneous expression levels for MCT1, MCT4 and CA IX. The proportion of tumors with any expression of MCT1, MCT4 or CA IX was 99%, 99%, 90% respectively. The level of MCT1, MCT4 or CA IX expression was quantified by multiplying the extent and intensity scores for a core and calculating the mean value for all cores from a patient. Higher levels of expression were observed for MCT1 (median=8.17) compared to MCT4 (median=2.21; paired t-test p-value<0.0001; Supplemental Figure 9B). A positive correlation was observed for CA IX expression and MCT4 expression (Pearson R2=0.146, p=0.0005; Figure 6A top and Supplemental Figure 10)); consistent with our previous observation in vitro that hypoxia can increase MCT4 levels in SCLC. However, tumors with CA IX expression, high MCT1 expression (>median) and low MCT4 expression (<median) were present, representing 21% of the cases in this cohort. This defined a putative subpopulation of SCLC with higher chance of response to MCT1 inhibition by AZD3965, according to our preclinical findings (Figure 6A lower panels and Figure 6B).
Figure 6. SCLC TMA Analysis Revealed Existence of MCT1 High MCT4 Low Tumors.
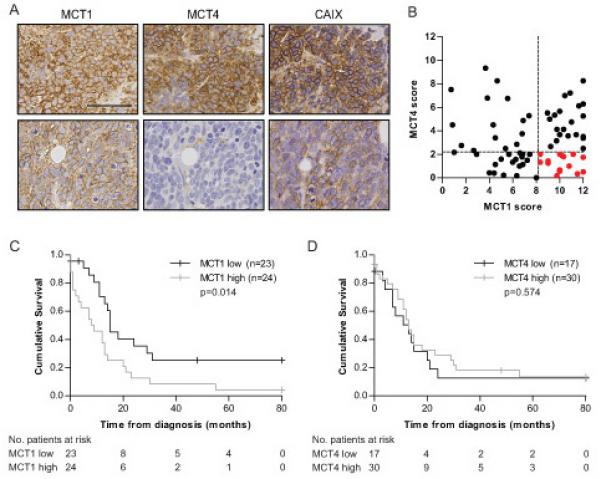
A SCLC TMA was stained with anti-MCT1, MCT4 and CA IX antibodies and independently scored by two operators. (A) Images of serial sections stained with MCT1, MCT4 and CA IX from two representative cores. Scale bar represents 100 μm. (B) Dot plot of MCT1 vs. MCT4 score (extent × intensity) for each case with a CA IX score >0 (n=70). Dotted lines represent median MCT1 and MCT4 score from all cases. (C) and (D) Kaplan-Meier plots and log-rank p-values for patient survival stratified by low (<median) and high (≥median) expression of MCT1 (C) and MCT4 (D) (n=47).
Clinical Significance of MCT1, MCT4 and CA IX expression in SCLC
To explore the association of MCT1, MCT4 or CA IX expression with clinical demographics, clinical prognostic factors and overall survival, data was available for 47 of the 78 patients scored for MCT expression (Supplemental Table 2). Patients were stratified into MCT1 high/low, MCT4 high/low or CA IX high/low based on the median score from the complete TMA data set. No significant correlation was observed for MCT1, MCT4 or CA IX with known clinical prognostic factors (stage, Hb <9 g/L, WBC >10 × 109/L, platelets <150 × 109/L, Na <135 mmol/L; LDH >550 IU/L; data not shown). However, MCT1 expression score was associated with worse survival with a median survival of 9 months for MCT1 expression ≥median compared to 15 months for MCT1 expression <median; (log-rank p=0.014, Figure 6C). Neither MCT4 nor CA IX expression was prognostic (Figure 6D and Supplemental Figure 11A). Of the known prognostic factors assessed, extensive stage was associated with shorter overall survival (Supplemental Figure 11B; median survival 2 months vs. 14 months; p<0.0001) whilst a trend toward poorer prognosis was observed for patients with LDH≥550 UI/L (Supplemental Figure 11C). Multivariate analysis was performed on 29 patients. Stage, MCT1 expression and LDH level were included as they were significant or showed a trend towards significance in the univariate analysis. None of the variables remained significant in the multivariate analysis (stage HR=3.62 (CI 0.995-13.18) p=0.051, MCT1 HR=0.646 (CI 0.27-1.57) p=0.333, LDH HR=0.599 (CI 0.266-1.35) p=0.216).
Discussion
Aberrations in cellular metabolism have been acknowledged recently as a hallmark of cancer (8), which is highlighted by the number of novel therapies targeting cancer metabolism currently in development (18). One such approach pertinent to SCLC is perturbation of glycolytic tumor metabolism. Cancer cells frequently rely on glycolysis, rather than oxidative phosphorylation, for ATP generation, a phenomenon termed the Warburg effect (29), in order to shunt carbon into biosynthetic pathways essential for rapid cell growth and division (30). Dependency on glycolysis is further enhanced by obligate glycolysis in hypoxic cells, a common occurrence in tumors with compromised vascular architecture (31). One consequence of increased glycolysis/reduced oxidative phosphorylation is increased lactate production. Lactate must be transported from the cell in order to prevent intracellular acidification or inhibition of metabolic pathways due to negative regulation caused by high lactate levels (18). MCT1 plays an important role in metabolism by facilitating diffusion of monocarboxylates, such as lactate, across the plasma membrane and MCT1 expression is prevalent in tumors compared to normal tissues (32). Previous work suggested that MCT1 may be an effective target for therapeutic intervention of glycolytic tumor cells (19, 20). In the present study, we tested the small molecule MCT1 inhibitor AZD3965 in a panel of SCLC cell lines in anticipation that these cells, derived from highly aggressive, rapidly proliferating and often hypoxic tumors, will be reliant on glycolysis and thus vulnerable to inhibition of MCT1.
Our data demonstrate that some, but not all, SCLC cell lines respond to MCT1 inhibition and are particularly sensitive when hypoxic and therefore obligate glycolytic. We confirmed that the sensitivity of the COR-L103 cells to AZD3965 in vitro translated to an in vivo model, where increased intra-tumor lactate provided proof of mechanism. Furthermore, high expression of the HIF1α-inducible member of the MCT family, MCT4, is associated with resistance to AZD3965 in SCLC. Importantly, MCT4 overexpression lead to AZD3965 resistance and MCT4 knockdown caused AZD3965 sensitization, confirming that MCT4 is a bona fide AZD3965 resistance factor. These findings are in line with previously published data obtained in other cell types and consistent with functional redundancy between MCT1 and MCT4 (21). These data raised the question of whether, in hypoxic clinical samples, MCT1 expression can occur in the absence of MCT4, thus predicting an AZD3965 sensitive population. We observed a correlation between MCT4 and CA IX expression, reinforcing the relationship between hypoxia and MCT4 expression in the clinical setting. However, we also demonstrated that 21% of SCLC tumors with hypoxic regions exhibit a MCT1-high, MCT4-low phenotype.
The expression and clinical significance of MCT1 and MCT4 has not previously been reported for SCLC. Our data suggest that MCT1 expression is associated with worse survival reinforcing that MCT1 is a relevant drug target for this disease, although it was not possible to assess whether MCT1 was an independent poor prognostic factor due to the small sample of patients included in the multivariate analysis. Other studies have previously demonstrated that MCT1 and MCT4 expression changes with cancer progression, although whether levels increase or decrease relative to normal tissue depends on cancer type (32). Two studies have correlated MCT1 expression with known prognostic markers in basal-like breast carcinoma (33) and prostate cancer (34). However, to our knowledge, this is first description of an association between MCT1 and worse OS in any type of cancer.
Taken together, our preclinical and clinical data provides a rationale to test AZD3965 in SCLC patients. It also identifies a profile of high MCT1 in hypoxic regions in the absence/low expression of MCT4 in tumors as a potential predictive biomarker profile for patient selection to test clinically. The ability to identify molecularly defined subpopulations for targeted drug development has accelerated development of novel therapies for other cancers, for example in non-small cell lung cancer with the clinical development of crizotinib for NSCLC bearing ALK gene fusion (35). Furthermore, the evaluation of targeted therapies in unselected SCLC patient cohorts has likely contributed to the universally negative trial results to date (36). Our results provide rational to select patients for clinical trials based on MCT1, MCT4 and CA IX tumor expression.
We also confirmed that SCLC cells and tumor xenograft accumulate high levels of intracellular lactate in response to AZD3965 in vitro and in vivo respectively. This implies that monitoring intra-tumor lactate concentration will serve as a pharmacodynamic biomarker using non-invasive NMR spectroscopy-based techniques to measure metabolite levels in patients’ tumors (37).
Serum levels of lactate dehydrogenase, the enzyme responsible for converting pyruvate into lactate, is a known independent prognostic factor in SCLC (38). Whilst serum LDH most likely reflects tumor burden, it may be further affected by a highly hypoxic and/or glycolytic tumor (39). Indeed, FGD avidity, a marker of glycolysis, is also associated with worse prognosis in SCLC patients (40). Of further interest are the findings that high levels of tumor lactate are associated with increased metastatic rate and worse survival in cervical and head and neck cancer patients (41, 42). These data suggest that patients with highly glycolytic tumors have a poorer outcome, supporting the notion of targeting glycolytic tumor cells in SCLC. Our results provide a rational for clinical evaluation of AZD3965 in patients with SCLC, incorporating measurement of MCT1 and MCT4 expression, intra-tumor lactate, serum LDH and FDG avidity as putative predictive and pharmacodynamic biomarkers.
Supplementary Material
Translational Relevance.
Small cell lung cancer (SCLC) has dismal prognosis with minimal improvement in treatment for several decades. One attractive strategy is to exploit the altered metabolism of rapidly proliferating and hypoxic tumors by inhibiting lactate transport with monocarboxylate transporter (MCT) inhibitors. The MCT1 inhibitor AZD3965 is in Phase I clinical trial but tests to predict responses are unproven and activity in SCLC is untested. Here, we demonstrate preclinically that hypoxic SCLC cells lacking expression of the alternative lactate transporter, MCT4, are sensitive to AZD3965. In 78 SCLC patients’ tumor biopsies, 21% express MCT1 in hypoxic regions without MCT4, thus predicting response to AZD3965. We also show in these tumors that MCT1 expression correlates with shorter patient survival suggesting it is a relevant drug target. These data provide rationale for commencing clinical evaluation of AZD3965 in SCLC patients with assessment of the predictive profile for response.
Acknowledgements
We thank Becky Bola, Amy Chadwick and Ian Stratford for helpful discussion of the data. The study was supported by CR-UK core funding to the Paterson Institute for Cancer Research (C147/A12328) to CD.
Footnotes
Conflict of Interest: S.E.C. and P.D.S. are employees and shareholders of AstraZeneca. AstraZeneca provided AZD3965 and contributed to the consumables costs of the study.
References
- 1.Amarasena IU, Walters JA, Wood-Baker R, Fong K. Platinum versus non-platinum chemotherapy regimens for small cell lung cancer. Cochrane Database Syst Rev. 2008:CD006849. doi: 10.1002/14651858.CD006849.pub2. [DOI] [PubMed] [Google Scholar]
- 2.Davies AM, Evans WK, Mackay JA, Shepherd FA. Treatment of recurrent small cell lung cancer. Hematol Oncol Clin North Am. 2004;18:387–416. doi: 10.1016/j.hoc.2003.12.010. [DOI] [PubMed] [Google Scholar]
- 3.Seifter EJ, Ihde DC. Therapy of small cell lung cancer: a perspective on two decades of clinical research. Semin Oncol. 1988;15:278–99. [PubMed] [Google Scholar]
- 4.Peifer M, Fernandez-Cuesta L, Sos ML, George J, Seidel D, Kasper LH, et al. Integrative genome analyses identify key somatic driver mutations of small-cell lung cancer. Nat Genet. 2012;44:1104–10. doi: 10.1038/ng.2396. [DOI] [PMC free article] [PubMed] [Google Scholar]
- 5.Pleasance ED, Stephens PJ, O’Meara S, McBride DJ, Meynert A, Jones D, et al. A small-cell lung cancer genome with complex signatures of tobacco exposure. Nature. 2010;463:184–90. doi: 10.1038/nature08629. [DOI] [PMC free article] [PubMed] [Google Scholar]
- 6.Rudin CM, Durinck S, Stawiski EW, Poirier JT, Modrusan Z, Shames DS, et al. Comprehensive genomic analysis identifies SOX2 as a frequently amplified gene in small-cell lung cancer. Nat Genet. 2012;44:1111–6. doi: 10.1038/ng.2405. [DOI] [PMC free article] [PubMed] [Google Scholar]
- 7.Sher T, Dy GK, Adjei AA. Small cell lung cancer. Mayo Clin Proc. 2008;83:355–67. doi: 10.4065/83.3.355. [DOI] [PubMed] [Google Scholar]
- 8.Hanahan D, Weinberg RA. Hallmarks of cancer: the next generation. Cell. 2011;144:646–74. doi: 10.1016/j.cell.2011.02.013. [DOI] [PubMed] [Google Scholar]
- 9.Govindan R, Page N, Morgensztern D, Read W, Tierney R, Vlahiotis A, et al. Changing epidemiology of small-cell lung cancer in the United States over the last 30 years: analysis of the surveillance, epidemiologic, and end results database. J Clin Oncol. 2006;24:4539–44. doi: 10.1200/JCO.2005.04.4859. [DOI] [PubMed] [Google Scholar]
- 10.Ioannou M, Papamichali R, Kouvaras E, Mylonis I, Vageli D, Kerenidou T, et al. Hypoxia inducible factor-1 alpha and vascular endothelial growth factor in biopsies of small cell lung carcinoma. Lung. 2009;187:321–9. doi: 10.1007/s00408-009-9169-z. [DOI] [PubMed] [Google Scholar]
- 11.Guillaumond F, Leca J, Olivares O, Lavaut MN, Vidal N, Berthezene P, et al. Strengthened glycolysis under hypoxia supports tumor symbiosis and hexosamine biosynthesis in pancreatic adenocarcinoma. Proc Natl Acad Sci U S A. 2013;110:3919–24. doi: 10.1073/pnas.1219555110. [DOI] [PMC free article] [PubMed] [Google Scholar]
- 12.Schumacher T, Brink I, Mix M, Reinhardt M, Herget G, Digel W, et al. FDG-PET imaging for the staging and follow-up of small cell lung cancer. Eur J Nucl Med. 2001;28:483–8. doi: 10.1007/s002590100474. [DOI] [PubMed] [Google Scholar]
- 13.Wistuba II, Gazdar AF, Minna JD. Molecular genetics of small cell lung carcinoma. Semin Oncol. 2001;28:3–13. [PubMed] [Google Scholar]
- 14.Dang CV, Le A, Gao P. MYC-induced cancer cell energy metabolism and therapeutic opportunities. Clin Cancer Res. 2009;15:6479–83. doi: 10.1158/1078-0432.CCR-09-0889. [DOI] [PMC free article] [PubMed] [Google Scholar]
- 15.Vousden KH, Ryan KM. p53 and metabolism. Nat Rev Cancer. 2009;9:691–700. doi: 10.1038/nrc2715. [DOI] [PubMed] [Google Scholar]
- 16.Ekberg H, Qi Z, Pahlman C, Veress B, Bundick RV, Craggs RI, et al. The specific monocarboxylate transporter-1 (MCT-1) inhibitor, AR-C117977, induces donor-specific suppression, reducing acute and chronic allograft rejection in the rat. Transplantation. 2007;84:1191–9. doi: 10.1097/01.tp.0000287541.53389.be. [DOI] [PubMed] [Google Scholar]
- 17.Halestrap AP, Price NT. The proton-linked monocarboxylate transporter (MCT) family: structure, function and regulation. Biochem J. 1999;343(Pt 2):281–99. [PMC free article] [PubMed] [Google Scholar]
- 18.Cairns RA, Harris IS, Mak TW. Regulation of cancer cell metabolism. Nat Rev Cancer. 2011;11:85–95. doi: 10.1038/nrc2981. [DOI] [PubMed] [Google Scholar]
- 19.Mathupala SP, Parajuli P, Sloan AE. Silencing of monocarboxylate transporters via small interfering ribonucleic acid inhibits glycolysis and induces cell death in malignant glioma: an in vitro study. Neurosurgery. 2004;55:1410–1419. doi: 10.1227/01.neu.0000143034.62913.59. [DOI] [PubMed] [Google Scholar]
- 20.Sonveaux P, Vegran F, Schroeder T, Wergin MC, Verrax J, Rabbani ZN, et al. Targeting lactate-fueled respiration selectively kills hypoxic tumor cells in mice. J Clin Invest. 2008;118:3930–42. doi: 10.1172/JCI36843. [DOI] [PMC free article] [PubMed] [Google Scholar]
- 21.Le Floch R, Chiche J, Marchiq I, Naiken T, Ilc K, Murray CM, et al. CD147 subunit of lactate/H+ symporters MCT1 and hypoxia-inducible MCT4 is critical for energetics and growth of glycolytic tumors. Proc Natl Acad Sci U S A. 2011;108:16663–8. doi: 10.1073/pnas.1106123108. [DOI] [PMC free article] [PubMed] [Google Scholar]
- 22.Martin-Fernandez C, Bales J, Hodgkinson C, Welman A, Welham MJ, Dive C, et al. Blocking phosphoinositide 3-kinase activity in colorectal cancer cells reduces proliferation but does not increase apoptosis alone or in combination with cytotoxic drugs. Mol Cancer Res. 2009;7:955–65. doi: 10.1158/1541-7786.MCR-08-0445. [DOI] [PMC free article] [PubMed] [Google Scholar]
- 23.Harrison LR, Micha D, Brandenburg M, Simpson KL, Morrow CJ, Denneny O, et al. Hypoxic human cancer cells are sensitized to BH-3 mimetic-induced apoptosis via downregulation of the Bcl-2 protein Mcl-1. J Clin Invest. 2011;121:1075–87. doi: 10.1172/JCI43505. [DOI] [PMC free article] [PubMed] [Google Scholar]
- 24.Cummings J, Ward TH, LaCasse E, Lefebvre C, St-Jean M, Durkin J, et al. Validation of pharmacodynamic assays to evaluate the clinical efficacy of an antisense compound (AEG 35156) targeted to the X-linked inhibitor of apoptosis protein XIAP. Br J Cancer. 2005;92:532–8. doi: 10.1038/sj.bjc.6602363. [DOI] [PMC free article] [PubMed] [Google Scholar]
- 25.Campeau E, Ruhl VE, Rodier F, Smith CL, Rahmberg BL, Fuss JO, et al. A versatile viral system for expression and depletion of proteins in mammalian cells. PLoS One. 2009;4:e6529. doi: 10.1371/journal.pone.0006529. [DOI] [PMC free article] [PubMed] [Google Scholar]
- 26.Kramer G, Erdal H, Mertens HJ, Nap M, Mauermann J, Steiner G, et al. Differentiation between cell death modes using measurements of different soluble forms of extracellular cytokeratin 18. Cancer Res. 2004;64:1751–6. doi: 10.1158/0008-5472.can-03-2455. [DOI] [PubMed] [Google Scholar]
- 27.Ullah MS, Davies AJ, Halestrap AP. The plasma membrane lactate transporter MCT4, but not MCT1, is up-regulated by hypoxia through a HIF-1alpha-dependent mechanism. J Biol Chem. 2006;281:9030–7. doi: 10.1074/jbc.M511397200. [DOI] [PubMed] [Google Scholar]
- 28.Loncaster JA, Harris AL, Davidson SE, Logue JP, Hunter RD, Wycoff CC, et al. Carbonic anhydrase (CA IX) expression, a potential new intrinsic marker of hypoxia: correlations with tumor oxygen measurements and prognosis in locally advanced carcinoma of the cervix. Cancer Res. 2001;61:6394–9. [PubMed] [Google Scholar]
- 29.Koppenol WH, Bounds PL, Dang CV. Otto Warburg’s contributions to current concepts of cancer metabolism. Nat Rev Cancer. 2011;11:325–37. doi: 10.1038/nrc3038. [DOI] [PubMed] [Google Scholar]
- 30.Vander Heiden MG, Cantley LC, Thompson CB. Understanding the Warburg effect: the metabolic requirements of cell proliferation. Science. 2009;324:1029–33. doi: 10.1126/science.1160809. [DOI] [PMC free article] [PubMed] [Google Scholar]
- 31.Semenza GL. Targeting HIF-1 for cancer therapy. Nat Rev Cancer. 2003;3:721–32. doi: 10.1038/nrc1187. [DOI] [PubMed] [Google Scholar]
- 32.Pinheiro C, Longatto-Filho A, Azevedo-Silva J, Casal M, Schmitt FC, Baltazar F. Role of monocarboxylate transporters in human cancers: state of the art. J Bioenerg Biomembr. 2012;44:127–39. doi: 10.1007/s10863-012-9428-1. [DOI] [PubMed] [Google Scholar]
- 33.Pinheiro C, Albergaria A, Paredes J, Sousa B, Dufloth R, Vieira D, et al. Monocarboxylate transporter 1 is up-regulated in basal-like breast carcinoma. Histopathology. 2010;56:860–7. doi: 10.1111/j.1365-2559.2010.03560.x. [DOI] [PubMed] [Google Scholar]
- 34.Pertega-Gomes N, Vizcaino JR, Miranda-Goncalves V, Pinheiro C, Silva J, Pereira H, et al. Monocarboxylate transporter 4 (MCT4) and CD147 overexpression is associated with poor prognosis in prostate cancer. BMC Cancer. 2011;11:312. doi: 10.1186/1471-2407-11-312. [DOI] [PMC free article] [PubMed] [Google Scholar]
- 35.Kwak EL, Bang YJ, Camidge DR, Shaw AT, Solomon B, Maki RG, et al. Anaplastic lymphoma kinase inhibition in non-small-cell lung cancer. N Engl J Med. 2010;363:1693–703. doi: 10.1056/NEJMoa1006448. [DOI] [PMC free article] [PubMed] [Google Scholar]
- 36.Rudin CM, Hann CL, Garon EB, Ribeiro de Oliveira M, Bonomi PD, Camidge DR, et al. Phase II study of single-agent navitoclax (ABT-263) and biomarker correlates in patients with relapsed small cell lung cancer. Clin Cancer Res. 2012;18:3163–9. doi: 10.1158/1078-0432.CCR-11-3090. [DOI] [PMC free article] [PubMed] [Google Scholar]
- 37.Warren KE. NMR spectroscopy and pediatric brain tumors. Oncologist. 2004;9:312–8. doi: 10.1634/theoncologist.9-3-312. [DOI] [PubMed] [Google Scholar]
- 38.Cerny T, Blair V, Anderson H, Bramwell V, Thatcher N. Pretreatment prognostic factors and scoring system in 407 small-cell lung cancer patients. Int J Cancer. 1987;39:146–9. doi: 10.1002/ijc.2910390204. [DOI] [PubMed] [Google Scholar]
- 39.Koukourakis MI, Giatromanolaki A, Sivridis E, Bougioukas G, Didilis V, Gatter KC, et al. Lactate dehydrogenase-5 (LDH-5) overexpression in non-small-cell lung cancer tissues is linked to tumour hypoxia, angiogenic factor production and poor prognosis. Br J Cancer. 2003;89:877–85. doi: 10.1038/sj.bjc.6601205. [DOI] [PMC free article] [PubMed] [Google Scholar]
- 40.Lee YJ, Cho A, Cho BC, Yun M, Kim SK, Chang J, et al. High tumor metabolic activity as measured by fluorodeoxyglucose positron emission tomography is associated with poor prognosis in limited and extensive stage small-cell lung cancer. Clin Cancer Res. 2009;15:2426–32. doi: 10.1158/1078-0432.CCR-08-2258. [DOI] [PubMed] [Google Scholar]
- 41.Walenta S, Schroeder T, Mueller-Klieser W. Lactate in solid malignant tumors: potential basis of a metabolic classification in clinical oncology. Curr Med Chem. 2004;11:2195–204. doi: 10.2174/0929867043364711. [DOI] [PubMed] [Google Scholar]
- 42.Walenta S, Wetterling M, Lehrke M, Schwickert G, Sundfor K, Rofstad EK, et al. High lactate levels predict likelihood of metastases, tumor recurrence, and restricted patient survival in human cervical cancers. Cancer Res. 2000;60:916–21. [PubMed] [Google Scholar]
Associated Data
This section collects any data citations, data availability statements, or supplementary materials included in this article.