Abstract
A simple and highly efficient technique for the analysis of lysophosphatidic acid (LPA) subspecies in human plasma is described. The streamlined sample preparation protocol furnishes the five major LPA subspecies with excellent recoveries. Extensive analysis of the enriched sample reveals only trace levels of other phospholipids. This level of purity not only improves MS analyses, but enables HPLC post-column detection in the visible region with a commercially available fluorescent phospholipids probe. Human plasma samples from different donors were analyzed using the above method and validated by ESI/MS/MS.
1 Introduction
Lysophosphatidic acid (LPA) is a signalling phospholipid implicated in many diseases including atherosclerosis, ischaemia perfusion injury,1 thrombosis, hypertension, and the initiation of intimal hyperplasia that accompanies vascular responses to injury.2,3 Recently, LPA has been found to promote proliferation and self-renewal in one population of stem cells,4 and it also effects the nervous system.5 It is involved in several cellular processes including proliferation, survival and migration. Wound healing and pathological conditions such as autoimmune disorders and tumor metastasis are also influenced by LPA.6–8 Elevated plasma LPA levels have been reported in patients with ovarian cancer.9–14 There is evidence suggesting that specific LPA subspecies (Fig. 1) are associated with ovarian cancer.10,12 The potential utility of LPA as an early stage biomarker for ovarian cancer, however, is unresolved after many years of studying this challenging analyte.
Fig. 1.
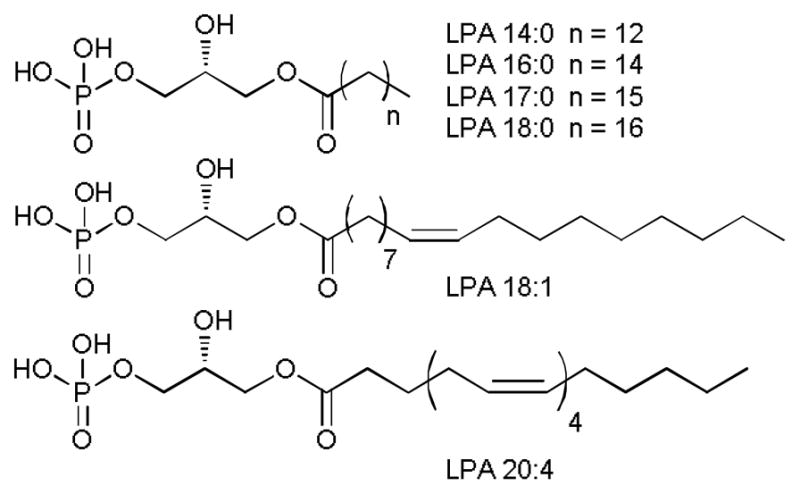
Structures of lysophosphatidic acids (LPAs).
To date, a number of separation and detection methods to determine LPA levels have been developed. In 1998, Xu et al.14 used a gas chromatography (GC) method to quantify total levels of LPA in plasma. Chen et al.15 used capillary electrophoresis (CE) to quantify individual LPAs with an indirect ultraviolet (UV) detection method. However, to separate LPA from other lipids before detection, many of these early studies employed two-dimensional thin layer chromatography (TLC).13–17 High performance liquid chromatography (HPLC) has been used to separate LPA. Solid supports have included normal phase (used in hydrophilic interaction chromatography), reversed phase (C-8, C-18) and diol-bonded phases. For example, Holland et al.18 used a diol-bonded phase to separate LPA from other phospholipid classes with evaporative light-scattering detection (ELSD). This avoids the 2-D TLC step; however, LPA recovery is 53.4% and there is no effort to separate LPA subspecies. LC-MS has also been used to quantify LPAs.19 More recently LC-MS/MS has become the method of choice.13,17,20 However, there are reports that LC-MS/MS methods currently have some drawbacks. First, not all endogenous matrix components are efficiently separated from the target analytes. This leads to matrix effects that hamper the efficiency and reproducibility of the ionization process.21–34 Phospholipids, especially glycerophosphocholines and lysophosphatidylcholines, are cited as the major causes of matrix effects due to their highly ionic character. This affects the electrospray MS source by either suppressing or enhancing ionization. This cannot be compensated for by adding internal standards, including isotopically labelled phospholipids. Wang et al.35 demonstrated that slight differences in retention times between the analyte and the isotopically-labelled internal standard causes differences in ion suppression between the two. In their study, the results vary up to 52% in peak areas from one plasma sample to another because of matrix effects resulting in up to 18.9 % of variation in concentration. Matrix effects may also result in retention time shifts, elevated baselines and divergent calibration curves. Second, conversion of lysophosphatidylcholine (LPC) and lysophosphatidylserine (LPS) to LPA occurs at the ion source of electrospray ionization tandem mass spectrometry. Shan et al.20 found that unidentified compounds in plasma produce the same parent-to-daughter ion transition as LPA in a direct flow injection LC-ESI/MS/MS method and could reduce the accuracy of the analysis of LPA. Zhao et al.36 later reported that LPC and LPS lose their respective choline or serine moieties at the ion source to generate LPA-like signals.
In order to overcome the limitations described above, we propose a straightforward method combining a modified Bligh and Dyer37 procedure with a solid phase extraction (SPE) protocol. This isolates plasma LPA effectively enough to permit the rapid detection of each of the subspecies via a standard HPLC fluorescence detector.
HPLC post-column fluorescence probe-assisted methods have been reported for phospholipids previously;38–40 however, they had not found utility in LPA analyses. A commercially available fluorescent probe 4-(4-(dihexadecylamino)styryl)-N-methylpyridinium iodide (DiA) is used in this study as a post-column reagent for the detection and quantification of LPA (Fig. 2). One may separate and quantify six individual LPA subspecies at physiological levels in plasma with a C-8 column in 15 minutes. In contrast to the currently used LC-MS methods, LPA levels obtained by optical method are not susceptible to ionization-related issues.
Fig. 2.

Structure of 4-(4-(Dihexadecylamino)styryl)-N-methylpyridinium iodide (DiA), used in the post-column fluorescence detection of LPA subspecies.
2 Experimental
2.1 Materials
All lysophosphatidic acids including 1-myristoyl-2-hydroxy-sn-glycero-3-phosphate (LPA 14:0), 1-palmitoyl-2-hydroxy-sn-glycero-3-phosphate (LPA 16:0), 1-heptadecanoyl-2-hydroxy-sn-glycero-3-phosphate (LPA 17:0), 1-stearoyl-2-hydroxy-sn-glycero-3-phosphate (LPA 18:0), 1-oleoyl-2-hydroxy-sn-glycero-3-phosphate (LPA 18:1) and 1-arachidonoyl-2-hydroxy-sn-glycero-3-phosphate (LPA 20:4) were purchased from Avanti Polar Lipids (Alabaster, AL, USA). 4-(4-(Dihexadecylamino)styryl)-N-methylpyridinium iodide (DiA) was purchased from AnaSpec (Fremont, CA, USA). HPLC grade MeOH was purchased from Fisher scientific. Ultra pure water was obtained from a Milli-Q™ system. Phosphoric acid and monosodium phosphate were purchased from Sigma-Aldrich (St. Louis, MO, USA). Waters OASIS™ HLB (3 cc, 60 mg, 30 μm) SPE cartridges were purchased from Waters Corporation (Milford, MA, USA). Lyophilized human plasma was purchased from Sigma-Aldrich. Human plasma was collected by Lampire Biological Laboratories Inc., from female donors, processed to obtain platelet-free plasma, and frozen at −80 °C.
2.2 Instrumentation
Fluorescence measurements were performed on a Cary Eclipse™ fluorescence spectrophotometer, and absorption spectra performed on a Cary 50™ UV-Vis spectrophotometer (Agilent Technologies). The HPLC system consists of a 1525 binary HPLC delivery system, a 2475 multi lambda fluorescence detector (Waters). A Luna™ C-8 (50 × 2 mm, 3 μm) column connected to a guard cartridge with 2.0 to 3.0 mm internal diameters (Phenomenex) was used for all the separations. The reagent is pumped by a reagent manager (Waters). The DiA solution and the liquid eluting from the column are merged through a metal mixing tee and delivered to the detector. The data is collected and processed with the Empower™ software suite (Waters). In the LC-ESI/MS/MS control method, LPAs were separated in an Accela UPLC system (Thermo Fisher, San Jose, CA) and detected via an LTQ-Orbitrap XL Discovery instrument (San Jose, CA, USA), equipped with an ESI ion max source.
2.3 Extraction and LPA enrichment procedure for plasma samples
Human plasma (0.8 mL) is mixed with 4 mL MeOH:CHCl3 2:1, and vortexed at 2000 rpm for 30 s. The mixture is incubated at 4 °C for 20 min, warmed to rt and centrifuged at 2000 rpm for 10 min. The supernatant is decanted from the precipitated proteins and extracted with 2 mL phosphate buffer saline (10 mM, pH 7.4) and vortexed at 2000 rpm for 30 s. The aqueous phase containing the LPAs is washed two times with 1.33 mL CHCl3 to remove the remaining neutral lipids. The aqueous layer is acidified to pH 2.0 with concentrated H3PO4 to protonate the LPAs to convert them to their neutral form.41 An SPE cartridge is preconditioned with 6 mL MeOH, followed by 3 mL H2O. The acidified LPAs solution is loaded onto the cartridge and rinsed with 3 mL H2O followed by 1 mL CHCl3. The SPE cartridge is dried by applying a N2 stream, and LPAs are eluted with 4 mL of MeOH. The solvent is evaporated and the residue is reconstituted in 0.16 mL MeOH:H2O 9:1.
2.4 Fluorescence determination of linearity and dynamic range for DiA:LPA 18:0 model system
Stock solutions of varying concentrations (0–150 μM) of LPA (18:0) were prepared in a mixture of MeOH:CHCl3 1:1. To avoid aggregation of the lipids, films of each sample were prepared by evaporation under an Ar stream, and the films reconstituted in MeOH. Choline chloride (final concentration 6.4 mM)42 was added before mixing with DiA (final concentration 2.67 μM) aqueous solution.
2.5 HPLC post-column procedure for plasma analysis
Samples (20 μL) obtained from the SPE purification step are injected and eluted with a 16:5 mixture of MeOH:phosphate buffer (50 mM, pH 2.5) through a Luna™ C-8 (50 × 2 mm, 3 μm) column equipped with a guard column. The end of the column is connected to a mixing tee allowing contact with the post-column reagent solution (DiA, 10 μM). The flow rate of the mobile phase is set to 0.32 mL/min and 0.62 mL/min for the post-column reagent. The entire procedure is performed at rt.
2.6 LC-ESI/MS/MS validation procedure for plasma analysis
Chromatography was performed on a Luna C-8 (50 × 2 mm, 3 μm) column at 40 °C with an injection volume of 10 μL. The mobile phase MeOH:HCOOH (10 mM, pH 2.5) 9:1 was delivered at a flow rate of 0.4 mL/min. Ions were created in negative ion mode by setting the sprayer voltage at 3.0 kV and the capillary temperature at 300 °C.
3 Results and discussion
3.1 Selection of the post-column reagent
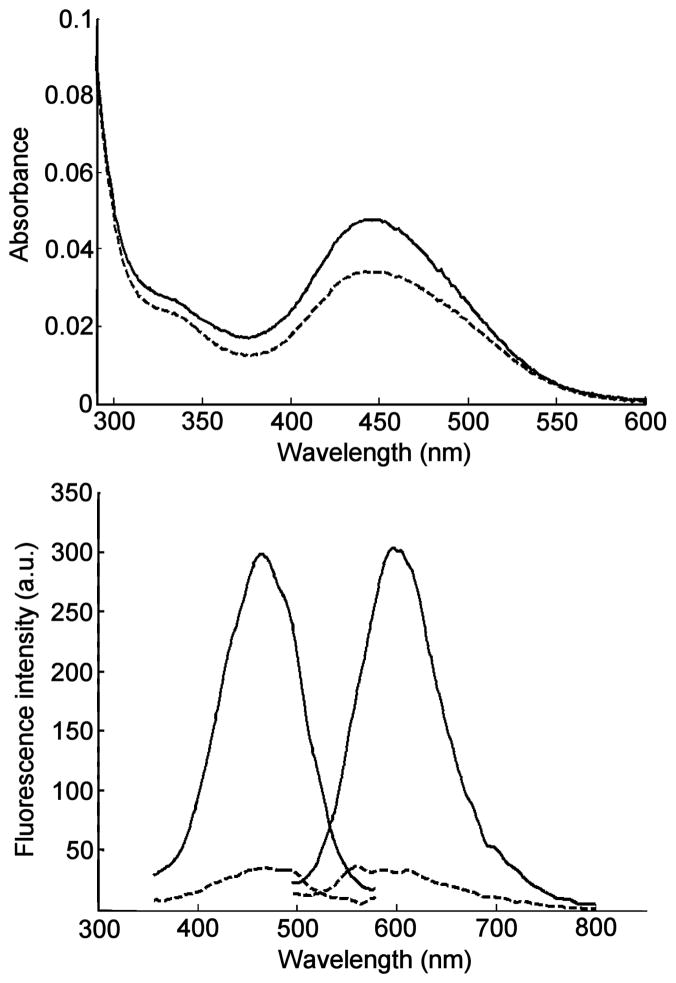
Typically, fluorescent probes used for the post-column detection of phospholipids rely on the formation of aggregated non-fluorescent π-stacked assemblies. These assemblies are disrupted, upon interaction with phospholipids, thereby restoring probe fluorescence. Examples of phosphoplipid-interacting probes include 2,5-bis-2-(5-tert-butyl)benzoxazolylthiophene (BBOT), 1,6-diphenyl-1,3,5-hexatriene (DPH) and 4-(4-dimethylamino-styryl)-1-hexadecylpyridinium (DSHP).39,43–46 They are mainly used for the detection and quantification of triglycerides, ceramides, glycosphingolipids and phosphatidyl cholines. In our hands, we found that both BBOT and DPH did not produce usable fluorescence emission enhancement in the presence of lysophosphatidic acids. Other fluorescent probes with amphiphilic properties were evaluated. 10-N-Nonyl acridine orange (NAO) has been used in the analysis of certain phospholipids such as cardiolipin (CL);38,47,48 however, it did not produce a useful spectral response in LPA-containing solutions. The amphiphilic cyanine-type probe 4-(4-(dihexadecylamino)styryl)-N-methylpyridinium iodide (DiA, Fig. 2) afforded the most promising results for LPA detection. These results can be explained considering the structural characteristics of BBOT and DPH, which are essentially non-polar probes, while LPA (and PA) are amphiphilic charged molecules. Better binding is expected to occur with DiA through electrostatic interactions between the quaternary ammonium moiety and the phosphate group of LPA. An aqueous probe solution (3 μM) responds to the addition of 10 μM LPA 18:0 with a 40% increase at 445 nm in absorption (Fig. 3). Importantly, the probe exhibits weak fluorescence in the absence of LPA and a 700% increase in fluorescence emission upon addition of 10 μM LPA (Fig. 3). It is notable that a relatively small increase in the extinction coefficient of DiA upon addition of LPA produced a dramatic increase in the fluorescence response. It is known that DiA exhibits minimal fluorescence in aqueous solution, yet the fluorescence emission has been found to increase greatly when bound to membrane environments.49 It follows that LPA bound DiA would exhibit similar increases in fluorescence.
Fig. 3.
Absorption spectra (top) and fluorescence spectra (bottom) of 3 μM aqueous solutions of DiA alone (dashed lines) and in the presence of 10 μM LPA 18:0 (solid lines). Excitation/emisson wavelengths: 470/590 nm.
3.2 Probe concentration and flow rate
Solutions of DiA with concentrations ranging from 3 to 20 μM were evaluated for LPA screening. The 10 μM DiA solution exhibited the best signal-to-noise (S/N) ratio, with a relatively low fluorescence background. The optimal reagent flow rate for post-column detection was found to be 0.62 mL/min. Higher flow rates resulted in relatively better signal to noise ratios, however, a trade-off was dilution of the sample. To best prepare a DiA solution in H2O, we found that DiA should be pre-dissolved in a small amount of acetone (1% of H2O volume).
3.3 Mobile phase composition, pH and effects of other additives
Common solvent mixtures (MeOH/H2O, MeCN/H2O) used for reversed-phase chromatography did not enable resolution of the targeted individual LPA subspecies. Subspecies separation was dependent on buffer pH and concentration. Of the buffer systems evaluated, phosphate afforded optimal separation and peak shapes. Optimal resolution was achieved using MeOH/50 mM phosphate buffer, pH 2.5 in a ratio 16/5. The parameters characterizing the chromatographic system for optimal separation of LPAs are reported in the electronic supplementary information (Tables S1–S3, ESI†).
3.4 Separation conditions
Of the reversed phase columns evaluated, the best results were obtained with a C-8 column with a particle size of 3 μm. A 100 × 2.1 mm column enabled separation of all LPAs but caused excessive back-pressure, and limited optimization of the composition/flow rate of mobile phase. A shorter 50 × 2 mm column enabled increased flow rate affording sharper peaks and significantly reduced analysis time (~ 15 min). The parameters characterizing the chromatographic system for optimal separation of LPAs are reported in the electronic supplementary information (Tables S1–S3, ESI†). Minimizing the length of the tubing between the HPLC column and post-column mixing tee is also critical for maximizing peak-to-peak resolution and limits of detection.
3.5 Detection parameters
Determination of the optimum excitation and emission wavelengths for the HPLC fluorescence detection system were performed as follows. The 3-D scanning mode in a Waters 2475 fluorescence detector allowed us to establish the optimal excitation and emission wavelengths that resulted in the highest signals and best peak shapes based on the wavelength dependence of the excitation source and PMT detector employed by the Waters 2475 fluorescence detection system. The largest LPA-induced fluorescence emission enhancement was observed to be near 570 nm when run in emission scanning mode with excitation at 470 nm chosen based upon the excitation spectra in Fig. 3. The detector gain was set to 100. Subsequently, the acquisition was set to excitation scanning mode (330–530 nm) keeping the emission wavelength constant (570 nm) allowing collection of an excitation spectrum. The peak excitation wavelength resulting in the greatest fluorescence enhancement was determined to be 450 nm. Consistent with Fig. 3, the post-column fluorescence response to LPA was much greater than absorption. Fixed excitation and emission wavelengths of 450 and 570 nm, respectively were used in all analyses and presented in all chromatograms. Fig. 4 shows a representative HPLC trace using the optimized separation of LPAs 14:0, 16:0, 17:0, 18:0, 18:1 and 20:4.
Fig. 4.
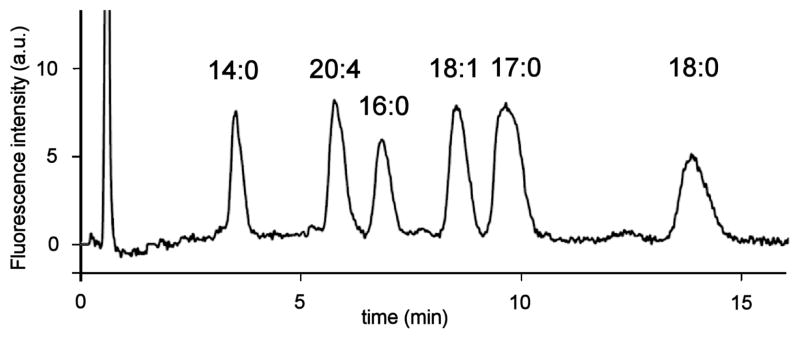
HPLC trace of a LPA mixture (10 μM LPA 14:0, 16:0, 18:0, 18:1, 20:4 and 20 μM LPA 17:0). Chromatographic conditions: column: Luna™ C-8, 3 μm, 50 × 2.0 mm; mobile phase: MeOH:phosphate buffer (50 mM, pH 2.5) 16:5; flow rate: 0.32 mL/min; injection volume: 20 μL; sample concentration: 10 μM in MeOH:H2O 9:1; post-column reagent: 10 μM DiA in H2O; reagent flow rate: 0.62 mL/min; excitation/emission wavelengths: 450/570 nm.
3.6 Linearity and dynamic range
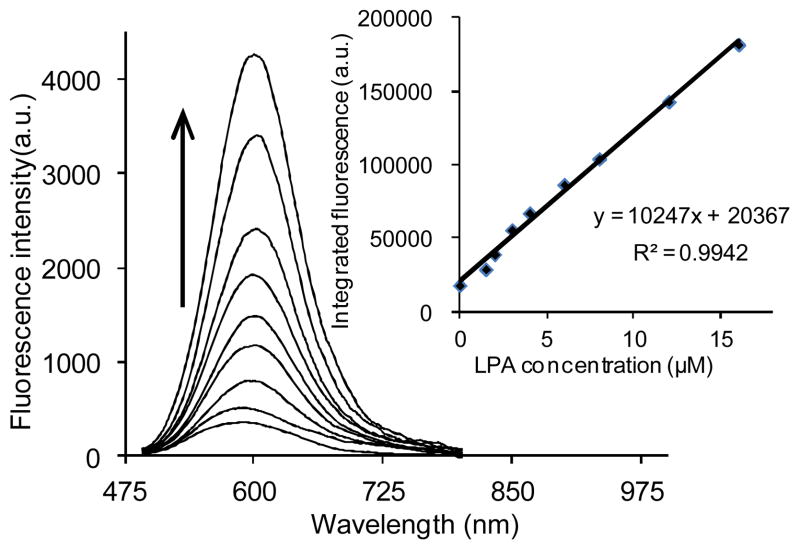
In order to determine the linear response of DiA to the presence of LPA, an initial evaluation using LPA (18:0) as a model compound was carried out using direct fluorescence spectrophotometry. Emission spectra were collected upon excitation at 470 nm. As shown in Fig. 5, the plot of maximum fluorescence emission vs. concentration confirms a good linear relationship (R2 = 0.994) between the fluorescence intensity and LPA (18:0) concentrations ranging from 1 to 16 μM.
Fig. 5.
Emission spectra and calibration curve (inset) of 2.67 μM DiA upon titration with LPA (18:0).
Based on the above results, we anticipated that a similar linear response would be obtained for the individual LPAs after reversed phase HPLC separation. After optimization of separation and detection conditions as described above, mixtures of LPAs with concentrations ranging from 0.5–40 μM were evaluated.
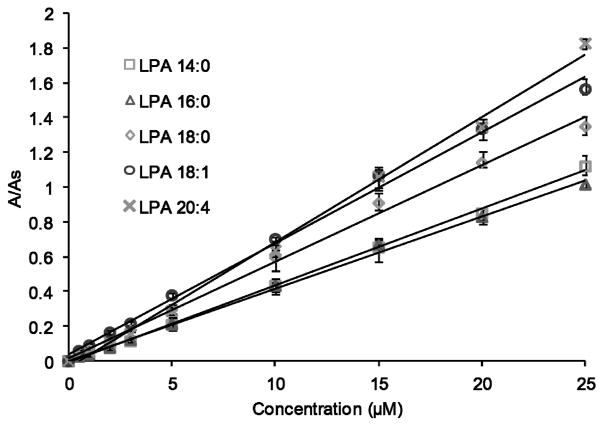
All LPAs showed a linear response in the 0.5–25 μM concentration range, although LPA 14:0, LPA 18:0 and LPA 18:1 exhibit linearity up to 40 μM. LPA (17:0), a non-natural LPA, was added to these mixtures as an internal standard for further quantification. Fig. 6 shows calibration curves for the individual LPA species evaluated in this study. Acceptable correlation factors (R2) were obtained for all LPA subspecies (Table 1). The limit of detection (LOD) for each was determined as the amount of analyte that corresponds to three times the signal of the background noise (Table 1).
Fig. 6.
Calibration curves of specific LPA subspecies obtained by HPLC-post column fluorescence detection. The area ratio is the peak area of individual LPAs divided by the peak area of the internal standard (LPA 17:0). Data points represent the average of 4 runs.
Table 1.
Data obtained from calibration curves for LPA species via the HPLC post-column method.
| LPA species | Retention time (min) | Linear range (μM) | R2 | LOD (μM) |
|---|---|---|---|---|
| 14:0 | 3.50 | 0–40 | 0.9962 | 0.147 |
| 20:4 | 5.56 | 0–25 | 0.9962 | 0.161 |
| 16:0 | 6.64 | 0–25 | 0.9963 | 0.173 |
| 18:1 | 8.35 | 0–40 | 0.9949 | 0.074 |
| 18:0 | 13.75 | 0–40 | 0.9943 | 0.272 |
3.7 Quantification of LPAs in human plasma
Biological concentrations of phospholipids in human plasma are higher than 3 mM.50 Among the several classes of phospholipids that are present in human plasma, LPAs represent a relatively very small fraction, and reported concentrations of total LPA vary. A generally reported range is 1–5 μM.51 This imposes a challenge for the selective isolation/enrichment of these analytes. Solid phase extraction (SPE) is a common method for the removal of potential interferences from biological samples and has been used for the isolation and enrichment of the different classes of phospholipids.52–54 Typical SPE materials include normal phase (e.g. silica), reversed phase (C-4, C-8 or C-18), ionic exchange and hybrid solid supports. The SPE enrichment procedure developed herein specifically for LPAs increases their concentration 5-fold. Several solid supports were initially evaluated in control mixtures containing LPA 14:0, 16:0, 17:0, 18:0, 18:1 and 20:4. Three different commercial reversed phase C-8 SPE cartridges, including Waters (Sep-pak™ Plus C-8, 200 mg, 37–55 μm), Supelco (Discovery™ DSC-8, 3 mL, 500 mg, 50 μm) and Waters (OASIS™ HLB 3 mL, 60 mg, 30 μm) were evaluated. The OASIS™ HLB proved optimal in terms of LPA recoveries (93–103%). As part of the method development, a liquid-liquid extraction prior to the SPE procedure was used to aid in removing relatively abundant and potentially interfering phospholipids. Typical procedures for lysophospholipids reported in the literature involve acidification of plasma prior to a liquid-liquid extraction.13,16 In our hands, this procedure gave very low LPA recoveries. We determined that pH control was critical to achieve the selective removal of interferences. At physiological pH, LPAs are negatively charged.41 Thus, performing the liquid-liquid extraction at pH 7.4 removes neutral phospholipids (e.g. LPC, LPS, etc.). The best recoveries were obtained when samples were loaded onto the SPE cartridge at pH 2.0. Selective elution of LPAs from the SPE cartridges was achieved using MeOH. This removes relatively hydrophobic species (e.g. phosphatidic acids). Table 2 shows the recoveries obtained for LPA control samples. In general, the recoveries are in the 74–94% range. In addition, we evaluated the effect of other phospholipids that have been identified to be present in human plasma and can result in potential false positives for LPAs. It is known that phospholipids are prone to either chemical or enzymatic hydrolysis. Phosphatidic acids (PAs) can be hydrolyzed enzymatically during sample storage, producing the corresponding LPAs, resulting in false positive LPA readings. Due to the acidic conditions in which the LPA solid phase extraction is carried out, we performed control experiments to investigate PA hydrolysis consisting in submitting PA standards to the whole extraction procedure. The resulting chromatograms did not show any signal within 1 hour, hence, none of PA 14:0, 16:0, 18:0 or 18:1 are hydrolyzed under the conditions used for the SPE-based LPA enrichment reported herein. Phosphatidylcholines (PCs) represent the major components of biological membranes and are also prone to hydrolysis producing the corresponding LPCs or PAs. Evaluation of the hydrolysis of PC in the same fashion as with PA resulted in the absence of any hydrolysis product confirming that PC or its hydrolysis products do not interfere in our sample protocol.
Table 2.
Recoveries of individual LPA species after SPE enrichment.
| LPA species | Measured by HPLC- post column (n = 3) | Measured by LC-ESI/MS/MS (n =3) | ||
|---|---|---|---|---|
|
| ||||
| Recovery (%) | σ (%) | Recovery (%) | σ (%) | |
| 14:0 | 93.5 | 4.8 | 93.7 | 2.9 |
| 20:4 | 73.8 | 4.3 | 76.6 | 1.2 |
| 16:0 | 94.2 | 5.4 | 95.7 | 4.6 |
| 18:1 | 76.9 | 4.9 | 77.6 | 1.7 |
| 17:0 | 85.1 | 3.8 | 85.0 | 4.6 |
| 18:0 | 76.9 | 4.4 | 73.1 | 2.4 |
An LC/MS full scan in both negative and positive modes was also used to determine the presence of non-LPA phospholipids in plasma to confirm the effectiveness of the new sample preparation extraction steps. A control mixture of 22 phospholipids was initially tested, and all lipids were detectable in negative and/or positive mode (Figs. S1–S4, ESI†). A plasma extract was tested using the same method. Results were compared to the LIPID MAPS Structure Database (LMSD).55 No potentially interfering lipids found in the database were detected in negative mode. Limited amounts of LPC 16:0 were detected in positive mode (see below). To further determine the extent of the interference from LPC, a LC-ESI/MS/MS method was used to detect LPC subspecies. The concentration was estimated to be 0.06, 0.01 and 0.05 μM for LPC 16:0, LPC 18:0 and LPC 18:1 respectively. This concentrations represent less than 0.1 % of the total LPCs in human plasma,56,57 thus LPC interference is not significant in our method.
3.8 Method validation via LC-ESI/MS/MS
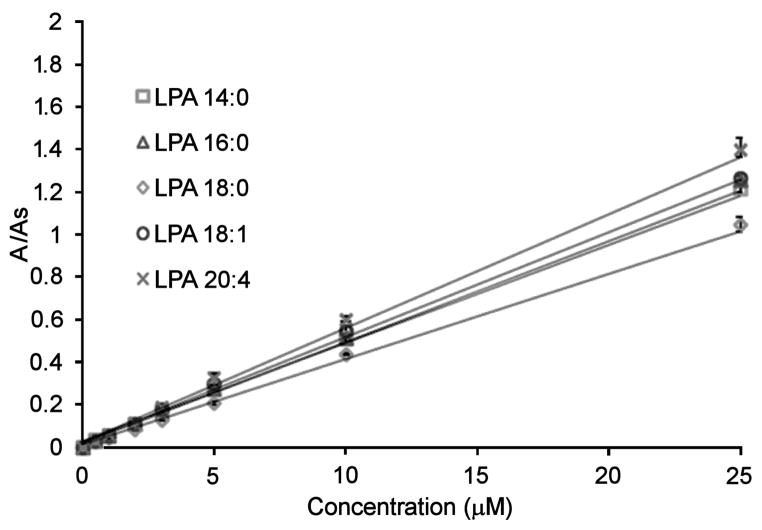
Mixtures of LPAs with concentrations ranging from 0.5–40 μM were evaluated using the LC-ESI/MS/MS method. We found a linear response for all the LPAs throughout this range. To compare to the new HPLC post-column method, we selected a working concentration range of 0.5–25 μM. LPA (17:0) was also used as an internal standard. Fig. 7 shows calibration curves for the individual LPA species evaluated with the LC-ESI/MS/MS method. Acceptable correlation factors (R2) were obtained for all the LPAs (Table 3). The limit of detection (LOD) for each LPA species was determined as the amount of analyte that corresponds to three times the signal of the background noise.
Fig. 7.
Calibration curves of LPAs using the LC-ESI/MS/MS method. The area ratio is the peak area of individual LPAs divided by the peak area of the internal standard (LPA 17:0).
Table 3.
Statistical values obtained for the individual LPA species in the LC-ESI/MS/MS method (n = 3).
| LPA species | Retention time (min) | Linear range (μM) | R2 | LOD (μM) |
|---|---|---|---|---|
| 14:0 | 6.30 | 0–40 | 0.9991 | 0.0067 |
| 20:4 | 7.55 | 0–40 | 0.9990 | 0.0099 |
| 16:0 | 8.29 | 0–40 | 0.9998 | 0.0123 |
| 18:1 | 9.10 | 0–40 | 0.9993 | 0.0066 |
| 18:0 | 11.22 | 0–40 | 0.9991 | 0.0156 |
Native LPA concentrations were determined in blind human plasma samples from five different donors using both the MS and the optical methods. In addition, to further evaluate other potential matrix interferences, these plasma samples were also spiked with 0.5 μM of each LPA species. Data from the samples collected from donors B, C, D and E is presented in the electronic supplementary information (Tables S4–S7, ESI†).
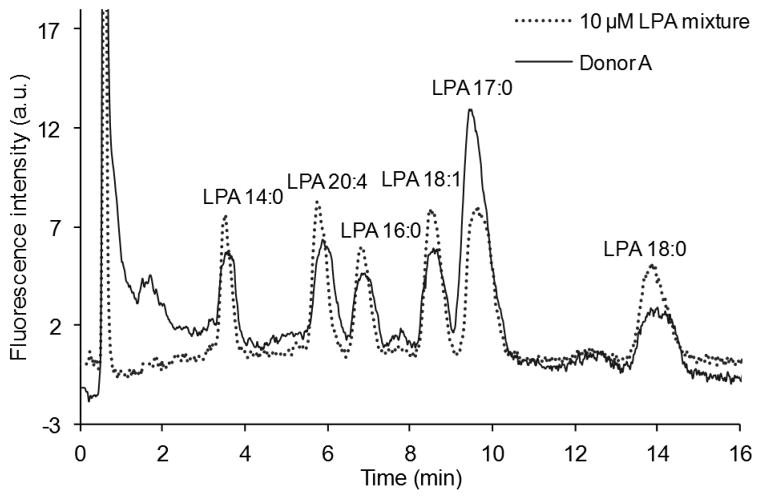
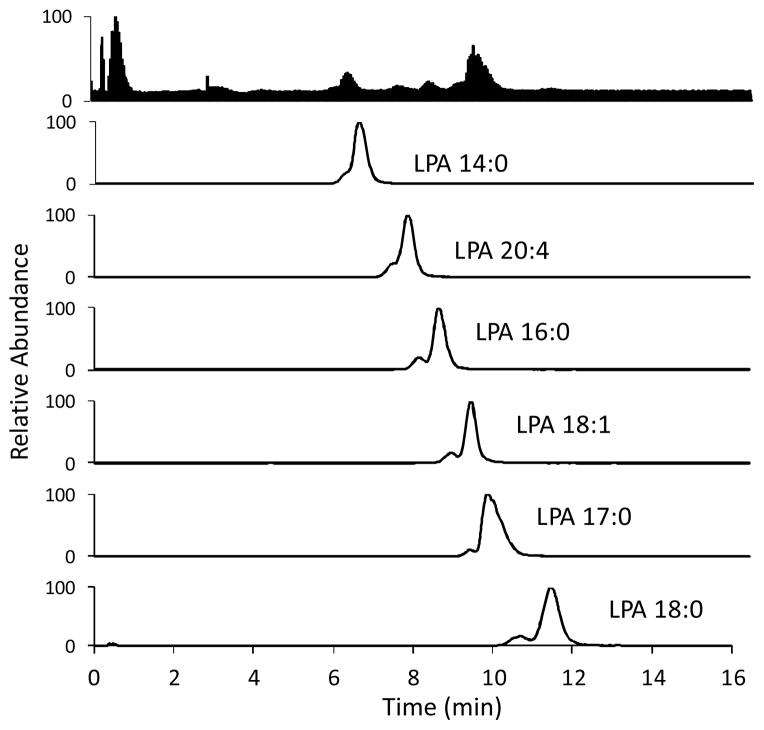
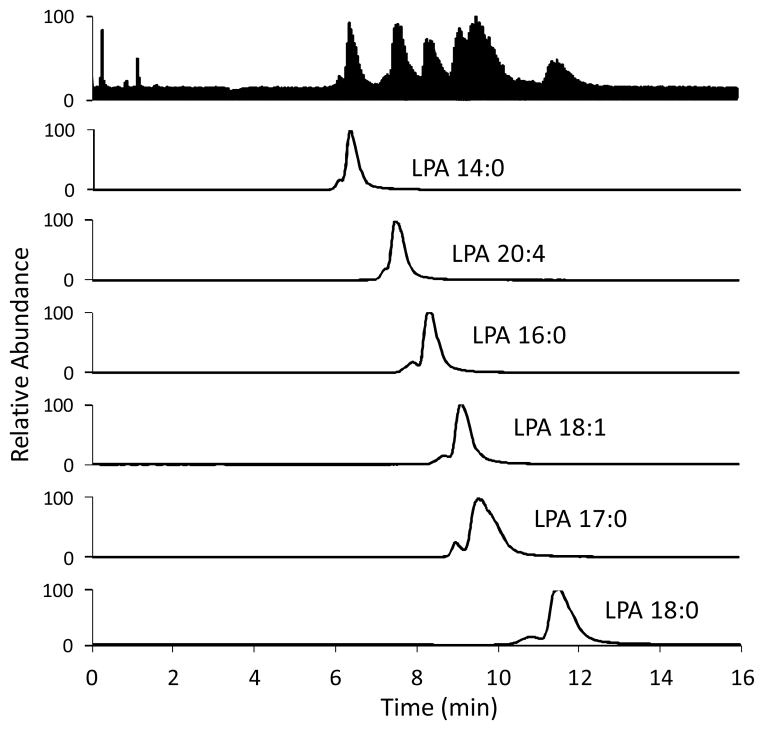
In each experiment, 800 μL of human plasma was used. All samples were prepared and analyzed in triplicate. Table 4 shows that LPAs concentrations determined by the LC-ESI/MS/MS and HPLC optical post-column techniques are in close agreement. Experimental recoveries were mostly higher in the HPLC-post column method. Representative HPLC traces are shown in Figs. 8–10.
Table 4.
Results for LPA analysis in human plasma (donor A) using the HPLC post-column fluorescence and LC-ESI/MS/MS methods.
| non-spiked μM (average, σ) | spiked with 0.5 μM LPA μM (average, σ) | Recovery (%) | ||||
|---|---|---|---|---|---|---|
|
| ||||||
| HPLC post-column | LC-ESI MS/MS | HPLC post-column | LC-ESI MS/MS | HPLC post-column | LC-ESI MS/MS | |
| LPA 14:0 | 0.90(0.01) | 0.92(0.01) | 1.31(0.09) | 1.33(0.05) | 82 | 82 |
| LPA 20:4 | 0.63(0.02) | 0.64(0.03) | 1.09(0.05) | 1.06(0.03) | 94 | 84 |
| LPA 16:0 | 0.76(0.03) | 0.74(0.01) | 1.19(0.09) | 1.19(0.01) | 86 | 90 |
| LPA 18:1 | 0.68(0.01) | 0.65(0.02) | 1.18(0.01) | 1.10(0.03) | 98 | 90 |
| LPA 18:0 | 0.56(0.02) | 0.60(0.01) | 1.06(0.03) | 1.05(0.01) | 100 | 88 |
|
| ||||||
| Total LPA | 3.53(0.03) | 3.56(0.02) | 5.83(0.22) | 5.73(0.11) | 92 | 87 |
Fig. 8.
Chromatograms of a mixture containing 10 μM of each LPA (LPA 14:0, 16:0, 17:0, 18:0, 18:1 and 20:4) and LPAs isolated from human plasma (donor A) using the post-column detection method.
Fig. 10.
LC-ESI/MS/MS traces of a plasma sample (donor A). Conditions are the same as in Fig. 9.
4 Conclusions
The optimized method for isolation and enrichment of LPA subspecies over other related phospholipids developed herein affords the five major LPAs (LPA 14:0, 16:0, 18:0, 18:1 and 20:4) with essentially no other potentially interfering phospholipids. Using this enriched mixture during analysis can eliminate matrix related errors caused by the presence of other phospholipids which can potentially generate LPAs upon hydrolysis. The HPLC separation of the individual LPA subspecies reported herein is relatively rapid (15 min), and non destructive optical detection simplifies the selection of detection instrumentation. Optical detection was validated using ESI/MS/MS detection, for which the optimized sample enrichment procedure reduced or completely eliminated ionization suppression effects which have been reported to complicate the measurement.
Supplementary Material
Fig. 9.
LC-ESI/MS/MS traces of a 10 μM standard mixture of LPAs. Column: Luna™ C-8 (50 × 2 mm, 3 μm) at 40 °C. Injection volume: 10 μL. Mobile phase: 9:1 MeOH:aqueous HCOOH (pH 2.5) at a flow rate of 0.4 mL/min. Parent and daughter ions were detected in the negative ion mode, sprayer voltage; 3.0 kV, capillary temperature at 300 °C.
Table 5.
Average recoveries of individual LPA species in plasma samples from all five donors.
| LPA species | Measured by HPLC- post column | Measured by LC-ESI/MS/MS | ||
|---|---|---|---|---|
|
| ||||
| Recovery (%) | σ | Recovery (%) | σ | |
| 14:0 | 88 | 0.07 | 89 | 0.10 |
| 20:4 | 91 | 0.11 | 90 | 0.15 |
| 16:0 | 91 | 0.07 | 98 | 0.14 |
| 18:1 | 101 | 0.15 | 99 | 0.09 |
| 18:0 | 104 | 0.06 | 106 | 0.12 |
| Total | 95 | 0.03 | 96 | 0.08 |
The individual LPA recoveries for all five donors are shown in table 5. Each of the determinations was carried out in triplicate.
Acknowledgments
This work was supported by the National Institutes of Health (grant R01CA136491) and the National Science Foundation (grant 0741993) for the purchase of the LTQ-Orbitrap Discovery.
Footnotes
Electronic Supplementary Information (ESI) available: Additional mass spectra, calculation of resolution and theoretical plates at various conditions for the separation of LPAs (tables S1–S3), and analysis of human plasma from other donors (tables S4–S7). See DOI: 10.1039/b000000x/
Contributor Information
Richard G. Moore, Email: RMoore@wihri.org.
Robert M. Strongin, Email: strongin@pdx.edu.
References
- 1.Feng L, Mills GB, Prestwich GD. Expert Opin Ther Pat. 2003;13:1619. [Google Scholar]
- 2.Teo ST, Yung YC, Herr DR, Chun J. IUBMB Life. 2009;61:791. doi: 10.1002/iub.220. [DOI] [PMC free article] [PubMed] [Google Scholar]
- 3.Smyth SS, Cheng HY, Miriyala S, Panchatcharam M, Morris AJ. Biochim Biophys Acta Mol Cell Biol Lipids. 2008;1781:563. doi: 10.1016/j.bbalip.2008.05.008. [DOI] [PMC free article] [PubMed] [Google Scholar]
- 4.Bieberich E. Neurochem Res. 2012;37:1208. doi: 10.1007/s11064-011-0698-5. [DOI] [PMC free article] [PubMed] [Google Scholar]
- 5.Frisca F, Sabbadini RA, Goldshmit Y, Pebay A. In: International Review of Cell and Molecular Biology. Jeon KW, editor. Vol. 296. Vol. 296. 2012. p. 273. [DOI] [PubMed] [Google Scholar]
- 6.Sims SM, Panupinthu N, Lapierre DM, Pereverzev A, Dixon SJ. Biochim Biophys Acta Mol Cell Biol Lipids. 2013;1831:109. doi: 10.1016/j.bbalip.2012.08.001. [DOI] [PubMed] [Google Scholar]
- 7.Mills GB, Moolenaar WH. Nat Rev Cancer. 2003;3:582. doi: 10.1038/nrc1143. [DOI] [PubMed] [Google Scholar]
- 8.Pua TL, Wang FQ, Fishman DA. Future Oncol. 2009;5:1659. doi: 10.2217/fon.09.120. [DOI] [PubMed] [Google Scholar]
- 9.Meleh M, Pozlep B, Mlakar A, Meden-Vrtovec H, Zupancic-Kralj L. J Chromatogr B. 2007;858:287. doi: 10.1016/j.jchromb.2007.08.008. [DOI] [PubMed] [Google Scholar]
- 10.Sedlakova I, Vavrova J, Tosner J, Hanousek L. Cesk Gynekol. 2006;71:312. [PubMed] [Google Scholar]
- 11.Shen Z, Wu M, Elson P, Kennedy AW, Belinson J, Casey G, Xu Y. Gynecol Oncol. 2001;83:25. doi: 10.1006/gyno.2001.6357. [DOI] [PubMed] [Google Scholar]
- 12.Sutphen R, Xu Y, Wilbanks GD, Fiorica J, Grendys EC, Jr, LaPolla JP, Arango H, Hoffman MS, Martino M, Wakeley K. Cancer Epidemiol Biomark Prev. 2004;13:1185. [PubMed] [Google Scholar]
- 13.Xiao Y, Schwartz B, Washington M, Kennedy A, Webster K, Belinson J, Xu Y. Anal Biochem. 2001;290:302. doi: 10.1006/abio.2001.5000. [DOI] [PubMed] [Google Scholar]
- 14.Xu Y, Shen Z, Wiper DW, Wu M, Morton RE, Elson P, Kennedy AW, Belinson J, Markman M, Casey G. JAMA, J Am Med Assoc. 1998;280:719. doi: 10.1001/jama.280.8.719. [DOI] [PubMed] [Google Scholar]
- 15.Chen YL, Xu Y. J Chromatogr B Biomed Sci Appl. 2001;753:355. doi: 10.1016/s0378-4347(00)00582-x. [DOI] [PubMed] [Google Scholar]
- 16.Xiao Y, Chen Y, Kennedy AW, Belinson J, Xu Y. Ann N Y Acad Sci. 2000;905:242. doi: 10.1111/j.1749-6632.2000.tb06554.x. [DOI] [PubMed] [Google Scholar]
- 17.Yoon HR, Kim H, Cho SH. J Chromatogr B. 2003;788:85. doi: 10.1016/s1570-0232(02)01031-0. [DOI] [PubMed] [Google Scholar]
- 18.Holland WL, Stauter EC, Stith BJ. J Lipid Res. 2003;44:854. doi: 10.1194/jlr.D200040-JLR200. [DOI] [PubMed] [Google Scholar]
- 19.Baker DL, Desiderio DM, Miller DD, Tolley B, Tigyi GJ. Anal Biochem. 2001;292:287. doi: 10.1006/abio.2001.5063. [DOI] [PubMed] [Google Scholar]
- 20.Shan L, Jaffe K, Li S, Davis L. J Chromatogr B. 2008;864:22. doi: 10.1016/j.jchromb.2008.01.031. [DOI] [PubMed] [Google Scholar]
- 21.Chin C, Zhang ZP, Karnes HT. J Pharm Biomed Anal. 2004;35:1149. doi: 10.1016/j.jpba.2004.01.005. [DOI] [PubMed] [Google Scholar]
- 22.Wang S, Cyronak M, Yang E. J Pharm Biomed Anal. 2007;43:701. doi: 10.1016/j.jpba.2006.08.010. [DOI] [PubMed] [Google Scholar]
- 23.Fu I, Woolf EJ, Matuszewski BK. J Pharm Biomed Anal. 1998;18:347. doi: 10.1016/s0731-7085(98)00048-x. [DOI] [PubMed] [Google Scholar]
- 24.Liu Y, Burkhalter R, Symowicz J, Chaffin K, Ellerbroek S, Stack MS. J Oncol. 2012;2012:501492. doi: 10.1155/2012/501492. [DOI] [PMC free article] [PubMed] [Google Scholar]
- 25.Shou WZ, Naidong W. Rapid Commun Mass Spectrom. 2003;17:589. doi: 10.1002/rcm.951. [DOI] [PubMed] [Google Scholar]
- 26.Mallet CR, Lu Z, Mazzeo JR. Rapid Commun Mass Spectrom. 2004;18:49. doi: 10.1002/rcm.1276. [DOI] [PubMed] [Google Scholar]
- 27.Ismaiel OA, Halquist MS, Elmamly MY, Shalaby A, Karnes HT. J Chromatogr B Analyt Technol Biomed Life Sci. 2007;859:84. doi: 10.1016/j.jchromb.2007.09.007. [DOI] [PubMed] [Google Scholar]
- 28.Schwalbe-Herrmann M, Willmann J, Leibfritz D. J Chromatogr A. 2010;1217:5179. doi: 10.1016/j.chroma.2010.05.014. [DOI] [PubMed] [Google Scholar]
- 29.Sedláková I, Vávrová J, Tošner J, Hanousek L. Clin Ovarian Cancer Other Gynecol Malig. 2010;3:41. [Google Scholar]
- 30.Shen JX, Motyka RJ, Roach JP, Hayes RN. J Pharm Biomed Anal. 2005;37:359. doi: 10.1016/j.jpba.2004.10.035. [DOI] [PubMed] [Google Scholar]
- 31.Dams R, Huestis MA, Lambert WE, Murphy CM. J Am Soc Mass Spectrom. 2003;14:1290. doi: 10.1016/S1044-0305(03)00574-9. [DOI] [PubMed] [Google Scholar]
- 32.Siess W, Zangl KJ, Essler M, Bauer M, Brandl R, Corrinth C, Bittman R, Tigyi G, Aepfelbacher M. Proc Natl Acad Sci U S A. 1999;96:6931. doi: 10.1073/pnas.96.12.6931. [DOI] [PMC free article] [PubMed] [Google Scholar]
- 33.Avery MJ. Rapid Commun Mass Spectrom. 2003;17:197. doi: 10.1002/rcm.895. [DOI] [PubMed] [Google Scholar]
- 34.Tigyi G, Parrill AL. Prog Lipid Res. 2003;42:498. doi: 10.1016/s0163-7827(03)00035-3. [DOI] [PubMed] [Google Scholar]
- 35.Matuszewski BK, Constanzer ML, Chavez-Eng CM. Anal Chem. 2003;75:3019. doi: 10.1021/ac020361s. [DOI] [PubMed] [Google Scholar]
- 36.Zhao Z, Xu Y. J Lipid Res. 2010;51:652. doi: 10.1194/jlr.D001503. [DOI] [PMC free article] [PubMed] [Google Scholar]
- 37.Bligh EG, Dyer WJ. Can J Biochem Physiol. 1959;37:911. doi: 10.1139/o59-099. [DOI] [PubMed] [Google Scholar]
- 38.Kaewsuya P, Danielson N, Ekhterae D. Anal Bioanal Chem. 2007;387:2775. doi: 10.1007/s00216-007-1135-0. [DOI] [PubMed] [Google Scholar]
- 39.Kitsos M, Gandini C, Massolini G, De Lorenzi E, Caccialanza G. J Chromatogr A. 1991;553:1. doi: 10.1016/s0021-9673(01)88464-8. [DOI] [PubMed] [Google Scholar]
- 40.Postle AD. J Chromatogr B Biomed Sci Appl. 1987;415:241. doi: 10.1016/s0378-4347(00)83216-8. [DOI] [PubMed] [Google Scholar]
- 41.Kooijman EE, Carter KM, van Laar EG, Chupin V, Burger KN, de Kruijff B. Biochemistry. 2005;44:17007. doi: 10.1021/bi0518794. [DOI] [PubMed] [Google Scholar]
- 42.Caudron E, Zhou JY, Chaminade P, Baillet A, Prognon P. J Chromatogr A. 2005;1072:149. doi: 10.1016/j.chroma.2005.02.028. [DOI] [PubMed] [Google Scholar]
- 43.Ibrahim H, Caudron E, Kasselouri A, Prognon P. Molecules. 2010;15:352. doi: 10.3390/molecules15010352. [DOI] [PMC free article] [PubMed] [Google Scholar]
- 44.Bernhard W, Linck M, Creutzburg H, Postle AD, Arning A, Martin-Carrera I, Sewing KF. Anal Biochem. 1994;220:172. doi: 10.1006/abio.1994.1315. [DOI] [PubMed] [Google Scholar]
- 45.Gebhardt DO, Soederhuizen W, Feyen JH. Ann Clin Biochem. 1985;22:321. doi: 10.1177/000456328502200317. [DOI] [PubMed] [Google Scholar]
- 46.Zhao W, Liu W, Zhang W, Zeng L, Fan Z, Wu J, Wang P. Analyst. 2012;137:1853. doi: 10.1039/c2an16153b. [DOI] [PubMed] [Google Scholar]
- 47.Garcia-Fernandez MI, Ceccarelli D, Muscatello U. Anal Biochem. 2004;328:174. doi: 10.1016/j.ab.2004.01.020. [DOI] [PubMed] [Google Scholar]
- 48.Gohil VM, Gvozdenovic-Jeremic J, Schlame M, Greenberg ML. Anal Biochem. 2005;343:350. doi: 10.1016/j.ab.2005.04.039. [DOI] [PubMed] [Google Scholar]
- 49.Loew L, Simpson L. Biophys J. 1981;34:353. doi: 10.1016/S0006-3495(81)84854-0. [DOI] [PMC free article] [PubMed] [Google Scholar]
- 50.Khaw KT, Friesen MD, Riboli E, Luben R, Wareham N. PLoS Med. 2012;9:e1001255. doi: 10.1371/journal.pmed.1001255. [DOI] [PMC free article] [PubMed] [Google Scholar]
- 51.Bese T, Barbaros M, Baykara E, Guralp O, Cengiz S, Demirkiran F, Sanioglu C, Arvas M. J Gynecol Oncol. 2010;21:248. doi: 10.3802/jgo.2010.21.4.248. [DOI] [PMC free article] [PubMed] [Google Scholar]
- 52.Chen YL, Xu Y. J Liq Chromatogr Relat Technol. 2002;25:843. [Google Scholar]
- 53.Chua SC, Tan CP, Lai OM, Long K, Mirhosseini H, Baharin BS. Eur J Lipid Sci Technol. 2008;110:334. [Google Scholar]
- 54.Perez-Palacios T, Ruiz J, Antequera T. Food Chem. 2007;102:875. [Google Scholar]
- 55.Sud M, Fahy E, Cotter D, Brown A, Dennis EA, Glass CK, Merrill AH, Murphy RC, Raetz CR, Russell DW. Nucleic Acids Res. 2007;35:D527. doi: 10.1093/nar/gkl838. [DOI] [PMC free article] [PubMed] [Google Scholar]
- 56.Zhu C, Dane A, Spijksma G, Wang M, van der Greef J, Luo G, Hankemeier T, Vreeken RJ. J Chromatogr A. 2012;1220:26. doi: 10.1016/j.chroma.2011.11.034. [DOI] [PubMed] [Google Scholar]
- 57.Takatera A, Takeuchi A, Saiki K, Morisawa T, Yokoyama N, Matsuo M. J Chromatogr, B: Anal Technol Biomed Life Sci. 2006;838:31. doi: 10.1016/j.jchromb.2006.03.006. [DOI] [PubMed] [Google Scholar]
Associated Data
This section collects any data citations, data availability statements, or supplementary materials included in this article.


