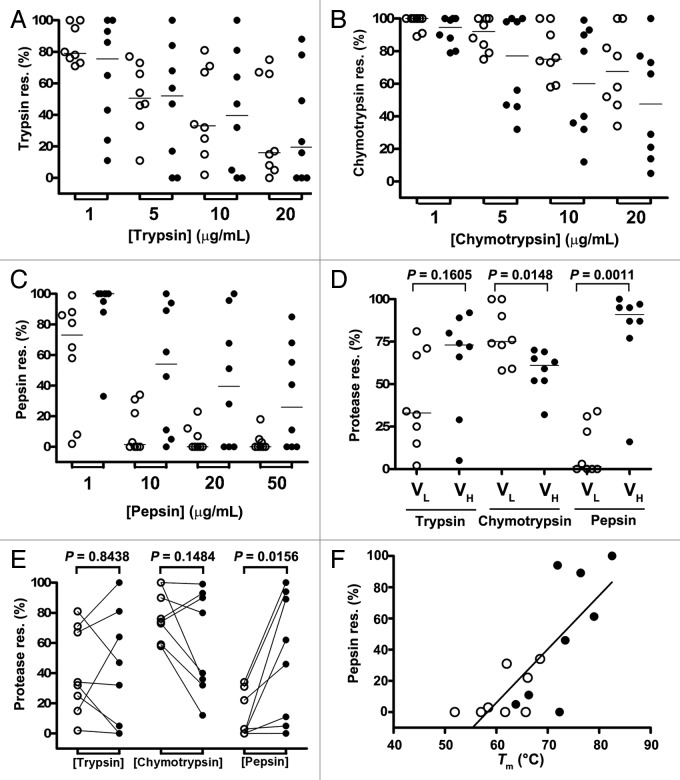
Figure 6. GI protease resistance profiles for human VLs and VHs. (A), (B), (C) Trypsin, chymotrypsin, and pepsin resistance (res.) of human VLs (open circles) and their corresponding Cys mutants (closed circles). (D) Graph comparing VLs to VHs in terms of resistance to trypsin, chymotrypsin, and pepsin at 10 µg/mL protease concentrations. Horizontal lines in graphs (A)–(D) represent medians. (E) Graph showing trypsin, chymotrypsin, and pepsin resistance of human VLs (open circles) and their corresponding Cys mutants (closed circles) in pair-wise manner at 10 µg/mL protease concentrations (see also Table 1). Lines connect protease resistances value for each VL to that for its corresponding mutant version. The P values in graphs (D) and (E) were obtained by the Mann-Whitney test (two-tailed) and Wilcoxon matched-pairs signed rank test (two-tailed), respectively, using GraphPad Prism (GraphPad Software). (F) A correlation graph of pepsin resistance vs. Tm (Pearson’s correlation, 0.7807; P = 0.0004, r2 = 0.6095). Data are from digestion experiments performed at 10 µg/mL pepsin concentrations. Open circles, wild-type VLs; closed circles, mutant VLs.

An official website of the United States government
Here's how you know
Official websites use .gov
A
.gov website belongs to an official
government organization in the United States.
Secure .gov websites use HTTPS
A lock (
) or https:// means you've safely
connected to the .gov website. Share sensitive
information only on official, secure websites.
