

Abstract
To assess recent trends in fracture incidence from all causes at all skeletal sites, we used the comprehensive (inpatient and outpatient) data resources of the Rochester Epidemiology Project to estimate rates for Olmsted County, Minnesota, residents in 2009–11, compared to similar data from 1989–91. During the three-year study period, 2009–11, 3549 residents ≥ 50 years of age experienced 5244 separate fractures. The age- and sex-adjusted (to the 2010 United States white population) incidence of any fracture was 2704 per 100,000 person-years (95% CI 2614–2793) and that for all fractures was 4017 per 100,000 (95% CI 3908–4127). Fracture incidence increased with age in both sexes, but age-adjusted rates were 49% greater among the women. Overall, comparably adjusted fracture incidence rates increased by 11% (from 3627 to 4017 per 100,000 person-years; p = 0.008) between 1989–91 and 2009–2011. This was mainly due to a substantial increase in vertebral fractures (+47% for both sexes combined), which was partially offset by a decline in hip fractures (−25%) among the women. There was also a 26% reduction in distal forearm fractures among the women; an increase in distal forearm fractures among men age 50 years and over was not statistically significant. The dramatic increase in vertebral fractures, seen in both sexes and especially after age 75 years, was attributable in part to incidentally-diagnosed vertebral fractures. However, the fall in hip fracture incidence, observed in most age-groups, continues the steady decline observed among women in this community since 1950. More generally, these data indicate that the dramatic increases in the incidence of fractures at many skeletal sites that were observed decades ago have now stabilized.
Keywords: EPIDEMIOLOGY, FRACTURE, INCIDENCE, OSTEOPOROSIS, SECULAR TRENDS
Introduction
Age-related fractures are projected to increase nationally from 2.1 million in 2005 to over 3 million fractures in 2025, solely on the basis of growth in the elderly population most at risk.(1) However, changes in the actual incidence of specific fractures could aggravate or, instead, ameliorate this trend. For example, there is ample evidence that the incidence of hip fractures is declining in the United States,(2–6) as it has been in Olmsted County, Minnesota, since 1950 in women and 1975 in men.(7) Unfortunately, there are no recent data on secular trends in incidence that include all fracture types and relevant age-groups. Consequently, estimates of the overall burden of fractures in different populations have often had to rely on skeletal site-specific incidence rates reported from Olmsted County in 1989–91.(8) These earlier data are now outdated, especially since fracture risk may have been influenced in the interim by important intervening events, e.g., the widespread availability of oral bisphosphonates after 1995,(9) a reduction in the use of estrogen therapy following publication of the Women’s Health Initiative Trial in 2002,(10) and effects of the ongoing epidemic of obesity in this country.(11) To provide more current information on fracture burden in the community, we updated our earlier study to estimate skeletal site-specific and overall fracture incidence in a population-based descriptive study among Olmsted County residents ≥50 years of age in 2009–11 and to test for secular trends at each fracture site since 1989–91.
Methods
Study population
Population-based epidemiologic research can be conducted in Olmsted County because medical care is virtually self-contained within the community, and there are relatively few providers.(12) Most orthopedic care, for example, is provided by the Mayo Clinic, which has maintained a common medical record system with its two large hospitals in the community (Saint Marys and Rochester Methodist) for over 100 years. Mayo Clinic records thus contain both inpatient and outpatient data. The diagnoses and surgical procedures recorded in these records are indexed, including the diagnoses made for outpatients seen in office or clinic consultations, emergency room visits or nursing home care, as well as diagnoses recorded for hospital inpatients, at autopsy examination or on death certificates. Medical records of the other providers who serve the local population, most notably the Olmsted Medical Center, are also indexed and retrievable. Thus, the details of almost all of the medical care provided to the residents of Olmsted County are available for study.(13)
Fracture ascertainment
Using this unique medical records linkage system (the Rochester Epidemiology Project), we identified all fractures that occurred among Olmsted County residents 50 years old and over during the 3-year period, 2009–11. Only a minority of fracture patients is hospitalized, but it was possible in our data system to identify those treated solely on an outpatient basis. The complete (inpatient and outpatient) community medical records were reviewed by trained nurse abstractors for all residents with any diagnosis attributable to rubrics 800 through 829 in the 9th International Classification of Diseases.(14) Of 4422 potential patients, 873 were excluded either because no fracture was found (445), the fracture occurred before 2009 or after 2011 (307), the patient was not actually an Olmsted County resident at the time of fracture (99) or for some other reason (10); only 12 patients had to be excluded because they had not provided an authorization for review of their medical records for research in accordance with Minnesota privacy law.(15) All fractures were radiographically confirmed, but the original X-rays were not reviewed. Thus, the diagnosis of vertebral fracture, whether symptomatic or not, was accepted on the basis of a radiologist’s report of compression or collapse of one more thoracic or lumbar vertebrae. The indexing system is very comprehensive, and we searched for fracture diagnoses made by any provider in any setting (i.e., emergency room, hospital, follow-up outpatient care, nursing home) from 1 January 2009 through 31 December 2011. Fracture ascertainment is believed to be complete except for vertebral and rib fractures, some of which are never recognized clinically.(16) Fractures were classified by etiology according to information about each event that was recorded in the medical record: those caused by a specific pathological process (e.g., metastatic malignancy) as determined by the attending physicians, those resulting from severe trauma (e.g., motor vehicle accidents or falls from greater than standing height) and those due to no more than moderate trauma (by convention, equivalent to a fall from standing height or less).
Statistical analysis
In calculating incidence rates, the entire population of Olmsted County age ≥50 years was considered to be at risk. Denominator age- and sex-specific person-years (p-y) were estimated from an ongoing enumeration of Olmsted County residents by the Rochester Epidemiology Project.(17) Incidence rates were summarized by 5-year age categories, but total incidence rates were calculated using 1-year intervals. To obtain some sense of variability, it was assumed that, given a fixed number of p-y, the number of fracture cases follows a Poisson distribution; this allowed for the estimation of standard errors and the calculation of 95% confidence intervals (95% CI) for the incidence rates. Incidence rates, including those from 1989–91,(18) were directly age- and/or age- and sex-adjusted to the population distribution of United States whites in 2010. The standard errors and confidence intervals for the adjusted rates were based on the same assumption as above. To test the null hypothesis of no change in fracture incidence between 1989–91 and 2009–11, we used generalized linear models, assuming a Poisson error structure (19) and correcting for overdispersion when necessary. Such models fit the natural logarithms of the crude incidence rate as linear combinations of gender and age. Models were developed separately for each type of fracture.
Results
Over the 3-year study period, 2009–11, 3549 Olmsted County residents 50 years of age or older experienced one or more fractures, for an overall age- and sex-adjusted incidence of 2704 per 100,000 p-y (95% CI 2614–2793), or almost 3% of the older population per year. There were 2345 women and 1204 men, and 97% were white in keeping with the racial composition of the community in this age-group. The age-adjusted annual incidence among women was 3199 per 100,000 (95% CI 3068–3330) compared to 2107 per 100,000 (95% CI 1984–2230) among men, for a female:male ratio of age-adjusted incidence rates of 1.5:1. Altogether, 2508 subjects (70% of the women and 72% of the men) experienced a single fracture, but 663 of them had two fractures, 225 had three, and 153 had four or more fractures each. A total of 5244 different fractures were observed during the study period, and the incidence of fractures, as opposed to unique individuals, was 4017 per 100,000 p-y (95% CI 3908–4127). There were 3468 fractures among Olmsted County women compared to 1776 among the men, and the age-adjusted incidence of all fractures was 49% greater among the women (4698 vs. 3145 per 100,000 p-y). In both sexes, the incidence of all fractures rose with age, peaking at 15,415 and 9302 per 100,000 p-y for women and men, respectively, in the age-group 85 years and over.
As delineated in Table 1, 33% of all fractures resulted from severe trauma. This included motor vehicle accidents in 308, falls from greater than standing height in 586, recreational mishaps in 228 and occupational and other injuries in 631. The age-adjusted incidence of fractures due to significant trauma was similar in women and men (1325 per 100,000 p-y; 95% CI 1240–1409 vs. 1305 per 100,000 p-y; 95% CI 1213–1396), as was the incidence of pathologic fractures (87 per 100,000 p-y; 95% CI 65–109 vs. 90 per 100,000 p-y; 95% CI 65–115). Altogether, 111 fractures (2% of the total) were due to a specific local pathological process (mostly prostate cancer, lung cancer or multiple myeloma in the men and breast cancer or multiple myeloma in the women). Of the 3156 fractures attributed to minimal or moderate trauma, no specific precipitating event was recognized in 1079, i.e., fractures that occurred in the course of daily activities and those found incidentally; such fractures accounted for 71% of fractures of the thoracic/lumbar vertebrae. However, the single largest cause of fracture was a fall from a standing height or less in 2077 patients. The incidence of fractures due to no more than moderate trauma was much greater among the women than the men (3287 per 100,000 p-y; 95% CI 3155–3418 vs. 1750 per 100,000 p-y; 95% CI 1633–1868).
Table 1.
Distribution of All Fractures by Skeletal Site and Cause Among Olmsted County, Minnesota, Residents ≥ 50 Years of Age, 2009–11
| Fracture site | Fracture cause |
|||||||||
|---|---|---|---|---|---|---|---|---|---|---|
| Severe trauma | Moderate trauma | Pathological | Uncertain | All causes | ||||||
| n | %a | n | %a | n | %a | n | %a | n | %b | |
| Skull/face | 75 | 42.1% | 100 | 56.2% | 0 | 0.0% | 3 | 1.7% | 178 | 3.4% |
| Hands/fingers | 216 | 58.9% | 135 | 36.8% | 1 | 0.3% | 15 | 4.1% | 367 | 7.0% |
| Distal forearm | 122 | 28.4% | 303 | 70.5% | 1 | 0.2% | 4 | 0.9% | 430 | 8.2% |
| Proximal humerus | 48 | 23.0% | 155 | 74.2% | 5 | 2.4% | 1 | 0.5% | 209 | 4.0% |
| Other arm | 68 | 38.0% | 109 | 60.9% | 1 | 0.6% | 1 | 0.6% | 179 | 3.4% |
| Clavicle/scapula/sternum | 95 | 58.6% | 58 | 35.8% | 2 | 1.2% | 7 | 4.3% | 162 | 3.1% |
| Ribs | 220 | 40.8% | 228 | 42.3% | 19 | 3.5% | 72 | 13.4% | 539 | 10.3% |
| Thoracic/lumbar vertebrae | 149 | 12.1% | 1030 | 83.4% | 43 | 3.5% | 13 | 1.1% | 1235 | 23.6% |
| Cervical vertebrae | 60 | 44.1% | 64 | 47.1% | 8 | 5.9% | 4 | 2.9% | 136 | 2.6% |
| Pelvis | 50 | 18.3% | 194 | 71.1% | 18 | 6.6% | 11 | 4.0% | 273 | 5.2% |
| Proximal femur | 48 | 12.7% | 315 | 83.3% | 6 | 1.6% | 9 | 2.4% | 378 | 7.2% |
| Other leg | 252 | 42.8% | 307 | 52.1% | 6 | 1.0% | 24 | 4.1% | 589 | 11.2% |
| Feet/toes | 350 | 61.5% | 158 | 27.8% | 1 | 0.2% | 60 | 10.5% | 569 | 10.9% |
| All sites | 1753 | 33.4% | 3156 | 60.2% | 111 | 2.1% | 224 | 4.3% | 5244 | |
Percentage (%) of each type of fracture.
Percentage (%) of total.
Age- and sex-specific incidence rates for each of the different fracture sites are shown in Table 2. Age-adjusted fracture rates were significantly greater among women than men at most fracture sites (i.e., distal forearm, shaft/proximal forearm, shaft/distal humerus, proximal humerus, thoracic/lumbar vertebrae, pelvis, proximal femur, shaft/distal femur, patella, tibia/fibula, ankle and feet/toes). At all of these sites except the proximal forearm, tibia/fibula, ankle and feet, there was a strong age-related increase in incidence among both sexes; there was also an increase in age-specific rates for shaft/distal femur fractures among the women but not the men. Age-adjusted rates were significantly greater in men than women only for fractures of the clavicle/scapula/sternum and ribs.
Table 2.
Incidencea of All Fractures by Skeletal Site Among Olmsted County, Minnesota, Residents, ≥ 50 Years of Age, 2009–11, by Sex and Age-Group
| Age-group | Skull/face | Cervical spine | Hands/fingers | Distal forearm | Proximal forearm | Shaft/distal humerus | Proximal humerus | Clavicle/scapula/sternum | Ribs | Vertebrae | Pelvis | Proximal femur | Shaft/distal femur | Patella | Tibia/fibula | Ankle | Feet/toes | All sites |
|---|---|---|---|---|---|---|---|---|---|---|---|---|---|---|---|---|---|---|
| Men | ||||||||||||||||||
| 50–54 | 183 | 72 | 379 | 98 | 59 | 13 | 39 | 118 | 346 | 255 | 39 | 46 | 59 | 13 | 52 | 170 | 307 | 2247 |
| 55–59 | 71 | 47 | 292 | 126 | 79 | 0 | 47 | 150 | 300 | 245 | 32 | 16 | 16 | 0 | 110 | 126 | 174 | 1830 |
| 60–64 | 64 | 54 | 278 | 107 | 64 | 11 | 86 | 150 | 375 | 396 | 32 | 32 | 0 | 0 | 21 | 129 | 214 | 2014 |
| 65–69 | 146 | 119 | 159 | 159 | 93 | 0 | 119 | 132 | 357 | 622 | 132 | 106 | 26 | 40 | 66 | 159 | 159 | 2594 |
| 70–74 | 84 | 101 | 152 | 152 | 84 | 0 | 51 | 152 | 321 | 843 | 51 | 186 | 0 | 17 | 34 | 152 | 84 | 2463 |
| 75–79 | 138 | 276 | 299 | 230 | 69 | 46 | 161 | 115 | 552 | 1450 | 138 | 598 | 69 | 23 | 138 | 184 | 230 | 4718 |
| 80–84 | 434 | 186 | 155 | 279 | 248 | 0 | 155 | 217 | 1208 | 2447 | 310 | 774 | 31 | 124 | 31 | 279 | 93 | 6968 |
| ≥ 85 | 465 | 349 | 155 | 310 | 39 | 116 | 349 | 349 | 1279 | 3140 | 543 | 1473 | 116 | 0 | 116 | 194 | 310 | 9302 |
| Subtotalb | 160 | 116 | 261 | 152 | 81 | 15 | 95 | 156 | 467 | 798 | 110 | 247 | 33 | 19 | 69 | 161 | 205 | 3145 |
| Women | ||||||||||||||||||
| 50–54 | 41 | 23 | 243 | 284 | 99 | 29 | 87 | 35 | 156 | 145 | 58 | 52 | 29 | 29 | 110 | 307 | 585 | 2313 |
| 55–59 | 101 | 14 | 304 | 341 | 123 | 22 | 101 | 72 | 196 | 348 | 72 | 51 | 7 | 58 | 138 | 377 | 783 | 3109 |
| 60–64 | 82 | 36 | 200 | 547 | 109 | 64 | 210 | 18 | 264 | 592 | 182 | 73 | 55 | 55 | 82 | 337 | 711 | 3616 |
| 65–69 | 108 | 84 | 288 | 467 | 156 | 0 | 216 | 96 | 252 | 719 | 96 | 168 | 84 | 36 | 144 | 348 | 396 | 3656 |
| 70–74 | 177 | 148 | 266 | 428 | 103 | 30 | 266 | 89 | 502 | 1269 | 369 | 398 | 44 | 89 | 177 | 221 | 472 | 5046 |
| 75–79 | 268 | 134 | 192 | 709 | 115 | 77 | 326 | 153 | 556 | 2205 | 307 | 518 | 173 | 58 | 77 | 326 | 422 | 6616 |
| 80–84 | 195 | 173 | 412 | 802 | 65 | 22 | 260 | 238 | 737 | 3164 | 910 | 910 | 130 | 87 | 152 | 325 | 693 | 9274 |
| ≥ 85 | 243 | 562 | 487 | 805 | 243 | 225 | 730 | 375 | 1311 | 4926 | 1611 | 2323 | 243 | 150 | 94 | 412 | 674 | 15,415 |
| Subtotalb | 120 | 96 | 279 | 475 | 121 | 45 | 213 | 94 | 366 | 1092 | 280 | 327 | 67 | 59 | 120 | 331 | 615 | 4698 |
| Totalc | 136 | 106 | 276 | 328 | 103 | 32 | 161 | 124 | 415 | 968 | 211 | 294 | 53 | 41 | 95 | 251 | 423 | 4017 |
Incidence per 100,000 person-years.
Incidence per 100,000 person-years using one year age intervals directly age-adjusted to the population structure of 2010 United States whites.
Incidence per 100,000 person-years using one year age intervals directly age- and sex-adjusted to the population structure of 2010 United States whites.
Comparably age- and sex-adjusted, the overall incidence of fractures in 2009–11 was 11% greater than in 1989–91 (4017 per 100,000 p-y; 95% CI 3908–4127 vs. 3627 per 100,000 p-y; 95% CI 3485–3768). However, this was driven by a 47% increase in fractures of the thoracic/lumbar spine between the two time periods (Table 3). Excluding vertebral fractures, overall fracture incidence was similar in 2009–11 and 1989–91 in both women (3511 per 100,000 p-y, 95% CI 3374–3648 vs. 3533 per 100,000 p-y; 95% CI 3347–3719) and men (2232 per 100,000 p-y; 95% CI 2106–2358 vs. 2183 per 100,000 p-y; 95% CI 2005–2361). At the specific skeletal sites, only increases in cervical spine and vertebral fractures and the decrease in shaft/distal humerus fractures were statistically significant among the men (Table 3). Among the women, increases were significant for fractures of the skull/face, cervical spine, vertebrae, pelvis and feet/toes. Notably, incidence rates for distal forearm and proximal femur fractures among the women were significantly lower in 2009–11 than in 1989–91.
Table 3.
Incidence of All Fractures by Skeletal Site in 2009–11 Compared to 1989–91 Among Olmsted County, Minnesota, Residents ≥ 50 Years of Age
| Men | Women | Both sexes | ||||
|---|---|---|---|---|---|---|
| 2009–11 | 1989–91 | 2009–11 | 1989–91 | 2009–11 | 1989–91 | |
| Ratea (95% CI) | Ratea (95% CI) | Ratea (95% CI) | Rateb (95% CI) | Rateb (95% CI) | Rateb (95% CI) | |
| Skull/face | 160 (125–195) | 139 (97–182) | 120 (94–145) | 62 (37–88) | 136 (115–156) | 100 (75–124) |
| Cervical spine | 116 (86–146) | 41 (18–65) | 96 (73–118) | 26 (9–43) | 106 (88–124) | 33 (19–48) |
| Hands/fingers | 261 (221–302) | 285 (223–347) | 279 (241–318) | 254 (202–306) | 276 (248–304) | 269 (229–308) |
| Distal forearm | 152 (120–183) | 109 (71–147) | 475 (424–526) | 646 (565–727) | 328 (297–359) | 400 (353–447) |
| Proximal forearm | 81 (58–104) | 71 (39–103) | 121 (96–147) | 129 (92–166) | 103 (86–120) | 101 (77–125) |
| Shaft/distal humerus | 15 (4–26) | 35 (13–58) | 45 (30–61) | 54 (31–76) | 32 (22–42) | 46 (30–62) |
| Proximal humerus | 95 (69–121) | 90 (55–125) | 213 (179–246) | 210 (165–255) | 161 (139–183) | 157 (128–186) |
| Clavicle/scapula/sternum | 156 (123–189) | 125 (83–168) | 94 (72–116) | 118 (83–152) | 124 (105–143) | 120 (94–146) |
| Ribs | 467 (410–524) | 515 (428–601) | 366 (322–410) | 360 (303–417) | 415 (380–450) | 437 (387–486) |
| Vertebrae | 798 (719–876) | 460 (373–547) | 1092 (1016–1168) | 812 (728–895) | 968 (914–1022) | 659 (600–718) |
| Pelvis | 110 (80–140) | 81 (44–118) | 280 (243–318) | 205 (165–246) | 211 (186–237) | 155 (127–182) |
| Proximal femur | 247 (200–294) | 243 (176–310) | 327 (286–367) | 438 (378–498) | 294 (264–323) | 357 (314–400) |
| Shaft/distal femur | 33 (19–48) | 38 (15–62) | 67 (48–86) | 79 (53–106) | 53 (41–66) | 63 (45–82) |
| Patella | 19 (8–30) | 31 (10–52) | 59 (41–76) | 69 (43–95) | 41 (30–52) | 52 (35–69) |
| Tibia/fibula | 69 (47–91) | 104 (63–145) | 120 (95–145) | 158 (119–198) | 95 (79–112) | 131 (104–158) |
| Ankle | 161 (129–193) | 153 (108–198) | 331 (288–373) | 303 (245–360) | 251 (224–279) | 231 (194–267) |
| Feet/toes | 205 (168–241) | 165 (119–210) | 615 (557–673) | 448 (379–518) | 423 (388–458) | 316 (274–359) |
| All sites | 3145 (2994–3297) | 2685 (2485–2884) | 4698 (4540–4856) | 4371 (4166–4575) | 4017 (3908–4127) | 3627 (3485–3768) |
Incidence per 100,000 person-years using one year age intervals directly age-adjusted to the population structure of 2010 United States whites.
Incidence per 100,000 person-years using one year age intervals directly sex- and age-adjusted to the population structure of 2010 United States whites.
Rates in each time pair that are statistically significantly greater (p < 0.05) are bolded.
The decrease in distal forearm fractures among the women between 1989–91 and 2009–11 was seen in the middle age-groups (Fig. 1A), whereas the contrasting increase in men was confined to the oldest age-groups (Fig. 1B). Conversely, the decline in proximal femur fractures in women was most evident at the oldest ages (Fig. 2A), with no consistent pattern among men in the two time periods (Fig. 2B). Increases in the incidence of vertebral fractures were seen in most older age-groups in both sexes (Fig. 3). In 2009–11, but not in 1989–91, it was possible to distinguish the vertebral fractures that were found incidentally in the course of care for an unrelated clinical problem. The incidentally identified fractures did not increase with age as dramatically as did the remaining vertebral fractures (Fig. 4). By definition, none of the incidental vertebral fractures was associated with a specific precipitating event. By contrast, 64% of the other vertebral fractures occurred in the course of everyday activities, with 16% attributed to severe trauma and 15% to a fall; 4% of them were pathologic fractures; and the cause could not be determined in 1%.
Fig. 1.
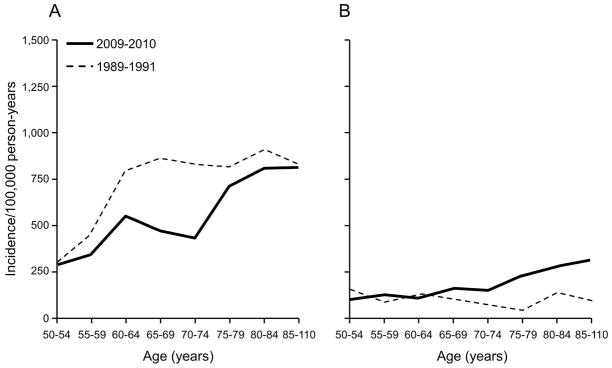
Age-specific incidence of all distal forearm fractures among Olmsted County, Minnesota, women (A) and men (B) ≥ 50 years of age, comparing 2009–11 with comparable data from 1989–91.
Fig. 2.
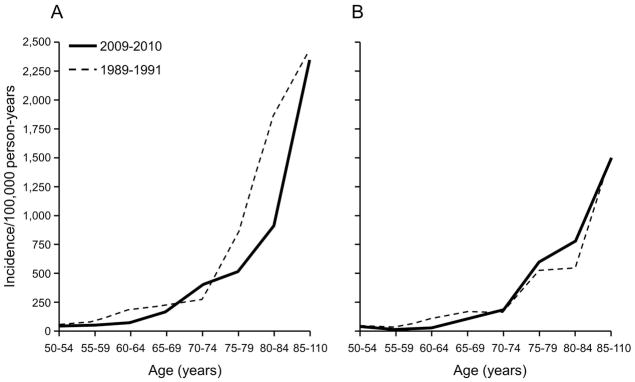
Age-specific incidence of all proximal femur fractures among Olmsted County, Minnesota, women (A) and men (B) ≥ 50 years of age, comparing 2009–11 with comparable data from 1989–91.
Fig. 3.

Age-specific incidence of all vertebral fractures among Olmsted County, Minnesota, women (A) and men (B) ≥ 50 years of age, comparing 2009–11 with comparable data from 1989–91.
Fig. 4.
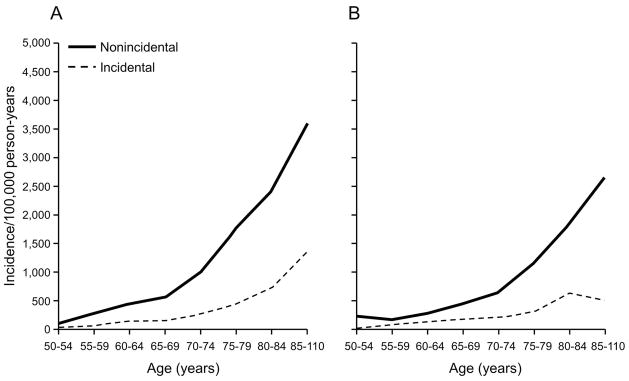
Age-specific incidence of all symptomatic versus incidental vertebral fractures among Olmsted County, Minnesota, women (A) and men (B) ≥ 50 years of age in 2009–11.
Discussion
It was not possible in this study to determine the first-ever lifetime incidence of each specific fracture type. Instead, we estimated the incidence of the fracture events themselves since this more accurately reflects the impact of fractures on the community.(20) Moreover, rather than focus solely on the major osteoporotic fractures thought to be more important, we considered fractures at every skeletal site due to any cause, including pathologic fractures,(21) since all of them contribute to the societal burden of osteoporosis.(1) Indeed, fractures at sites other than the hip and spine account for a substantial portion of fracture-related morbidity and cost.(22) If projected nationally, our overall rates would imply the occurrence of 3.9 million fractures annually among older individuals in this country. However, the incidence of fractures in this community has almost always been greater than similar figures reported from elsewhere. For example, the Olmsted County rates in 1989–91 were substantially higher than detailed population-based incidence data from Leicestershire, England in 1980–82,(23) and the discrepancy was attributed to underascertainment of fractures in that setting, especially for fractures of the spine and pelvis.(8) More recently, the General Practice Research Database was used to estimate fracture incidence in England and Wales for 1988–98.(24) Where age-groups overlapped (≥55 years), our current rates appeared to be four times greater, but we counted all fracture events whereas van Staa and colleagues(24) counted the individuals with any fracture during the study period. Considering only unique individuals, the annual age- and sex-adjusted incidence of any fracture among Olmsted County residents in this age-group was 2934 per 100,000 compared to 1250 per 100,000 in the comparably adjusted English data.
Our study confirms widespread reports that the incidence of proximal femur fractures continues to fall, not only in this country(2–6,25) but worldwide.(26) Indeed, we found that hip fracture incidence peaked among women in 1950 and among men in 1975 before beginning a steady decline that continued through 2006, where we estimated that the incidence rates were falling at a rate of −1.42%/year in women and −0.44%/year in men.(7) These figures predicted reductions of 28% and 9% in hip fracture incidence between 1989–91 and 2009–11 among women and men, respectively, which is quite comparable to the 25% reduction actually observed among the women; rates did not fall further in men between 1989–91 and 2009–11. Although some have attributed this improvement to the introduction of oral bisphosphonates,(4,5,27) and we did see some evidence of a reduction in hip fracture recurrence after 1997 in our most recent study,(7) osteoporosis treatment obviously cannot account for a secular decline in hip fracture incidence that has been underway in women for 60 years. Instead, it has long been presumed that delaying hip fracture onset, i.e., shifting the age-specific hip fracture incidence curve to the right, would reduce the number of hip fractures actually observed because of the competing risk of death. The decline in hip fracture incidence between 1989–91 and 2009–11 was, in fact, accompanied by a shift in the incidence curve for women to the right, although it has been suggested that this change might actually increase costs by focusing the hip fracture problem on the oldest-old.(28)
We also observed a reduction in distal forearm fractures among middle-aged women, but there was an apparent increase in these fractures among men age 50 years and over. In more detailed studies, we found a 17% increase in distal forearm fractures in Rochester, Minnesota between 1945–54 and 1985–94,(29) compared to a doubling in the incidence of such fractures in Malmö, Sweden between 1953–57 and 1991–92.(30) Since 1989–91, however, distal forearm fracture rates have declined dramatically in women only to increase by 39% among Olmsted County men. A large study in Manitoba, Canada, documented a comparable fall in forearm fracture rates in women (−1.2%/year over 20 years) and a rise (+0.2%/year over 20 years) in men.(31) The overall distal forearm fracture incidence rates from Olmsted County in 2009–11 are 18% lower than those from 1989–91,(32) which are currently used in the revised United States version of the World Health Organization’s fracture prediction algorithm, FRAX.(33)
We previously observed no increase in the incidence of vertebral fractures between 1950–54 and 1985–89 among Rochester, Minnesota, residents age 35–69 years.(34) Between 1989–91 and 2009–11, however, the apparent incidence of vertebral fractures rose dramatically in association with a shift in the age-specific incidence curves for both sexes to the left, i.e., an apparent earlier onset of vertebral fracture over time. This is in accordance with a substantial rise in emergency department visits for spine fractures in the Netherlands, which was associated with falls among the oldest-old,(35) but differs remarkably from the observation in Manitoba that the incidence of vertebral fractures varied hardly at all between 1986 and 2005.(31) An increase in vertebral fractures among middle-aged women in this country was attributed to reduced estrogen use after 2002,(10) but this is an unlikely explanation for the increases seen here in men and the oldest women. Moreover, the vertebral fracture incidence rates from Olmsted County in 1989–91 were already considered high.(32) In this update, as in those earlier data, we only counted discrete events (i.e., unique vertebrae affected on different dates), although 25% of the total was accounted for by multiple episodes in the same patient, perhaps reflecting a “fracture cascade.”(36) All vertebral fractures were confirmed on radiologists’ reports, albeit 23% of them were found incidentally on X-rays taken for another purpose. Although radiologist readings for vertebral deformities are generally considered insensitive rather than non-specific,(37,38) increased attention to osteoporosis in recent years(39–41) may have resulted in more vertebral deformities being reported.
With respect to trends in the incidence of other types of fractures, we previously reported that age-adjusted incidence rates in Olmsted County had increased between 1967–71 and 1989–91 for fractures of the hands/fingers (women only), humerus (men only), patella (women only), tibia/fibula and feet/toes.(8) With the exception of a further increase in foot fractures among the women, there was little further change at these sites between 1989–91 and 2009–11. Thus, consistent with other reports, rates have stabilized or declined for fractures of the proximal and distal humerus(42–44) and ankle.(45) The incidence of shaft/distal femur fractures also remained unchanged, as reported nationally.(25) About two-thirds of these were shaft fractures, the same proportion seen in our population generally over the past two decades.(46) By contrast, there have been quite dramatic increases in fractures of the skull and face, and especially of the cervical spine, among Olmsted County residents over the past 20 years. This was observed in other settings as well and attributed to a greater rate of injurious falls among the elderly.(47–49) Likewise, we found that cervical spine fractures were much more likely the result of severe trauma than were thoracic/lumbar spine fractures (44% vs. 12%), and a sharp rise in the incidence of cervical spine fractures was seen among the oldest-old. An increase in pelvis fractures was also consistent with a temporal increase in hospitalized pelvic fractures in Australia.(50)
Our study has a number of noteworthy strengths.(17) Except for those which do not come to clinical attention (e.g., some fractures of the vertebrae and ribs), ascertainment of fractures should be complete, and the denominator population is well characterized.(17) Moreover, our analysis did not require the assumptions inherent in studies based on administrative data,(51) nor the limitations of self-report.(52) However, the number of fractures observed at some skeletal sites was relatively small, and those particular incidence estimates were limited as a result. In addition, given the demographic makeup of the community,(13) there were only 101 nonwhite community residents with a fracture. Combining all nonwhite races, we would estimate the annual age- and sex-adjusted incidence of any fracture at 1435 per 100,000 in this group, which is lower than that seen in white residents, but this figure cannot be considered very reliable. Since 12% of the national expenditure for osteoporotic fractures is incurred by nonwhite patients,(1) comparable fracture data are urgently required for the very different groups that comprise that population. However, the majority of age-related fractures nationally occur in the white population,(1) and Olmsted County rates are comparable to previous estimates of hip fracture incidence for the United States white population generally.(7)
These Olmsted County data represent the only recent age- and sex-specific incidence rates for all fractures for any community in this country. Although some variations were seen in the incidence of specific types of fractures in 2009–11 as compared to 1989–91, the more impressive observation is the relatively small change in overall fracture incidence over this period. This is in stark contrast to the situation only a few decades ago when substantial increases were being reported in the incidence of fractures at diverse skeletal sites.(53,54) Although more detailed explanations for the recent secular changes observed for some specific fractures would be welcomed, there also needs to be a much greater focus on the underlying societal forces potentially responsible for the broader rise and fall over time in fracture risk generally.(26) Such “macroscopic” explanations could diverge quite dramatically from the fracture risk factors that we are accustomed to considering and might provide a basis for new public health interventions.
Acknowledgments
The authors would like to thank Marcia Erickson, R.N., Julie Gingras, R.N., and Joan LaPlante, R.N., for assistance with the updated data collection and Mary Roberts for help in preparing the manuscript.
This work was supported by research grant P01 AG-04875 from the National Institute on Aging and made possible by the Rochester Epidemiology Project (R01 AG-034676 from the National Institute on Aging), U.S. Public Health Service. The content is solely the responsibility of the authors and does not necessarily represent the official views of the National Institutes of Health. There were no other external sources of support.
Footnotes
Disclosures
Dr. Amin has served on a scientific advisory board for Merck & Co. All other authors state that they have no conflicts of interest with respect to this work.
Authors’ roles: Study design: SA and LJM
Study conduct: SA
Data collection: SA
Data analysis: SJA and EJA
Data interpretation: SA and LJM
Drafting manuscript: LJM and SA
Revising manuscript content: SA, SJA, EJA, SK and LJM
Approving final version of manuscript: SA, SJA, EJA, SK and LJM
EJA takes responsibility for the integrity of the data analysis.
References
- 1.Burge R, Dawson-Hughes B, Solomon DH, Wong JB, King A, Tosteson A. Incidence and economic burden of osteoporosis-related fractures in the United States, 2005–2025. J Bone Miner Res. 2007;22:465–75. doi: 10.1359/jbmr.061113. [DOI] [PubMed] [Google Scholar]
- 2.Zingmond DS, Melton LJ, 3rd, Silverman SL. Increasing hip fracture incidence in California Hispanics, 1983 to 2000. Osteoporos Int. 2004;15:603–10. doi: 10.1007/s00198-004-1592-7. [DOI] [PubMed] [Google Scholar]
- 3.Hiebert R, Aharonoff GB, Capla EL, Egol KA, Zuckerman JD, Koval KJ. Temporal and geographic variation in hip fracture rates for people aged 65 or older, New York State, 1985–1996. Am J Orthop. 2005;34:252–5. [PubMed] [Google Scholar]
- 4.Gehlbach SH, Avrunin JS, Puleo E. Trends in hospital care for hip fractures. Osteoporos Int. 2007;18:585–91. doi: 10.1007/s00198-006-0281-0. [DOI] [PubMed] [Google Scholar]
- 5.Brauer CA, Coca-Perraillon M, Cutler DM, Rosen AB. Incidence and mortality of hip fractures in the United States. JAMA. 2009;302:1573–9. doi: 10.1001/jama.2009.1462. [DOI] [PMC free article] [PubMed] [Google Scholar]
- 6.Wright NC, Saag KG, Curtis JR, Smith WK, Kilgore ML, Morrisey MA, Yun H, Zhang J, Delzell ES. Recent trends in hip fracture rates by race/ethnicity among older US adults. J Bone Miner Res. 2012;27:2325–32. doi: 10.1002/jbmr.1684. [DOI] [PubMed] [Google Scholar]
- 7.Melton LJ, 3rd, Kearns AE, Atkinson EJ, Bolander ME, Achenbach SJ, Huddleston JM, Therneau TM, Leibson CL. Secular trends in hip fracture incidence and recurrence. Osteoporos Int. 2009;20:687–94. doi: 10.1007/s00198-008-0742-8. [DOI] [PMC free article] [PubMed] [Google Scholar]
- 8.Melton LJ, 3rd, Crowson CS, O’Fallon WM. Fracture incidence in Olmsted County, Minnesota: comparison of urban with rural rates and changes in urban rates over time. Osteoporos Int. 1999;9:29–37. doi: 10.1007/s001980050113. [DOI] [PubMed] [Google Scholar]
- 9.Bilezikian JP. Efficacy of bisphosphonates in reducing fracture risk in postmenopausal osteoporosis. Am J Med. 2009;122:S14–21. doi: 10.1016/j.amjmed.2008.12.003. [DOI] [PubMed] [Google Scholar]
- 10.Islam S, Liu Q, Chines A, Helzner E. Trend in incidence of osteoporosis-related fractures among 40- to 69-year-old women: analysis of a large insurance claims database, 2000–2005. Menopause. 2009;16:77–83. doi: 10.1097/gme.0b013e31817b816e. [DOI] [PubMed] [Google Scholar]
- 11.Looker AC, Melton LJ, 3rd, Borrud LG, Shepherd JA. Changes in femur neck bone density in US adults between 1988–1994 and 2005–2008: demographic patterns and possible determinants. Osteoporos Int. 2012;23:771–80. doi: 10.1007/s00198-011-1623-0. [DOI] [PubMed] [Google Scholar]
- 12.Rocca WA, Yawn BP, St Sauver JL, Grossardt BR, Melton LJ., 3rd History of the Rochester Epidemiology Project: half a century of medical records linkage in a US population. Mayo Clin Proc. 2012;87:1202–13. doi: 10.1016/j.mayocp.2012.08.012. [DOI] [PMC free article] [PubMed] [Google Scholar]
- 13.St Sauver JL, Grossardt BR, Yawn BP, Melton LJ, 3rd, Pankratz JJ, Brue SM, Rocca WA. Data resource profile: the Rochester Epidemiology Project (REP) medical records-linkage system. Int J Epidemiol. 2012;41:1614–24. doi: 10.1093/ije/dys195. [DOI] [PMC free article] [PubMed] [Google Scholar]
- 14.ICD-9-CM. International Classification of Diseases 9th Revision Clinical Modification, Volume 1, Diseases Tabular List. Ann Arbor, MI: Commission on Professional and Hospital Activities; 1978. [Google Scholar]
- 15.Melton LJ., 3rd The threat to medical-records research. N Engl J Med. 1997;337:1466–70. doi: 10.1056/NEJM199711133372012. [DOI] [PubMed] [Google Scholar]
- 16.Cooper C, Atkinson EJ, O’Fallon WM, Melton LJ., 3rd Incidence of clinically diagnosed vertebral fractures: a population-based study in Rochester, Minnesota, 1985–1989. J Bone Miner Res. 1992;7:221–7. doi: 10.1002/jbmr.5650070214. [DOI] [PubMed] [Google Scholar]
- 17.St Sauver JL, Grossardt BR, Yawn BP, Melton LJ., 3rd Use of a medical records linkage system to enumerate a dynamic population over time: the Rochester Epidemiology Project. Am J Epidemiol. 2011;173:1059–68. doi: 10.1093/aje/kwq482. [DOI] [PMC free article] [PubMed] [Google Scholar]
- 18.Melton LJ, 3rd, Atkinson EJ, Cooper C, O’Fallon WM, Riggs BL. Vertebral fractures predict subsequent fractures. Osteoporos Int. 1999;10:214–21. doi: 10.1007/s001980050218. [DOI] [PubMed] [Google Scholar]
- 19.McCullagh P, Nelder JA. In: Generalized Linear Models. Cox DR, Hinkley DV, Rubin D, Silvermann BW, editors. New York: Chapman and Hall; 1983. pp. 127–47. [Google Scholar]
- 20.Clarke BL, Khosla S. Assessing the true impact of recurrent fractures on fracture risk. J Bone Miner Res. 2009;24:1512–4. doi: 10.1359/jbmr.090814. [DOI] [PMC free article] [PubMed] [Google Scholar]
- 21.Curtis JR, Taylor AJ, Matthews RS, Ray MN, Becker DJ, Gary LC, Kilgore ML, Morrisey MA, Saag KG, Warriner A, Delzell E. “Pathologic” fractures: should these be included in epidemiologic studies of osteoporotic fractures? Osteoporos Int. 2009;20:1969–72. doi: 10.1007/s00198-009-0840-2. [DOI] [PMC free article] [PubMed] [Google Scholar]
- 22.Delmas PD, Marin F, Marcus R, Misurski DA, Mitlak BH. Beyond hip: importance of other nonspinal fractures. Am J Med. 2007;120:381–7. doi: 10.1016/j.amjmed.2006.06.003. [DOI] [PubMed] [Google Scholar]
- 23.Donaldson LJ, Cook A, Thomson RG. Incidence of fractures in a geographically defined population. J Epidemiol Community Health. 1990;44:241–5. doi: 10.1136/jech.44.3.241. [DOI] [PMC free article] [PubMed] [Google Scholar]
- 24.van Staa TP, Dennison EM, Leufkens HG, Cooper C. Epidemiology of fractures in England and Wales. Bone. 2001;29:517–22. doi: 10.1016/s8756-3282(01)00614-7. [DOI] [PubMed] [Google Scholar]
- 25.Nieves JW, Bilezikian JP, Lane JM, Einhorn TA, Wang Y, Steinbuch M, Cosman F. Fragility fractures of the hip and femur: incidence and patient characteristics. Osteoporos Int. 2010;21:399–408. doi: 10.1007/s00198-009-0962-6. [DOI] [PubMed] [Google Scholar]
- 26.Cooper C, Cole ZA, Holroyd CR, Earl SC, Harvey NC, Dennison EM, Melton LJ, Cummings SR, Kanis JA. Secular trends in the incidence of hip and other osteoporotic fractures. Osteoporos Int. 2011;22:1277–88. doi: 10.1007/s00198-011-1601-6. [DOI] [PMC free article] [PubMed] [Google Scholar]
- 27.Jaglal SB, Weller I, Mamdani M, Hawker G, Kreder H, Jaakkimainen L, Adachi JD. Population trends in BMD testing, treatment, and hip and wrist fracture rates: are the hip fracture projections wrong? J Bone Miner Res. 2005;20:898–905. doi: 10.1359/JBMR.041231. [DOI] [PubMed] [Google Scholar]
- 28.Bergström U, Jonsson H, Gustafson Y, Pettersson U, Stenlund H, Svensson O. The hip fracture incidence curve is shifting to the right. Acta Orthop. 2009;80:520–4. doi: 10.3109/17453670903278282. [DOI] [PMC free article] [PubMed] [Google Scholar]
- 29.Melton LJ, 3rd, Amadio PC, Crowson CS, O’Fallon WM. Long-term trends in the incidence of distal forearm fractures. Osteoporos Int. 1998;8:341–8. doi: 10.1007/s001980050073. [DOI] [PubMed] [Google Scholar]
- 30.Jónsson B, Bengner U, Redlund-Johnell I, Johnell O. Forearm fractures in Malmö, Sweden. Changes in the incidence occurring during the 1950s, 1980s and 1990s. Acta Orthop Scand. 1999;70:129–32. doi: 10.3109/17453679909011249. [DOI] [PubMed] [Google Scholar]
- 31.Leslie WD, Sadatsafavi M, Lix LM, Azimaee M, Morin S, Metge CJ, Caetano P. Secular decreases in fracture rates 1986–2006 for Manitoba, Canada: a population-based analysis. Osteoporos Int. 2011;22:2137–43. doi: 10.1007/s00198-010-1470-4. [DOI] [PubMed] [Google Scholar]
- 32.Ettinger B, Black DM, Dawson-Hughes B, Pressman AR, Melton LJ., 3rd Updated fracture incidence rates for the US version of FRAX. Osteoporos Int. 2010;21:25–33. doi: 10.1007/s00198-009-1032-9. [DOI] [PMC free article] [PubMed] [Google Scholar]
- 33.Kanis JA, Johansson H, Oden A, Dawson-Hughes B, Melton LJ, 3rd, McCloskey EV. The effects of a FRAX revision for the USA. Osteoporos Int. 2010;21:35–40. doi: 10.1007/s00198-009-1033-8. [DOI] [PubMed] [Google Scholar]
- 34.Cooper C, Atkinson EJ, Kotowicz M, O’Fallon WM, Melton LJ., 3rd Secular trends in the incidence of postmenopausal vertebral fractures. Calcif Tissue Int. 1992;51:100–4. doi: 10.1007/BF00298496. [DOI] [PubMed] [Google Scholar]
- 35.Oudshoorn C, Hartholt KA, Zillikens MC, Panneman MJ, van der Velde N, Colin EM, Patka P, van der Cammen TJ. Emergency department visits due to vertebral fractures in the Netherlands, 1986–2008: steep increase in the oldest old, strong association with falls. Injury. 2012;43:458–61. doi: 10.1016/j.injury.2011.09.014. [DOI] [PubMed] [Google Scholar]
- 36.Lindsay R, Pack S, Li Z. Longitudinal progression of fracture prevalence through a population of postmenopausal women with osteoporosis. Osteoporos Int. 2005;16:306–12. doi: 10.1007/s00198-004-1691-5. [DOI] [PubMed] [Google Scholar]
- 37.Delmas PD, van de Langerijt L, Watts NB, Eastell R, Genant H, Grauer A, Cahall DL, Group IS. Underdiagnosis of vertebral fractures is a worldwide problem: the IMPACT study. J Bone Miner Res. 2005;20:557–63. doi: 10.1359/JBMR.041214. [DOI] [PubMed] [Google Scholar]
- 38.Gehlbach SH, Bigelow C, Heimisdottir M, May S, Walker M, Kirkwood JR. Recognition of vertebral fracture in a clinical setting. Osteoporos Int. 2000;11:577–82. doi: 10.1007/s001980070078. [DOI] [PubMed] [Google Scholar]
- 39.Stafford RS, Drieling RL, Hersh AL. National trends in osteoporosis visits and osteoporosis treatment, 1988–2003. Arch Intern Med. 2004;164:1525–30. doi: 10.1001/archinte.164.14.1525. [DOI] [PubMed] [Google Scholar]
- 40.Curtis JR, Carbone L, Cheng H, Hayes B, Laster A, Matthews R, Saag KG, Sepanski R, Tanner SB, Delzell E. Longitudinal trends in use of bone mass measurement among older americans, 1999–2005. J Bone Miner Res. 2008;23:1061–7. doi: 10.1359/JBMR.080232. [DOI] [PMC free article] [PubMed] [Google Scholar]
- 41.Farley JF, Blalock SJ. Trends and determinants of prescription medication use for treatment of osteoporosis. Am J Health Syst Pharm. 2009;66:1191–201. doi: 10.2146/ajhp080248. [DOI] [PubMed] [Google Scholar]
- 42.Kannus P, Palvanen M, Niemi S, Sievanen H, Parkkari J. Rate of proximal humeral fractures in older Finnish women between 1970 and 2007. Bone. 2009;44:656–9. doi: 10.1016/j.bone.2008.12.007. [DOI] [PubMed] [Google Scholar]
- 43.Palvanen M, Kannus P, Niemi S, Parkkari J. Secular trends in distal humeral fractures of elderly women: nationwide statistics in Finland between 1970 and 2007. Bone. 2010;46:1355–8. doi: 10.1016/j.bone.2009.11.025. [DOI] [PubMed] [Google Scholar]
- 44.Bell JE, Leung BC, Spratt KF, Koval KJ, Weinstein JD, Goodman DC, Tosteson AN. Trends and variation in incidence, surgical treatment, and repeat surgery of proximal humeral fractures in the elderly. J Bone Joint Surg Am. 2011;93:121–31. doi: 10.2106/JBJS.I.01505. [DOI] [PMC free article] [PubMed] [Google Scholar]
- 45.Kannus P, Palvanen M, Niemi S, Parkkari J, Jarvinen M. Stabilizing incidence of low-trauma ankle fractures in elderly people Finnish statistics in 1970–2006 and prediction for the future. Bone. 2008;43:340–2. doi: 10.1016/j.bone.2008.04.015. [DOI] [PubMed] [Google Scholar]
- 46.Ng AC, Drake MT, Clarke BL, Sems SA, Atkinson EJ, Achenbach SJ, Melton LJ., 3rd Trends in subtrochanteric, diaphyseal, and distal femur fractures, 1984–2007. Osteoporos Int. 2012;23:1721–6. doi: 10.1007/s00198-011-1777-9. [DOI] [PMC free article] [PubMed] [Google Scholar]
- 47.Kannus P, Niemi S, Parkkari J, Palvanen M, Sievanen H. Alarming rise in fall-induced severe head injuries among elderly people. Injury. 2007;38:81–3. doi: 10.1016/j.injury.2006.08.027. [DOI] [PubMed] [Google Scholar]
- 48.Jamieson LM, Roberts-Thomson KF. Hospitalized head injuries among older people in Australia, 1998/1999 to 2004/2005. Inj Prev. 2007;13:243–7. doi: 10.1136/ip.2007.015354. [DOI] [PMC free article] [PubMed] [Google Scholar]
- 49.Kannus P, Palvanen M, Niemi S, Parkkari J. Alarming rise in the number and incidence of fall-induced cervical spine injuries among older adults. J Gerontol A Biol Sci Med Sci. 2007;62:180–3. doi: 10.1093/gerona/62.2.180. [DOI] [PubMed] [Google Scholar]
- 50.Boufous S, Finch C, Lord S, Close J. The increasing burden of pelvic fractures in older people, New South Wales, Australia. Injury. 2005;36:1323–9. doi: 10.1016/j.injury.2005.02.008. [DOI] [PubMed] [Google Scholar]
- 51.Lix LM, Yogendran MS, Leslie WD, Shaw SY, Baumgartner R, Bowman C, Metge C, Gumel A, Hux J, James RC. Using multiple data features improved the validity of osteoporosis case ascertainment from administrative databases. J Clin Epidemiol. 2008;61:1250–60. doi: 10.1016/j.jclinepi.2008.02.002. [DOI] [PubMed] [Google Scholar]
- 52.Schousboe JT, Paudel ML, Taylor BC, Virnig BA, Cauley JA, Curtis JR, Ensrud KE. Magnitude and consequences of misclassification of incident hip fractures in large cohort studies: the Study of Osteoporotic Fractures and Medicare claims data. Osteoporos Int. 2013;24:801–10. doi: 10.1007/s00198-012-2210-8. [DOI] [PMC free article] [PubMed] [Google Scholar]
- 53.Obrant KJ, Bengner U, Johnell O, Nilsson BE, Sernbo I. Increasing age-adjusted risk of fragility fractures: a sign of increasing osteoporosis in successive generations? Calcif Tissue Int. 1989;44:157–67. doi: 10.1007/BF02556558. [DOI] [PubMed] [Google Scholar]
- 54.Lauritzen JB, Schwarz P, Lund B, McNair P, Transbol I. Changing incidence and residual lifetime risk of common osteoporosis-related fractures. Osteoporos Int. 1993;3:127–32. doi: 10.1007/BF01623273. [DOI] [PubMed] [Google Scholar]