Abstract
Objective
To develop a simple, selective, sensitive and accurate high-performance thin layer chromatography (HPTLC) method to determine the quantity of hesperidin in different varieties of citrus fruits.
Methods
The method was carried out in aluminum-backed silica gel 60 F254 plates with ethyl acetate-methanol-water 15:3:2 (%, v/v) as mobile phase.
Results
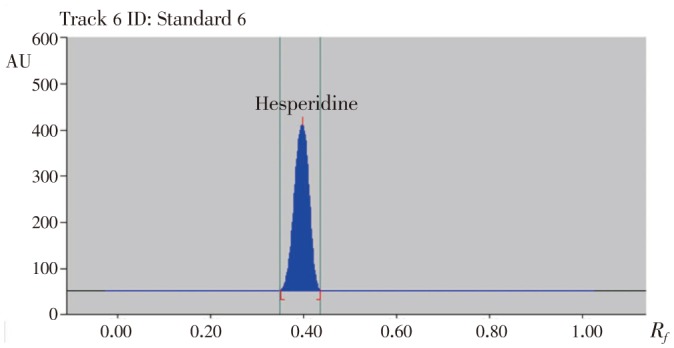
A compact band was obtained for hesperidin at Rf value of (0.40±0.04). The calibration plot was linear in the range of 100-800 ng/spot of hesperidin and the correlation coefficient of 0.998 6 was indicative of good linear dependence of peak area on concentration. Limit of detection (8.87 ng/spot), limit of quantification (23.21 ng/spot), accuracy (less than 2%) and recovery (ranging from 98.55-99.38) were found satisfactory.
Conclusions
The method developed can be used for routine analysis of hesperidin in crude drug as well as in herbal and pharmaceutical dosage form containing citrus fruits as an ingredient.
Keywords: HPTLC, Citrus, Hesperidin
1. Introduction
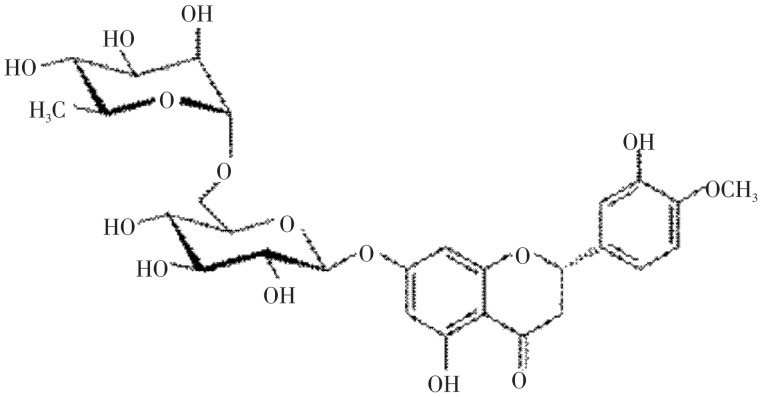
Hesperidin is a flavanone glycoside found abundantly in citrus fruits and possess antioxidant activity[1],[2]. Hesperidin alone, or in combination with other citrus bioflavonoids is used for blood vessel conditions such as hemorrhoids, varicose veins, and poor circulation (venous stasis). It is also used to treat lymphedema, a condition involving fluid retention that can be a complication of breast cancer surgery[3]. The antiallergic activity of hesperidin is activated by intestinal microflora[4]. Hesperidin has anti-inflammatory and analgesic effects[5]–[7]. In addition, the results revealed that hesperidin exhibited pronounced anticancer activity against the selected cell lines[8]. In literature, several analytical methods for the determination of hesperidin have been reported. Several high performance liquid chromatography (HPLC) methods were developed for the estimation of hesperidin either alone or in mixture with other flavonoids in plant juices and pharmaceutical formulations[9]–[15]. A liquid chromatography tandem mass spectrometry (LC-MS/MS) method was developed for the simultaneous determination of naringin, hesperidin, neohesperidin, naringenin and hesperetin in rat plasma, using liquiritin as the internal standard[16],[17]. No single method has been reported for the quantitative estimation of hesperidin by high performance thin layer chromatography (HPTLC) in different varieties of citrus fruits. Therefore the aim of present investigation was to develop a simple, precise and accurate HPTLC densitometric method for the estimation of hesperidin (Figure 1).
Figure 1. Chemical structure of hesperidin.
2. Materials and methods
2.1. Plant material
Mosambi (Citrus limetta), orange (Citrus sinensis), Lemon (Citrus lemon) and grape fruits (Citrus paradise) were purchased from local market of Al Kharj, Kingdom of Saudi Arabia. The plant was collected and identified by Dr. Mohammad Atiqur Rahman; taxonomist of Medicinal, Aromatic and Poisonous Plants Research Center (MAPPRC), College of Pharmacy, King Saud University, Saudi Arabia. A voucher specimen 13998 was deposited in the Herbarium of the College of Pharmacy, King Saud University, Saudi Arabia.
2.2. Chemicals
Standard hesperidin was purchased from Sigma-Aldrich, St. Louis, MO, USA. All the solvents were of HPLC grade and other chemicals used were of analytical reagent grade.
Accurately weighed 1 mg of standard hesperidin (purity 99%) was dissolved in 5 mL methanol and heated on a water bath to dissolve completely and then make up the volume up to 10 mL with methanol in a volumetric flask to give concentration of 100 µg/mL. Different volumes of working standard, i.e. 1, 2, 3, 4, 5, 6, 7 and 8 µL were applied on thin-layer chromatography (TLC). The calibration curve was plotted in the range of 100-800 ng/spot, using data of peak areas against the corresponding amount per spot. This solution was used as a reference solution (stock solution) for hesperidin.
2.3. Sample preparation for analysis of hesperidin in methanolic extract of citrus fruits
The air-dried peel (5 g) of citrus fruits were coarsely powdered, defatted with petroleum ether and then exhaustively extracted in a Soxhlet apparatus with methanol for 72 h. The solvent was evaporated to dryness under reduced pressure by use of a rotary vacuum evaporator and the residue was separately dissolved in methanol in 50 mL volumetric flask.
2.4. Chromatographic conditions
HPTLC densitometric analysis was performed on 10 cm×20 cm aluminium-backed plates coated with 0.2 mm layers of silica gel 60 F254 (E-Merck, Germany). Samples were applied to the TLC plates as 6 mm bands using a Camag Automatic TLC Sampler 4 (ATS4) sample applicator (Switzerland) fitted with a Camag microlitre syringe. A constant application rate of 150 nL/s was used. Linear ascending development of the plates to a distance of 80 mm were performed with ethyl acetate-methanol-water 15:3:2 (%, v/v) hesperidin as mobile phase in a Camag Automatic Developing Chamber 2 (ADC2) previously saturated with mobile phase vapour for 30 min at 22 °C.
2.5. Method validation
The proposed HPTLC method was validated according to the guidelines of international conference on harmonization (ICH)[18]. The linearity of the method for hesperidin was checked between 100 and 800 ng/spot and concentration was plotted against peak area.
Accuracy, as recovery, was determined by the standard addition method. Pre-analyzed samples of hesperidin (300 ng/spot) were spiked with extra hesperidin standard (0%, 50%, 100%, and 150%) and the mixtures were reanalyzed. Percentage recovery and relative standard deviation (RSD, %) were calculated for each concentration level.
Precision was assessed by determination of repeatability and intermediate precision. Repeatability of sample was determined as intra-day variation whereas intermediate precision was determined by assessment of inter-day variation for analysis of hesperidin at three different amounts (300, 400, and 500 ng/spot) in six replicates.
Robustness of the proposed TLC densitometric method was determined to evaluate the influence of small deliberate changes in the chromatographic conditions during determination of hesperidin. Robustness was determined by changing the polarity of the mobile phase.
Limit of detection (LOD) and limit of quantification (LOQ) were determined by standard deviation (SD) method. They were determined from the slope of the calibration (S) curve and SD of the blank sample using following equations:
LOD=3.3×SD/S
LOQ=10×SD/S
Specificity of the proposed TLC densitometric was confirmed by analyzing and comparing the Rf values and spectra of the spot for hesperidin in the samples with that of the standards.
2.6. Quantification of hesperidin in different varieties of methanolic extract of citrus peels
The test samples were applied and chromatograms were obtained under the same conditions as for analysis of standard hesperidin. The area of the peak corresponding to the Rf value of hesperidin standard was recorded and the amount present was calculated from the regression equation obtained from the calibration plot.
3. Results
3.1. Method development
The mobile phase composition was optimized to establish a suitable and accurate densitometric HPTLC method for analysis of hesperidin. The mobile phase ethyl acetate-methanol-water 15:3:2 (%, v/v) resulted in a sharp, symmetrical, and well resolved peak at Rf value of (0.40± 0.04) (Figure 2). UV spectra measured for the bands showed maximum absorbance at approximately 286 nm.
Figure 2. HPTLC chromatogram of standard hesperidin.
3.2. Calibration curve
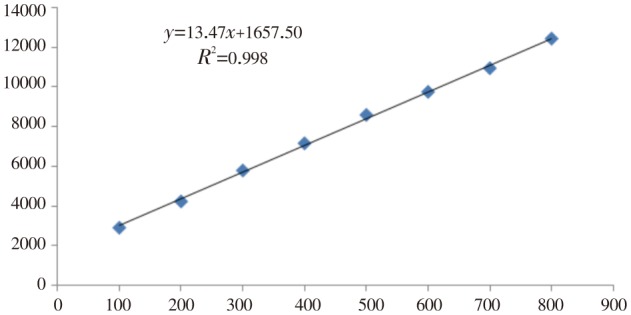
The calibration plot of peak area against amount of hesperidin was linear in the range 100-800 ng/spot. Linear regression data for the plot confirmed the good linear relationship (Table 1). The correlation coefficient (R2) was 0.998 6 which was highly significant (P<0.05). The linear regression equation was Y=13.47x+1 657.5, where Y is response and X is amount of hesperidin (Figure 3).
Table 1. Linear regression data for the calibration curve of hesperidin (n=6).
| Linear regression | Data |
| Linearity range (ng/spot) | 100-800 |
| Regression equation | Y=13.47x+1657.50 |
| Correlation coefficient | 0.9986 |
| Slope±SD | 13.470±0.031 |
| Intercept±SD | 1657.50±15.68 |
| Standard error of slope | 0.076 |
| Standard error of intercept | 38.41 |
| 95% confidence interval of slope | 13.31-13.62 |
| 95% confidence interval of intercept | 1580.1-1734.9 |
Figure 3. Regression curve of standard hesperidin.
3.3. Method validation
3.3.1. Precision
The accuracy of the method, as recovery, was 98.55-99.38%, with RSD values in the range 0.68-1.12. These results indicated the accuracy of the method (Table 2). Results from determination of repeatability and intermediate precision, expressed as SD (%) are shown in Table 3. RSD was in the range 0.59-1.06 for repeatability and 0.76-1.20 for intermediate precision. These low values indicated that the method is precise[19].
Table 2. Accuracy of the proposed method (n=6).
| Excess drug added to analyte (%) | Theoretical content (ng) | Conc. found (ng)±SD | % Recovery | % RSD |
| 0 | 300 | 298.16±2.04 | 99.38 | 0.68 |
| 50 | 450 | 443.50±4.96 | 98.55 | 1.12 |
| 100 | 600 | 595.00±4.47 | 99.16 | 0.75 |
| 150 | 750 | 745.16±3.93 | 99.35 | 0.75 |
Conc.: Concentration.
Table 3. Precision of the proposed method (n=6).
| Conc. (ng/spot) | Repeatability (Intraday precision) |
Intermediate precision (Interday) |
|||||
| Area±SD | Standard error | % RSD | Area±SD | Standard error | % RSD | ||
| 300 | 5794.16±61.50 | 25.15 | 1.06 | 5794.00±69.69 | 28.45 | 1.20 | |
| 400 | 7352.50±71.15 | 29.05 | 0.96 | 7331.66±56.41 | 23.06 | 0.76 | |
| 500 | 8661.16±51.41 | 20.99 | 0.59 | 8700.05±87.80 | 35.85 | 1.00 | |
Conc.: Concentration.
3.3.2. Robustness of the method
Results of robustness are shown in Table 4. Low values of % RSD (0.46-1.29) were obtained after introducing small deliberate change into the densitometric TLC procedure proved the robustness of the proposed HPTLC method[20].
Table 4. Robustness of the proposed HPTLC method (n=6).
| Conc. (ng/spot) | Mobile phase composition (Ethyl acetate: methanol: water) |
Results |
||||
| Original | Used | Area±SD | % RSD | Rf | ||
| 15:3.2.1 | +0.1 | 7310±75 | 1.02 | 0.41 | ||
| 400 | 15:3:2 | 15:3:2 | 0.0 | 7290±59 | 0.81 | 0.40 |
| 15:3.1.9 | -0.1 | 7284±51 | 0.69 | 0.39 | ||
Conc.: Concentration.
3.3.3. Limit of detection and quantification
LOD and LOQ of the proposed method was found to be 8.87 and 23.21 ng/spot, for hesperidin, which indicated that the proposed method can be used in wide range for detection and quantification of hesperidin effectively[21].
3.3.4. Specificity
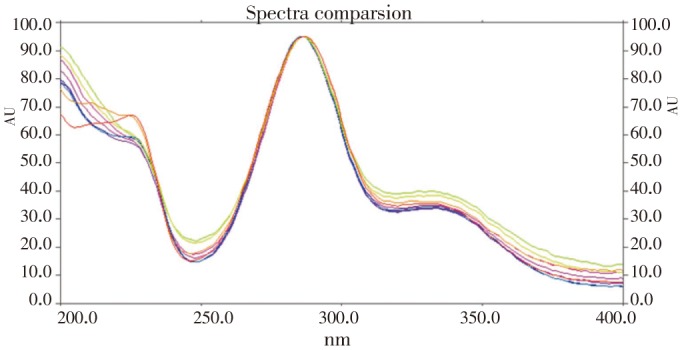
The peak purity of diosmin, hesperid in and ascorbic acid were assessed by comparing the overlaid spectra at peak start, peak apex and peak end position of the spot. The overlaid spectra of hesperidin standards and different varieties ofmethanolic extracts of citrus peels was given in Figure 4.
Figure 4. Overlay UV absorption spectra of the standard hesperidin and extracts of four different varieties of citrus peels.
3.3.5. Quantification of hesperidin in different varieties of methanolic extracts of citrus peels
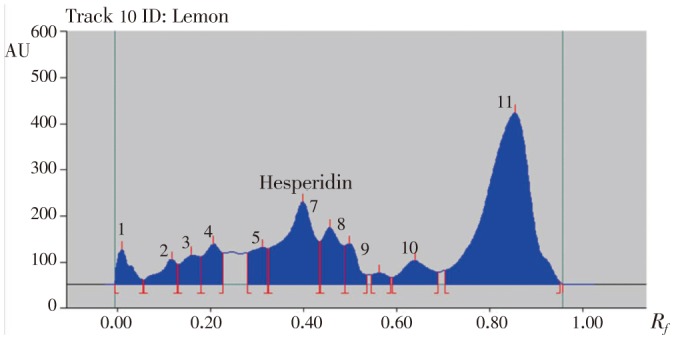
Hesperidin peaks from different varieties methanolic extract of citrus peels were identified by comparing their single spot at Rf=0.40±0.04 (Figure 5–8) values with those obtained by chromatography of the standard under the same conditions. The hesperidin content in methanolic extracts of four different varieties of citrus peels was quantified by use of the linear regression equation and concentrations are presented in Table 5.
Figure 5. HPTLC chromatogram of methanolic extract of grapes peels.
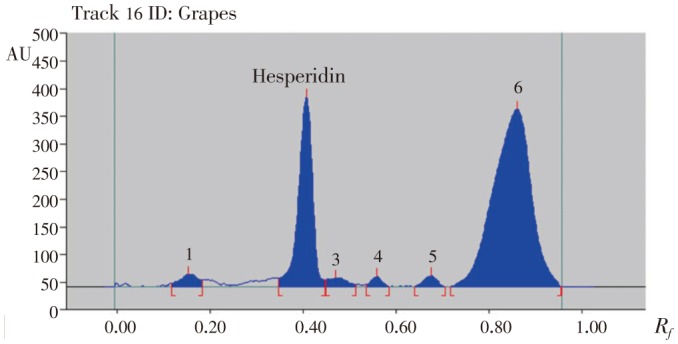
Figure 8. HPTLC chromatogram of methanolic extract of orange peels.
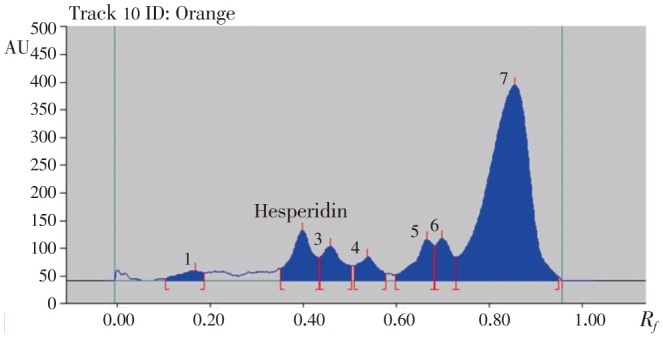
Table 5. Contents of hesperidin in different varieties of methanolic extracts of citrus peels.
| Samples | Contents (mean±SD, % w/w) | % RSD |
| Grape fruits (Citrus paradisi) | 11.15±2.34 | 4.11 |
| Mosambi (Citrus limetta) | 3.79±2.56 | 5.56 |
| Lemon (Citrus lemon) | 1.72±2.53 | 3.67 |
| Orange (Citrus sinensis) | 1.29±1.78 | 5.87 |
Figure 6. HPTLC chromatogram of methanolic extract of mosambi peels.
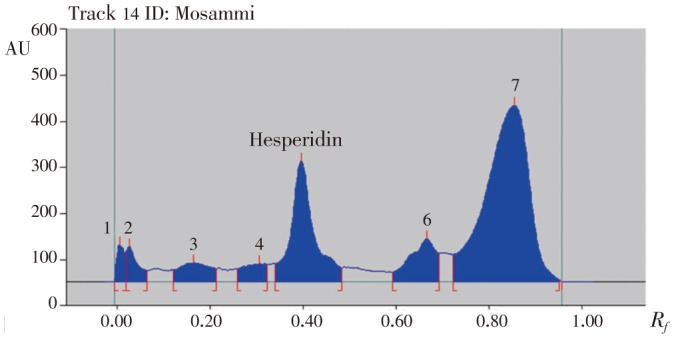
Figure 7. HPTLC chromatogram of methanolic extract of lemon peels.
4. Discussion
A validated HPTLC method has been developed to determine the quantity of hesperidin in methanolic extracts of four different varieties of citrus peels. The mobile phase ethyl acetate-methanol-water 15:3:2 (%, v/v) resulted in a sharp, symmetrical, and well resolved peak at Rf value of 0.40. Linear regression data for the plot confirmed the good linear relationship and the resulting equation was operational in the concentration range of 100-800 ng/spot. The method was accurate 98.55%-99.38%, with RSD values in the range 0.75-1.12 after spiking the hesperidin with different concentrations of standard.The HPTLC method developed for quantitation of hesperidin was found to be simple, accurate, reproducible and sensitive and is applicable to the analysis of methanolic extracts of four different varieties of citrus peels. Also it will find wide applications in standardization and quality control of herbal raw materials as well as formulations. Statistical data proves that the method is reproducible and selective for the analysis of hesperidin with added advantages of short time, minimal sample preparation, in addition to the low cost.
Acknowledgments
This project was supported by Grant No.33/S/54, Deanship of Scientific Research, Salman Bin Abdulaziz University, Al-Kharj, KSA. The authors are grateful to Department of Pharmacognosy, King Saud University, Riyadh, Kingdom of Saudia Arabia for providing facilities to carry out this study.
Comments
Background
HPTLC is an important technique for standardization and identification of different chemical constituents from medicinal plants. Hesperidin is flavanone glycoside found abundantly in citrus peels and possess various pharmacological activity. Therefore the aim of present investigation was to develop a simple, precise and accurate HPTLC densitometric method for the estimation hesperidin. The studies were carried out to quantitative estimation of hesperidin by HPTLC in different varieties of citrus peels.
Research frontiers
The present aim of this research work is to develop and validate a simple, accurate HPTLC method for the quantitative estimation of hesperidin by HPTLC in different varieties of citrus peels.
Related reports
No single method has been reported for the quantitative estimation of hesperidin by HPTLC in different varieties of citrus peels as per literature review available in our resources.
Innovations and breakthroughs
The proposed HPTLC method can be used for quantitative estimation of hesperidin by HPTLC in different varieties of citrus peels without interference.
Applications
The proposed method for estimation of hesperidin by HPTLC in different varieties of citrus peels is first validated HPTLC method and its statistical data proves that the method is reproducible and selective for the analysis of hesperidin with added advantages of, speed and minimal, low cost of reagents satisfactory precision and accuracy. This method may be used for quality control and standardization of different varieties of citrus peels and marketed herbal formulations.
Peer review
This is a good study in which the authors work to estimate the amount of hesperidin in different varieties of citrus peels. Statically data proved that proposed method can be used in wide range for detection and estimation of hesperidin in different varieties of citrus peels.
Footnotes
Foundation Project: Supported by Deanship of Scientific Research, Salman Bin Abdulaziz University, Al-Kharj, KSA (Grant No.33/S/54).
Conflict of interest statement: We declare that we have no conflict of interest.
References
- 1.Hirata A, Murakami Y, Shoji M, Kadoma Y, Fujisawa S. Kinetics of radical-scavenging activity of hesperetin and hesperidin and their inhibitory activity on COX-2 expression. Anticancer Res. 2005;25:3367–3374. [PubMed] [Google Scholar]
- 2.Wilmsen PK, Spada DS, Salvador M. Antioxidant activity of the flavonoid hesperidin in chemical and biological systems. J Agric Food Chem. 2005;15:4757–4761. doi: 10.1021/jf0502000. [DOI] [PubMed] [Google Scholar]
- 3.Garg A, Garg S, Zaneveld LJ, Singla AK. Chemistry and pharmacology of the citrus bioflavonoid hesperidin. Phytother Res. 2001;15:655–669. doi: 10.1002/ptr.1074. [DOI] [PubMed] [Google Scholar]
- 4.Lee NK, Choi SH, Park SH, Park EK, Kim DH. Antiallergic activity of hesperidin is activated by intestinal microflora. Pharmacology. 2004;71:174–180. doi: 10.1159/000078083. [DOI] [PubMed] [Google Scholar]
- 5.Crespo ME, Gálvez J, Cruz T, Ocete MA, Zarzuelo A. Anti-inflammatory activity of diosmin and hesperidin in rat colitis induced by TNBS. Planta Med. 1999;65:651–653. doi: 10.1055/s-2006-960838. [DOI] [PubMed] [Google Scholar]
- 6.Galati EM, Monforte MT, Kirjavainen S, Forestieri AM, Trovato A, Tripodo MM. Biological effects of hesperidin, a citrus flavonoid. (Note I): antiinflammatory and analgesic activity. Farmaco. 1994;40:709–712. [PubMed] [Google Scholar]
- 7.Emim JA, Oliveira AB, Lapa AJ. Pharmacological evaluation of the anti-inflammatory activity of a citrus bioflavonoid, hesperidin, and the isoflavonoids, duartin and claussequinone, in rats and mice. J Pharm Pharmacol. 1994;46:118–122. doi: 10.1111/j.2042-7158.1994.tb03753.x. [DOI] [PubMed] [Google Scholar]
- 8.Al-Ashaal HA, El-Sheltawy ST. Antioxidant capacity of hesperidin from citrus peel using electron spin resonance and cytotoxic activity against human carcinoma cell lines. Pharm Biol. 2011;49:276–282. doi: 10.3109/13880209.2010.509734. [DOI] [PubMed] [Google Scholar]
- 9.Xia J, Kotani A, Hakamata H, Kusu F. Determination of Hesperidin in pericarpium citri reticulatae by semi-micro HPLC with electrochemical detection. J Pharm Biomed Anal. 2006;41:1401–1405. doi: 10.1016/j.jpba.2006.02.030. [DOI] [PubMed] [Google Scholar]
- 10.Cornara L, D'Arrigo C, Pioli F, Borghesi B, Bottino C, Patrone E, et al. et al. Micromorphological investigation on the leaves of the rock samphire (Crithmum maritimu L.): occurrence of hesperidin and diosmincrystals. Plant Biosyst. 2009;143:283. [Google Scholar]
- 11.Kanaze FI, Gabrieli C, Kokkalou E, Georgarakis M, Niopas I. Simultaneous reversed-phase high-performance liquid chromatographic method for the determination of diosmin, hesperidin and naringin in different citrus fruit juices and pharmaceutical formulations. J Pharm Biomed Anal. 2003;33:243–249. doi: 10.1016/s0731-7085(03)00289-9. [DOI] [PubMed] [Google Scholar]
- 12.He JX, Zhang Q, Lin SH. Quantitative analysis of narigin and hesperidin contents in Citrus aurantium juice by reverse-phase high-performance liquid chromatography. Modern Food Sci Technol. 2008 doi: 10.3969/j.issn.1673-9078.2008.01.026. [DOI] [Google Scholar]
- 13.El-Shafae AM, El-Domiaty MM. Improved LC methods for the determination of diosmin and/or hesperidin in plant extracts and pharmaceutical formulations. J Pharm Biomed Anal. 2001;26:539–545. doi: 10.1016/s0731-7085(01)00476-9. [DOI] [PubMed] [Google Scholar]
- 14.Sun Y, Wang J, Gu S, Liu Z, Zhang Y, Zhang X. Simultaneous determination of flavonoids in different parts of Citrus reticulata ‘Chachi’ fruit by high performance liquid chromatography Photodiode Array Detection. Molecules. 2010;15:5378–5388. doi: 10.3390/molecules15085378. [DOI] [PMC free article] [PubMed] [Google Scholar]
- 15.Li K, Yuan J, Su W. Determination of liquiritin, naringin, hesperidin, thymol, imperatorin, honokiol, isoimperatorin, and magnolol in the traditional Chinese medicinal preparation Huoxiang-zhengqi liquid using high-performance liquid chromatography. Yakugaku Zasshi. 2006;126:1185–1190. doi: 10.1248/yakushi.126.1185. [DOI] [PubMed] [Google Scholar]
- 16.Li X, Xiao H, Liang X, Shi D, Liu J. LC-MS/MS determination of naringin, hesperidin and neohesperidin in rat serum after orally administrating the decoction of Bulpleurum falcatum L. and Fractus aurantii. J Pharm Biomed Anal. 2004;34:159–166. doi: 10.1016/j.japna.2003.08.002. [DOI] [PubMed] [Google Scholar]
- 17.Tong L, Zhou D, Gao J, Zhu Y, Sun H, Bi K. Simultaneous determination of naringin, hesperidin, neohesperidin, naringenin and hesperetin of Fractus aurantii extract in rat plasma by liquid chromatography tandem mass spectrometry. J Pharm Biomed Anal. 2012;58:58–64. doi: 10.1016/j.jpba.2011.05.001. [DOI] [PubMed] [Google Scholar]
- 18.International Conference on Harmonisation (ICH) ICH harmonised triplicate guideline on validation of analytical procedures. In: International conference on harmonisation of technical requirements for registration of pharmaceuticals for human use; Switzerland: ICH. 2010.
- 19.Alam P, Ali M, Singh R, Shakeel F. A new HPTLC densitometric method for analysis of swertiamarin in Enicostemma littorale and commercial formulations. Nat Prod Res. 2011;25:17–25. doi: 10.1080/14786411003754348. [DOI] [PubMed] [Google Scholar]
- 20.Alqasoumi SI, Alam P, Abdel-Kader MS. Stability-indicating HPTLC densitometric method for qualitative and quantitative analysis of arbutin in commercial whitening creams. J Planar Chromatogr-Mod TLC. 2012;25:168–173. [Google Scholar]
- 21.Alam P. Densitometric HPTLC analysis of 8-gingerol in Zingiber officinale extract and ginger-containing dietary supplements, teas and commercial creams. Asian Pac J Trop Biomed. 2013;3:634–638. doi: 10.1016/S2221-1691(13)60128-8. [DOI] [PMC free article] [PubMed] [Google Scholar]


