

Abstract
Obesity has dramatically increased in prevalence, making it essential to understand its accompanying metabolic changes. Modeling diet-induced obesity in Drosophila melanogaster (fruit flies), we elucidated transcriptional and metabolic changes in w1118 flies on a high-fat diet (HFD). Mass spectrometry-based metabolomics revealed altered fatty acid, amino acid, and carbohydrate metabolism with HFD. Microarray analysis uncovered transcriptional changes in nitrogen metabolism, including CG9510, homolog of human argininosuccinate lyase (ASL). CG9510 knockdown in flies phenocopied traits observed with HFD, namely increased triglyceride levels and decreased cold tolerance. Restoration of CG9510 expression ameliorated observed negative consequences of HFD. Metabolomic analysis of CG9510 knockdown flies confirmed functional similarity to ASL, regulating the balance of carbon and nitrogen metabolism. In summary, we found that HFD suppresses CG9510 expression, a gene required for proper triglyceride storage and stress tolerance. These results draw an important link between regulation of amino acid metabolism and the response to diet-induced obesity.
Abbreviations: AcCoA, acetyl-coenzyme A; arm-GAL4, armadillo-GAL4; ASL, argininosuccinate lyase; BCAA, branch chain amino acid; CAFE, capillary feeder; da-GAL4, daughterless-Gal4; EASE, Expression Analysis Systematic Explorer (DAVID analysis); FAME, fatty acid methyl ester; Fdr, false discovery rate; GC/MS, gas chromatography/mass spectrometry; HFD, high-fat Diet; MeOH, methanol; PCR, polymerase chain reaction; RT-PCR, reverse-transcriptase PCR; TBDMS, tert-butyldimethylsilyl; TCA, tricarboxylic acid; TG, triglyceride; TMS, trimethylsilyl; VDRC, Vienna Drosophila RNAi Center; w1118, white-1118
Keywords: Argininosuccinate lyase, Lifespan, Metabolism, Obesity, Triglyceride
1. Introduction
The negative impact of a high-fat diet on the human population is becoming increasingly evident, with over 60% of the US population obese or overweight [1], including a growing percentage of children and adolescents [2]. The strain that obesity creates within the body contributes to a multitude of diseases, including type 2 diabetes, stroke, sleep apnea, and cardiovascular diseases [1,3]. With a severely increased risk of morbidity and mortality in obese adults, as well as a predisposition for adult-onset disease in obese children and adolescents [2,4–7], it is vital to better understand the underlying mechanistic changes that occur with the onset of obesity.
It has been hypothesized that metabolic homeostasis is deranged in disorders associated with obesity, such as insulin resistance and diabetes. While many of the metabolic regulatory pathways affected in these disorders, such as AMPK, mTOR, and insulin, have their specific individual function, they are all interconnected in a larger network to regulate organismal and cellular responses [8]. In order to elucidate the mechanisms underlying the response to dietary changes, it is necessary to look beyond a single metabolic pathway and instead at the interplay between fat, carbohydrate, and amino acid metabolism. A clear example of this relationship can be found in obesity-related insulin resistance and type 2 diabetes. Although most investigations of these disorders have focused on glucose metabolism, increasing evidence suggests that other metabolic disturbances are at play, including changes in fat and amino acid metabolism [9,10], which could contribute to the disorders.
Given the complexity of the whole-body response to dietary changes, invertebrate model organisms can serve as useful tools to examine the interplay between genes, signaling pathways, and metabolism [11–14]. Regulatory pathways such as insulin/IGF signaling and TOR are highly conserved and exert significant control over metabolism, including lipid and glucose homeostasis, in invertebrates just as in mammals [12,15–20].
We previously found that a high-fat diet (HFD) had a clearly deleterious phenotype in Drosophila melanogaster, characterized by increased triglyceride and glucose levels, decreased stress tolerance and decreased lifespan [21]. It has also been shown that a HFD can induce cardiac fat accumulation and dysfunction in Drosophila [18]. These phenotypic changes resemble those seen in human obesity [6,7,22,23], strengthening the use of Drosophila as a model system for studying obesity.
In this work, we examined the transcriptional and metabolic responses to a HFD in our Drosophila model, given that (a) many of the metabolic and signaling pathways involved in fat metabolism and insulin signaling in humans are conserved in flies and (b) Drosophila have many organ systems analogous to humans that control uptake, storage and metabolism [24–28]. To better understand the molecular changes associated with HFD, we performed microarray analyses in conjunction with mass spectrometry-based metabolomics. We then took advantage of the many genetic tools available in fruit flies, in particular the UAS-GAL4 system, to determine the role of genes associated with the phenotypic and molecular changes we identified. Our data lead us to propose that (a) specific metabolic pathways are altered by HFD, and (b) corresponding key transcriptional changes are occurring in response to disrupted metabolic homeostasis.
2. Materials and methods
2.1. Fly rearing and collection
All stocks were maintained on standard cornmeal Drosophila medium in an incubator at 25 °C and 30–50% humidity. Adult flies were collected at 0–3 days and transferred to a separate vial of the standard cornmeal medium. After aging for 3 more days, male and female flies were separated and, to remain consistent with previous work in our lab [21], only the females were transferred to the experimental diets and kept in room air.
2.2. Drosophila stocks
All UAS-RNAi transgenic lines, as well as their controls w1118 and y,w[1118]; P{attP, y[+], w[3′]}, were obtained from the VDRC [8,29]. The GAL4 driver stocks and P-element (w1118; PBac{PB}CG9510c05706 CG9515c05706) (referred to as CG9510-PBac) were obtained from Bloomington Drosophila Stock Center (Bloomington, IN, USA). The transgenic P{CaryP}attP2-UAS9510 (UAS-CG9510) line was created in our lab. To create this line, CG9510 cDNA was subcloned into the pUAST-attB vector from GM20637 (DGRC) using EcoRI and XbaI sites appended to the PCR product using the following primers: 5′-ATATAGAATTCATGAGCAACTTTTGTTTTAAAGATAAC-3′ and 5′-ATATATCTAGACTACGACTGTTTGGCCAAATC-3′. Transgenic flies were generated by injecting embryos carrying P{CaryP}attP2 at 68A4 (Rainbow Transgenic Flies, Inc).
2.3. Experimental diets: regular and high-fat
Jazz Mix Drosophila food from New Horizon Foods was prepared as directed and placed in plastic vials as the regular diet (RD). The high-fat diet (HFD) was based on a recipe developed by Dr. Sean Oldham at the Sanford/Burnham Institute, adding coconut oil to the regular food as a source for increased saturated fat in the diet [18]. The recipe has been specialized for the current model, with coconut oil added in the amount of 20% weight per volume in the HFD (approximately 70% calories from fat) [21].
2.4. Metabolite extraction and GC/MS analysis
Metabolite extraction, derivatization and analysis are described in detail in the Supporting Information. Briefly, female flies were kept on RD or HFD for one week, after which groups of 5 flies were placed in 2 ml ceramic bead tubes (1.4 mm, MoBio 13113-50) and weighed. Immediately −80 °C 9:1 methanol water mixture (MeOH, Cat# 34860, Sigma-Aldrich) was added and the tube was placed in a cooling bath of dry ice and isopropanol (approximately −78 °C) [30]. Flies were homogenized, transferred to an eppendorf tube and mixed with ice cold water. To separate polar and non-polar phases, ice-cold chloroform was added and the tube was vortexed and centrifuged at room temperature. For analysis of general free polar metabolites and uric acid, two aliquots of the aqueous phase were transferred to the gas chromatography/mass spectrometry (GC/MS) sampler tube for evaporation in a refrigerated vacuum centrifuge. For analysis of total fatty acids, the aliquot of the organic phase containing the non-polar fraction was collected in the eppendorf tube and evaporated under airflow at room temperature. For derivatization of polar metabolites, dried polar metabolite aliquots were dissolved in 2% methoxyamine hydrochloride in pyridine and incubated at 37 °C. Subsequent conversion to their tert-butyldimethylsilyl (TBDMS) and trimethylsilyl (TMS) derivatives was accomplished by adding N-methyl-N-(tert-butyldimethylsilyl) trifluoroacetamide+1% tert-butyldimethylchlorosilane or N-Methyl-N-(trimethylsilyl) trifluoroacetamide and incubating at 37 °C. Fatty acid methyl esters were generated by dissolving dried fatty acid aliquots in 2% (v/v) methanolic sulfuric acid and subsequently extracted in hexane with saturated NaCl.
GC/MS analysis was performed using an Agilent 7890A with a 30 m DB-35MS capillary column (Agilent Technologies) connected to an Agilent 5975C MS. For quantification of metabolites, selected ion fragments were integrated using a MATLAB-based in-house algorithm [31–33]. Additional ions are listed in Supporting Information. The relative quantification of total fly metabolites was determined by normalizing to the intensity of the added internal standards during extraction and measured fly body weights.
2.5. Oxygen consumption
Oxygen consumption rates in normoxia were measured as previously described [34], with some modifications. Adult female flies were placed on either RD or HFD on Day 1 after eclosion and remained on their diet for 7 days. On the final day, flies were transferred to a 5 ml vial in groups of 150 flies per oxygen consumption measurement. After 20 min of acclimation, the testing vial was sealed and oxygen levels were monitored over 35-60 minutes. Following measurements, flies were frozen and weighed.
2.6. Microarrays and data analysis
GeneChipH Drosophila Genome 2.0 Arrays (Affymetrix, Santa Clara, CA) were used in this study, with three arrays per diet group (w1118 on RD and HFD). Following one week on RD or HFD, flies were homogenized and total RNA was extracted from each sample using Trizol (Invitrogen, Carlsbad, CA) followed by purification with RNeasy Kit (Qiagen, Carlsbad, CA) as per manufacturer's instructions. Hybridization of the RNA to the Affymetrix GeneChipsH, washing and scanning were done according to protocols recommended by Affymetrix using an Affymetrix GeneChip fluidic station and scanner (Affymetrix, Santa Clara, CA). The raw data were normalized using Bioconductor Affy software (www.bioconductor.org/packages/2.0/bioc/html/affy.html), followed by analysis of the normalized data for each array spot with VAMPIRE microarray suite [35]. A spot was considered differentially expressed between two samples when the threshold of false discovery rate (fdr) was smaller than 0.05. Significance limits were set at changes of 1.5-fold (for up-regulated genes) and 0.67-fold (for down-regulated genes). Further analysis was done with genes at or above ±2.0-fold change. DAVID Bioinformatics software was used to identify genes involved in significantly affected KEGG pathways and functional clusters, as determined by the EASE (Expression Analysis Systematic Explorer) analysis implemented in DAVID functional annotation tool (http://david.niaid.nih.gov/david/ease.htm) [36,37]. The microarray analysis data from this publication have been submitted to the Gene Expression Ominibus database at http://www.ncbi.nlm.nih.gov/geo and assigned the access number GSE46358.
2.7. Quantitative real-time PCR analysis
Following one week on RD or HFD, flies were homogenized and total RNA was extracted using Trizol (Invitrogen, Carlsbad, CA), followed by purification with the RNeasy kit (Qiagen, Carlsbad, CA) as per manufacturer's instructions. cDNA was produced from total RNA through RT-PCR using Superscript III First-Strand Synthesis system (Invitrogen, Carlsbad, CA). Real-time PCR was performed using a GeneAmp 7500 sequence detection system using POWER SYBR Green chemistry (Applied Biosystems, Foster City, CA). Two primers used were used for CG9510: CG9510-A (fwd: GAAGATTCTACCCGGTGACG; rev: GACCACCTGGTCATTTCTGC); and CG9510-B (fwd: ATCCATCATGACCCAGATCC; rev: TAGAGGCGAGAATCGTAGGG) [38]. The expression level of actin was used as an internal control to normalize the results (fwd: CTAACCTCGCCCTCTCCTCT; rev: GCAGCCAAGTGTGAGTGTGT). The fold change was calculated relative to the expression level of the respective control (w1118 or the progeny of w1118 crossed with the UAS-RNAi or UAS-CG9510) on RD.
2.8. Triglyceride, protein and glucose measurements
After one week in a specific oxygen condition, flies were collected in groups of five female flies and placed in 1.5 ml microcentrifuge tubes. Their live weight was determined and the flies were frozen on dry ice. They were then homogenized using Precelly's 24 homogenizer and prepared as described in Grönke 2003 [39] to measure absolute triglyceride levels using the Thermo Infinity Triglyceride kit and protein levels using Pierce BCA protein assay. Whole-body total glucose was determined as described in Birse 2010 [18]. Groups of five female flies were homogenized in 500 µl 100 mM PIPES buffer (Sigma P6757) with 1.25 µl porcine kidney trehalase (Sigma T8778), allowing for measurement of total available glucose by hydrolyzing trehalose into glucose. The homogenates were incubated at 37 °C for 1 h and the supernatants transferred to a 96-well plate in triplicate. Glucose levels were quantified using the Glucose GO assay kit (Sigma-Aldrich, Saint Louis, MO) according to the manufacturer's instructions. In brief, glucose is oxidized to gluconic acid and hydrogen peroxide by glucose oxidase. The hydrogen peroxide then reacts with o-dianisidine in the presence of peroxide to form a colored product, and the oxidized o-dianisidine reacts with sulfuric acid to form a more stable colored product. The intensity of the color is proportional to the original glucose concentration and was measured at 520 nm using a BioTek Synergy HT microplate reader.
2.9. Capillary feeder (CAFE) assay
Flies were placed on RD for 4 days. Following that time, groups of 5 flies were placed in a plastic vial with only a piece of filter paper containing 500 μl water. Through the top plug, a capillary tube was inserted containing 5 μl liquid food (5% yeast, 5% sucrose) as described in Ja et al. [40]. The capillary tube was removed every 24 h and replaced with a new capillary tube containing 5 μl of food. The flies were allowed to adjust to the new setup for the initial 24 h, after which measurements were taken each time the capillary was removed, measuring the difference in level of food (in mm). Knowing the initial height (in mm) of the 5 μl, the calculated μl/mm could be multiplied by the change in food level to determine how much food (in μl) was consumed.
2.10. Cold stress tolerance
The cold tolerance assay was performed immediately following a week on RD or HFD. A −5 °C bath was made using water, ice and salt. For each group, sets of 10 female flies were placed in empty plastic vials and into the water bath. Flies fell unconscious almost immediately and vials were checked to make sure all flies were at the bottom and thus submerged in the cold bath. They remained as such for 2 h, with the temperature being checked regularly throughout. At the end of the 2 h, vials were removed from the water bath, and flies transferred to RD and left to recover at room temperature. After 24 h, survival was recorded as the number of flies that had regained consciousness.
2.11. Lifespan
Female adult flies were placed on RD or HFD, with 10 flies per vial of food. The lifespan of the flies on each diet was observed by recording the number of flies alive each day. Flies were transferred to fresh RD or HFD food every 3–4 days. The experiment was concluded when there were no flies remaining in a group or when one group was below 50% survival and there was a clear difference between groups.
2.12. Semi-intact Drosophila heart preparation and digital high-speed movie analysis
All the dissection steps were done in artificial hemolymph containing 108 mM NaCl2, 5 mM KCl, 2 mM CaCl2, 8 mM MgCl2, 1 mM NaH2PO4, 4 mM NaHCO3, 15 mM HEPES, 10 mM Sucrose, 5 mM trehalose, at pH 7.1 [41]. The flies were anesthetized with fly-nap, followed by transfer to a Petri dish coated with Vaseline for dissection [42]. After the dissection, the submerged hearts were oxygenated for 15 min at room temperature for equilibration. Next, the dish chamber is installed on a Leica DM-LFSA microscope with a 10× water immersion lens. The digital high-speed movies of the heartbeats are acquired using a Hamamatsu EM-CCD digital high-speed camera and HCI image capture software (Compix Imaging System). Movie analysis of the heart activity is then carried out according to previous reports [41,43].
2.13. Statistical analysis
Graphpad Prism was used for statistical analysis. A t-test was used to determine significance between RD and HFD results in most assays. In lifespan measurement, the significance was determined by comparing the survival curves with a log-rank (Mantel–Cox) test. A chi (χ) square test was used in analyzing heart dysfunction.
3. Results
3.1. Metabolomic analysis of flies on HFD
We previously showed that adult female flies fed a HFD exhibit increased triglyceride levels and decreased stress tolerance relative to their counterparts on RD [21]. In this work we explored the underlying changes in metabolism occurring in these flies, using mass spectrometry to analyze the relative abundance of metabolites in control (w1118) flies on RD compared to genetically identical flies on a HFD. HFD significantly increased (1.2–2.7-fold of normal) total fatty acid abundance, including myristate, palmitate, oleate and stearate (Figure 1A). Flies on a HFD had altered carbohydrate metabolism, as evidenced by dramatically increased lactate (20-fold of normal) and pyruvate (2.8-fold of normal) levels. Amino acid metabolism was also affected by HFD, with an increase in both urea and uric acid abundance and an overall decrease in many amino acids (Figure 1B and C). Additionally, we observed slight decreases in some tricarboxylic acid (TCA) metabolites, including fumarate, alpha-ketoglutarate, and malate, though individually none of these changes was statistically significant. As seen in other HFD models [44–46], the overall metabolic rate of flies on a HFD was significantly increased, with a 1.4-fold increase in oxygen consumption in flies on a HFD compared to RD (Figure S1).
Figure 1.
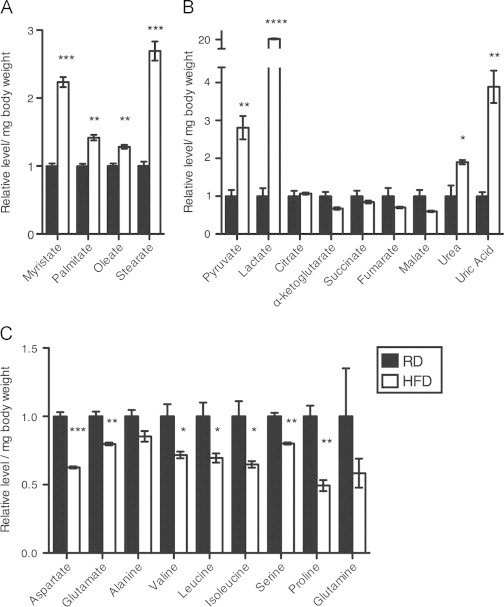
Increased fatty acids and altered carbohydrate and amino acid metabolism due to HFD. Adult female w1118 flies were put on RD or HFD for one week prior to metabolite extraction with whole-body homogenate and GC/MS analysis. Shown is the relative abundance of (A) fatty acids, (B) organic acids and (C) amino acids in flies on RD and HFD, normalized to body weight and divided by the average metabolite abundance in the RD flies. For metabolites with multiple fragments available, consistent changes were observed in each and one fragment was selected to represent the metabolite. Three sets of five female flies were analyzed for each diet condition. Error bars indicate standard error. Significance between relative abundance values of the HFD and RD groups for each metabolite was determined with a t-test, *=p <0.05 **=p<0.01 ***=p <0.001 ****=p <0.0001.
3.2. Transcriptional changes in flies on HFD
The correlation between HFD and amino acid metabolism was also seen at a transcriptional level. When we performed a microarray of whole flies on either RD or HFD, flies on HFD altered the expression of 1327 genes (1030 up, 297 down), with 381 genes (273 up, 108 down) changing≥two-fold (Figure 2A, Supplementary Dataset). Using specific criteria intended to sort out genes with a potentially higher likelihood of impacting the phenotype, the initial list of genes was narrowed down to 33 candidate genes. These criteria selected genes (a) within the group of 381 genes with a ≥two-fold change in gene expression and (b) that are part of a statistically significant pathway or functional cluster as determined with DAVID bioinformatics software [36,37]. The functional clusters with the highest biological significance ranking contained gene-annotation groups that included extracellular region or secretion, immune response, carbohydrate binding, and ion transport (Figure 2B). Significantly affected pathways were those involved in the metabolism of amino acids, metabolism of glycerophospholipids, and breakdown of sugars and waste products (Figure 2C).
Figure 2.
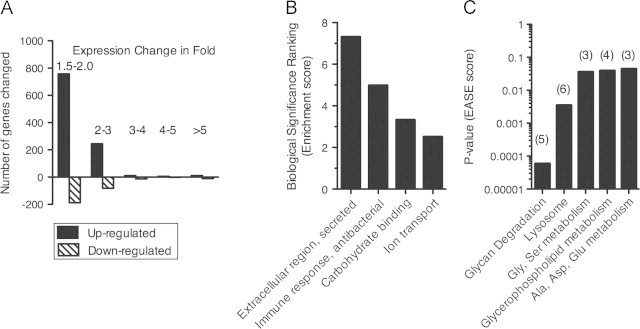
Gene expression changes in Drosophila on HFD compared to RD. Adult female w1118 flies (d3-5) were placed on RD or HFD for one week prior to microarray analysis. (A) Distribution of fold-changes of gene expression in Drosophila on a HFD (vs. RD). (B and C) Analysis of genes with at least 2-fold change in expression due to HFD was done with DAVID bioinformatics software [36,37] to show statistically significant functional clusters and KEGG pathways. (B) Functional clusters of gene-annotation groups involved in extracellular region or secretion, immune response, carbohydrate binding, and ion transport had the highest biological significance ranking, as determined using the EASE score in DAVID. (C) For enriched KEGG pathways, P-values are shown on y-axis on a log scale, and the number of genes significantly changed within the pathway is listed in parenthesis at the top of each bar. Pathways and p-values from DAVID: dme00511: Other glycan degradation (p<0.0001), dme04142: Lysosome (p<0.01), dme00260: Glycine, serine and threonine metabolism (p<0.05), dme00564: Glycerophospholipid metabolism (p<0.05), dme00250: Alanine, aspartate and glutamate metabolism (p<0.05).
To further understand the roles of these candidate genes in metabolic homeostasis, we evaluated the phenotypes of flies following RNAi knockdown by the ubiquitously expressed daughterless (da)–GAL4 or armadillo (arm)–GAL4 drivers (Table I). This approach allowed us to test whether the changes in gene expression we observed by microarray were necessary for or merely correlated with the HFD phenotype (Figure 3A). We previously established that cold tolerance was consistently and dramatically decreased in flies on HFD, making it a clear phenotype to evaluate in the transgenic flies [21]. Thus, the same assay was used in the present study to test sensitivity to cold. After the transgenic flies had been on their respective diets for one week, they were stressed with severe cold and their survival compared to control flies on the same diet (Figure 3B and C). As expected, most control flies on RD were able to survive the cold stress (65%), while only 9% of those on HFD survived (Figure 3B and C). This effect suggests that changes have occurred in flies on a HFD that prevent them from activating mechanisms necessary for recovery from a severe stress. We then tested the roles of specific genes in cold stress caused by HFD. RNAi knockdown or mutation of two different genes on RD reduced survival, even on RD, indicating that down-regulating those candidate genes act like HFD to impair the cold stress response (Figure 3B). In contrast, knockdown of four genes increased survival compared to controls on HFD. Down-regulating these genes thus render flies more resistant to cold stress on HFD (Figure 3C). Based on these results, at least six candidate genes may be required for the effects of HFD on sensitivity to cold stress. These genes are CG9510, CG6806, CG18108, CG32356, CG5873, and CG1934.
Figure 3.
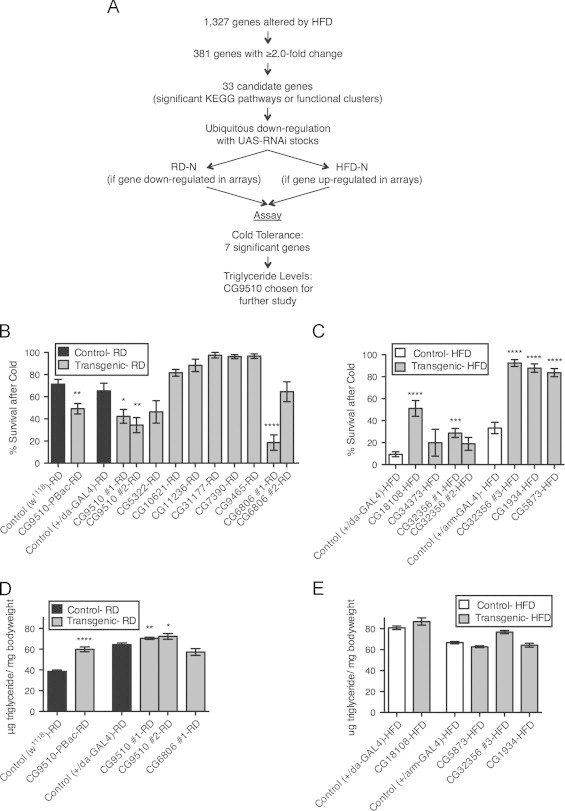
Screening candidate genes from microarray analysis of HFD compared to RD. (A) Paradigm for identification and screening of candidate genes from microarray analysis. Candidate genes with available UAS-RNAi lines were crossed with daughterless (da)- or armadillo (arm)-GAL4 to ubiquitously down-regulate the gene. Adult female progeny (d3-5) of these crosses were placed on RD or HFD depending on the direction of change in the microarray. After one week on the diets, progeny were compared with control flies on similar diets and assayed for cold tolerance and triglyceride level to see if down-regulation of the gene caused a change either simulating the HFD phenotype (for those on RD) or diminishing the severity of the HFD phenotype (for those on HFD). (B and C) Percent survival after cold stress of transgenic flies (P-element line CG9510-PBac and progeny of UAS-RNAi×da-GAL4 or UAS-RNAi×arm-GAL4, labeled with gene name) on RD (B) or HFD (C) compared to background-specific control flies on corresponding diets (Controls: w1118;+/+, w1118;+/da-GAL4, w1118;+/arm-GAL4). Multiple UAS-RNAi lines were evaluated for CG9510, CG6806, and CG32356 and are marked with a #1-3 following the gene name. (D and E) Triglyceride levels from whole-body homogenate of transgenic flies (CG9510-PBac and progeny from UAS-RNAi x da-GAL4 or UAS-RNAi x arm-GAL4, labeled with gene name) on RD (D) or HFD (E), compared to background-specific control flies on corresponding diets (Controls: w1118;+/+, w1118;+/da-GAL4, w1118;+/arm-GAL4) Specific RNAi stocks and GAL4 drivers used are listed in Table I. Flies were tested in sets of 10 females per vial for cold tolerance, 5 females for TG levels: (B and C) n=between 6-15 sets (60–150 flies per experimental group), (D and E) n=5–14 sets (25–70 flies per experimental group). Error bars indicate standard error. Significance between values for each experimental group and its respective control was determined with a t-test, *=p<0.05 **=p<0.01 ***=p<0.001 ****=p<0.0001.
Triglyceride (TG) levels are also strikingly affected by HFD. Indeed, control flies on RD store an average of 47.6±13.2 μg/mg bodyweight compared to 77.9±8.6 μg/mg bodyweight in flies on HFD. To determine if the six candidate genes that modulate sensitivity to cold stress induced by HFD also regulate TG levels, these genes were knocked down and TGs measured in animals on RD or HFD (Figure 3D and E). We found that knockdown of CG9510 caused triglyceride levels to increase (Figures 3D and S2). CG9510 is involved in arginine biosynthesis and was down-regulated 2.3 fold by HFD. Importantly, ubiquitous knockdown using two RNAi lines as well as an apparent loss-of-function P-element mutation in CG9510 (Figure S3) increased sensitivity to cold stress and increased TG levels in response to HFD. This relation could not be accounted for by an increase in food consumption in the knockdown and mutant animals (Figure S4). Our data thus suggests that increased TG levels and sensitivity to cold stress share underlying genetic mechanisms.
3.3. Characterization of CG9510 in HFD phenotype
Given the results of the metabolomic analysis and the affected pathways uncovered by our microarray studies, we decided to pursue the relation between amino acid metabolism and HFD by further characterizing the function of CG9510. We took advantage of tissue-specific GAL4 drivers to knockdown expression of CG9510 in various cell types, including several classes of neurons, glia, muscle, fat body, imaginal discs and malpighian tubules. In most tissues examined, knockdown of CG9510 led to increased cold sensitivity and increased TG levels, with the strongest effect seen when knockdown occurred in dopaminergic and serotonergic neurons (Figure 4). Since similar effects were obtained by knockdown in any of various tissues, we believe CG9510 is required systemically for metabolic homeostasis. Knockdown of CG9510 did not phenocopy HFD in all respects, however, since glucose levels were elevated only by HFD (Figure S5).
Figure 4.
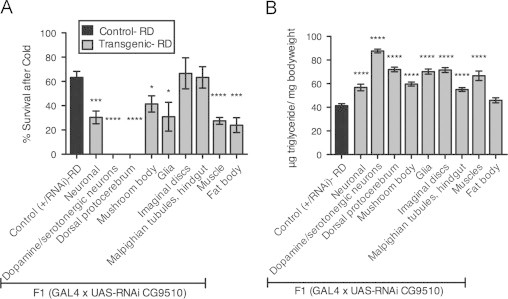
Down-regulating CG9510 in various tissues simulates HFD phenotype. Adult female progeny (d3-5) from crosses between the UAS-RNAi line (CG9510 #1) and various GAL4 drivers, as well as control progeny from a w1118×CG9510 UAS-RNAi cross (+/RNAi) were put on RD for one week prior to the assay. (A) Percent survival after cold stress (2 h at −5°, with 24 h recovery in room air) and (B) triglyceride levels (per mg of bodyweight) from whole-body homogenate of flies with CG9510 down-regulated in specific tissues were compared to control values. Tissues affected by GAL4 drivers included: neurons (elav-GAL4), dopaminergic and serotonergic neurons (Ddc-GAL4), neurons of the dorsal protocerebrum, mushroom body and fan-shaped body (c061-GAL4), mushroom body (Tab2-GAL4), glia (repo-GAL4), imaginal discs (c601-GAL4), malpighian tubules and hindgut (c591-GAL4), muscles (24B-GAL4) or fat body (lsp2-GAL4). Flies were tested in sets of 10 females per vial for cold tolerance, 5 females for TG levels: (A) n=5–12 sets (50–120 flies per experimental group), (B) n=6–10 sets (30–50 flies per experimental group). Error bars indicate standard error. Significance between values for each experimental group and control was determined with a t-test, *=p<0.05 ***=p<0.001 ****=p<0.0001.
Since down-regulation of CG9510 increases TG levels of RD flies, we asked whether up-regulation of CG9510 could restore normal TG levels of flies on a HFD and improve their stress tolerance. To address this question, we made a transgenic line with CG9510 under UAS control. When crossed to animals bearing ubiquitously expressing da-GAL4, this line produced progeny in which CG9510 expression was elevated nearly 10-fold compared to controls (Figure S3). Importantly, ubiquitous expression of UAS-CG9510 under da-GAL4 control restored normal RD-like cold tolerance and TG levels to animals on HFD (Figure 5A and B).
Figure 5.
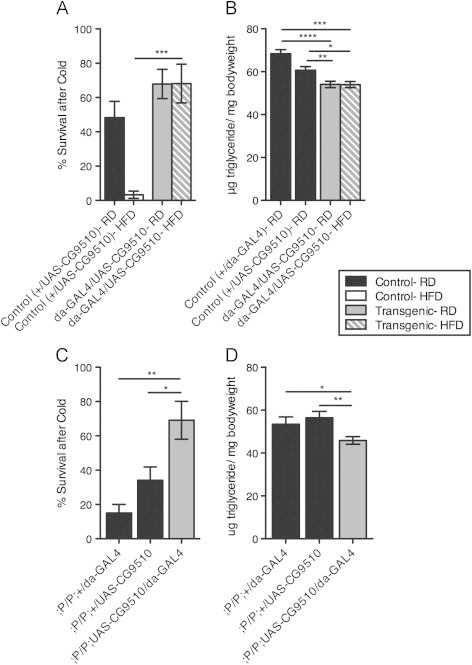
Up-regulation of CG9510 increases cold tolerance, decreases stored triglyceride levels. (A) Survival following cold stress was counted for flies with up-regulated CG9510 (;da-GAL4/UAS-CG9510) and control flies (w1118;+/UAS-CG9510) after one week on RD or HFD. (B) Triglyceride (TG) levels (per mg of bodyweight) were determined in whole-body homogenate of flies with up-regulated CG9510 expression compared to control. Adult female flies (d3-5) from the GAL4-control cross (w1118;+/da-GAL4) or UAS-control cross (w1118;+/UAS-CG9510) were placed on RD and progeny from the experimental cross (;UAS-CG9510/da-GAL4) were placed either RD or HFD for one week prior to the assay. (C and D) Transgenic flies with rescued CG9510 expression (;P/P;UAS-CG9510/da-GAL4, where “P”=CG9510-PBac) and their controls (;P/P;+/UAS-CG9510 and;P/P;+/da-GAL4) were assayed for cold tolerance (C) and TG levels in whole-body homogenate (D) after one week on RD. Flies were tested in sets of 10 females per vial for cold tolerance, 5 females for TG levels: (A) n=6 sets (60 flies per group), (B) n=15–20 sets (75–100 flies per group), (C) n=4 sets (40 flies per group), (D) n=9–16 sets (45–80 flies per group). Error bars indicate standard error. Significance between values for the experimental group and control was determined with a t-test, *=p<0.05 **=p<0.01 ***=p<0.01 ****=p<0.0001.
CG9510 is unusual in that it is dicistronically transcribed with another gene, CG9515. To confirm that CG9510 expression is sufficient to rescue the observed phenotypes of flies on HFD, we rescued similar phenotypes observed in a mutant in which a transposon disrupted the CG9510/CG9515 transcriptional unit. This mutant, which we refer to as CG9510-PBac, showed increased survival after cold stress when CG9510 expression was elevated under UAS/da-GAL4 control (Figure 5C). da-GAL4 driven expression of CG9510 also reduced mutant TG levels to those of controls (Figure 5D). These data demonstrate that CG9510 is necessary and sufficient for normal sensitivity to cold stress and TG levels, which are perturbed during HFD.
3.4. Lifespan and heart function analysis in CG9510 transgenic flies
Having previously seen a shortened lifespan in flies on HFD compared to RD [21], we examined whether ubiquitous down-regulation of CG9510 would also decrease lifespan compared to control flies on RD. Indeed, CG9510 knockdown flies on RD, as well as control flies on HFD, exhibited a shortened lifespan, indicating that reduced CG9510 expression possibly affects lifespan in a similar fashion as HFD, although not as severely (Figure 6A). It is important to note that each different transgenic line is tested against controls specific to its genetic background, so while there is some variation between controls in different experiments, within each experiment the control is genetically specific to the transgenic line.
Figure 6.
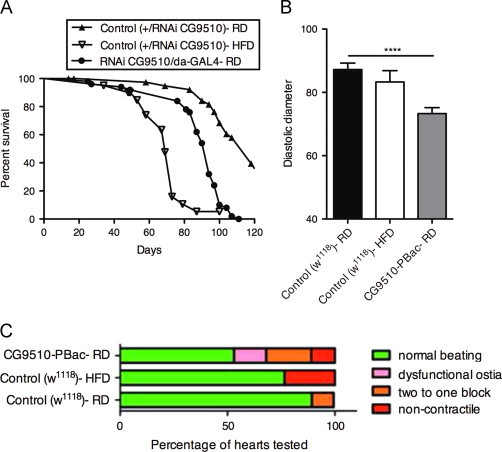
Altered lifespan and heart function with ubiquitous down-regulation of CG9510. (A) Lifespan measurement of flies with down-regulated CG9510 compared to controls. Adult female progeny (d3-5) with down-regulated CG9510, from the cross between UAS-RNAi line (CG9510 #1) and daughterless (da)–GAL4 (;UAS-RNAi CG9510/da-GAL4), were placed on RD. Control flies were adult female progeny (d3-5) of the cross between UAS-RNAi line (CG9510 #1) and w1118 (;+/UAS-RNAi CG9510), and were placed on either RD or HFD. Flies with down-regulation of CG9510 on RD had a significantly shorter lifespan than control flies on RD (p<0.0001), and longer lifespan than control flies on HFD (p<0.0001) (n=40 per group). Significance was determined by comparing the survival curves with a log-rank (Mantel–Cox) test. (B) Diastolic heart diameter measurements when CG9510 is down-regulated. Bar graph representation of changes in diastolic diameter of wildtype w1118 (Control (w1118)-RD, n=33; Control (w1118)-HFD, n=17) and homozygous CG9510-PBac (CG9510-PBac-RD, n=30) hearts. Note significant decrease in diastolic diameter of CG9510-PBac-RD hearts, compared to Control-RD. Error bars indicate standard error. Significance between experimental group and control was determined with a t-test, ****=p<0.0001. (C) Heart dysfunction analysis. Graph represents the percentage of hearts (n=same as Figure 6B) displaying non-contractile regions, asynchronous beating pattern and dysfunctional ostia (inflow tracks). Note increased heart defects in Control-HFD and CG9510-PBac-RD compared to Control-RD. Statistical analysis was chi (χ) square test. Control-RD compared to CG9510-PBac-RD flies: χ2=18.84, p<0.001. Control-RD compared to Control-HFD: χ2=1.42, p=0.1. Control-HFD compared to CG9510-PBac-RD: χ2=2.45, p=0.1.
HFD has been previously shown to lead to heart dysfunction in flies [18]. Therefore, we asked whether down-regulation of CG9510 associated with HFD could cause this phenotype. After one week of HFD using a 20% coconut oil-supplemented diet, we found that control animals had slightly constricted heart tubes, although not statistically significant (Figure 6B). This phenotype is qualitatively similar to what was observed by Birse et al. (2010), though our data show less of an effect of HFD, probably because we used 30% less coconut oil. However, homozygous CG9510-PBac flies on RD also showed a more dramatically decreased diastolic diameter (Figure 6B). Previously, it was shown that 30% HFD disrupts heart function in other ways as well, including causing non-contractile heart regions, dysfunctional ostia, and asynchronous beating pattern between anterior and posterior regions [18,47,48]. The 20% HFD regime used here also produces some of these heart phenotypes, but to a lesser extent (Figure 6C). Interestingly, with regard to the diastolic diameter phenotype, CG9510-PBac homozygotes again showed similar but more pronounced heart defects than flies on 20% HFD, consistent with more extreme cardiac dysfunction observed at 30% HFD [18]. These findings demonstrate that reduced function of CG9510 causes systemic TG accumulation and associated heart dysfunction like control flies on a HFD, thus implicating the CG9510 gene in metabolic homeostasis and heart function.
3.5. Role of CG9510 in Drosophila metabolism
While relatively uncharacterized in Drosophila, CG9510 has sequence homology with the human gene argininosuccinate lyase, or ASL, which is involved in amino acid metabolism as part of the urea cycle. ASL lies at the junction of the urea and aspartate-argininosuccinate shunt of the tricarboxylic acid (TCA) cycle, catalyzing the breakdown of argininosuccinate into arginine and fumarate. To verify the importance of this pathway in the HFD phenotype, we evaluated flies in which CG1315 expression was knocked down. This gene is homologous to human argininosuccinate synthase, which lies immediately upstream of ASL in the arginine biosynthesis pathway, and is responsible for catalyzing the synthesis of argininosuccinate from citrulline and aspartate (Figure 7A). When CG1315 expression was ubiquitously knocked down, the flies had significantly decreased cold tolerance and increased TG levels compared to controls (Figure 7B and C). These results provide independent evidence that modulation of this pathway through a separate enzyme generates a similar phenotypic response/adaptation to HFD.
Figure 7.
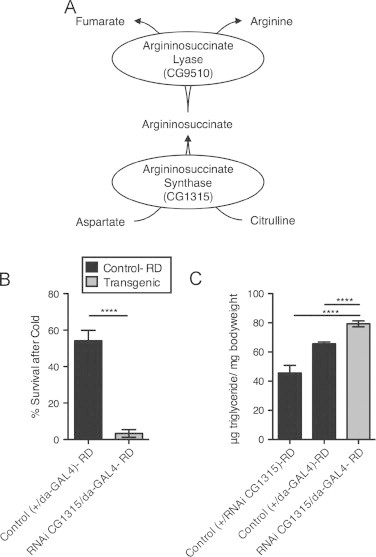
Down-regulating CG1315 simulates HFD phenotype. Evaluating the phenotype of CG1315, gene immediately upstream of CG9510 in argininosuccinate metabolism as shown in (A). Adult female progeny (d3-5) from a CG1315 UAS-RNAi×daughterless (da)-GAL4 cross (;UAS-RNAi CG1315/da-GAL4) and control progeny from a w1118×da-GAL4 cross (w1118;+/da-GAL4) were put on RD for 1 week prior to the assay. (B) Percent survival after cold stress (2 h at −5°, with 24 h recovery in room air) and (C) triglyceride levels (per mg of bodyweight) from whole-body homogenate of control flies and flies with CG1315 down-regulated ubiquitously. Flies were tested in sets of 10 females per vial for cold tolerance, 5 females for TG levels: (B) n=6–8 sets (60–80 flies per group), (C) n=12–15 sets (60–75 flies per group). Error bars indicate standard error. Significance between values for the experimental group and control was determined with a t-test, ****=p<0.0001.
In mammals, ASL functions at a key intersection between carbon and nitrogen metabolism. We used mass spectrometry to characterize the role of CG9510 in Drosophila metabolism. Reducing CG9510 expression led to an overall increase in fatty acid abundance even though the flies ate an RD (Figure 8A), with no change in the glycolytic metabolites pyruvate and lactate (Figure 8B). These results support our findings that CG9510 is required for normal low TG levels (Figure 3) but not for glucose levels (Figure S5). In addition, flies with reduced CG9510 showed a drastic decrease in the whole-body relative abundance of urea, alpha-ketoglutarate and citrate, as well as increased aspartate (Figure 8B and C), but an unchanged pool of remaining free amino acids (Figure 8C). Importantly, uric acid levels were significantly increased, consistent with the observed deficiency in urea production and need for an alternate route for nitrogen disposal (Figure 8B). Given the observed alterations in nitrogen metabolism and citric acid cycle intermediates, these data confirm that CG9510 has a similar role to human ASL in balancing carbon and nitrogen metabolism.
Figure 8.
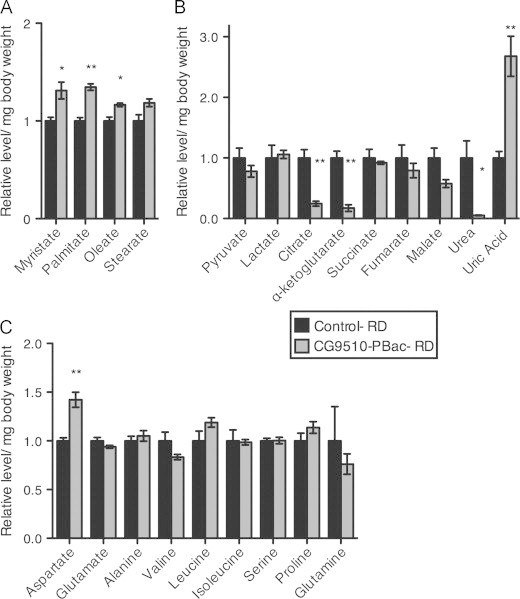
Increased fatty acid accumulation and altered urea and TCA metabolite abundance with down-regulation of CG9510. Adult female flies (d3-5) from a P-element line down-regulating CG9510 (CG9510-PBac) and female w1118 flies (control) were put on RD for one week prior to metabolite extraction with whole-body homogenate and GC/MS analysis. Shown is the relative abundance of (A) fatty acids, (B) organic acids and (C) amino acids in CG9510-PBac and control flies on RD, normalized to body weight and divided by the average metabolite abundance in the control flies. For metabolites with multiple fragments available, consistent changes were observed in each and one fragment was selected to represent the metabolite. Three sets of five female flies were analyzed for each diet condition. Error bars indicate standard error. Significance between relative abundance values of the CG9510-PBac and control group was determined with a t-test, *=p<0.05 **=p<0.01.
In summary, we found that the effects of a HFD on Drosophila extend beyond lipid metabolism, perturbing the balance of amino acid and carbohydrate metabolism. In metabolomic studies, flies on a HFD have increased fatty acid, glycolytic metabolites and urea abundance, and decreased free amino acid levels. Our microarray analysis allowed us to identify a critical gene, CG9510, associated with amino acid metabolism that is involved in response to HFD. Reducing CG9510 led to increased TG levels, decreased cold tolerance, and heart dysfunction, even when animals were on an RD diet. Further characterization of CG9510 revealed that it is required for carbon and nitrogen metabolism, similar to its human homolog ASL. These results demonstrate that flies on a HFD have an imbalance in amino acid and carbohydrate metabolism, and HFD causes transcriptional changes at the junction of these two metabolic pathways that are mediated at least in part by CG9510.
4. Discussion
In this work, we have identified a strong association between amino acid metabolism and HFD by uncovering key metabolic and transcriptional changes in flies consuming a HFD. Flies on a HFD exhibited significant alterations in the abundance of compounds involved in fatty acid, carbohydrate and amino acid metabolism. Expression of genes involved in several metabolic pathways was affected, including amino acid metabolism and glycan degradation. Knockdown of one of the genes with reduced transcription in flies on HFD, CG9510, phenocopied the effects of HFD, indicating that this gene is a key regulator of HFD. These effects included changes in triglyceride (TG) levels and cold tolerance. CG9510 is a homolog to the human argininosuccinate lyase (ASL) and, like ASL, affects both carbon and nitrogen metabolism. Our observations lead us to ask two key questions: (1) What are the metabolic events that occur during HFD that cause such dramatic changes in amino acid and carbohydrate metabolite abundance; and (2) What effect does the reduction in CG9510 expression have during HFD?
4.1. Metabolic imbalance in flies on HFD
The link between an imbalance in metabolism and HFD has been demonstrated in literature. HFD is known to influence glucose metabolism, including increased levels of lactate in obese human subjects [10,49], and increased pyruvate and lactate in mice on a HFD [50]. Mice on a HFD show elevated TCA cycle flux [51], as do cows with high liver fat content [52]. Recent studies have consistently revealed alteration of amino acid metabolism in obese, insulin resistant states and type 2 diabetes [9]. Additionally, a HFD has been shown to diminish skeletal muscle growth in mice [53], similar to decreased protein levels seen in flies on HFD in our studies (Figure S6). Our work expands on this by demonstrating for the first time a link between HFD and metabolic imbalance in a Drosophila model. Further analysis allowed us to link an amino acid metabolic regulator to this imbalance due to HFD.
Our targeted metabolomic analysis of flies fed a control diet or a HFD identified changes in compounds involved in carbohydrate, fatty acid, and amino acid metabolism (indicated by green arrows in Figure 9). The increased pyruvate and lactate observed in flies consuming a HFD provide evidence that fatty acid oxidation may occur at the expense of pyruvate metabolism by the pyruvate dehydrogenase complex in mitochondria. Both processes serve as important sources of acetyl-coenzyme A (AcCoA) to fuel the TCA cycle, and the increased availability of triglycerides and fatty acids could displace the use of pyruvate as a substrate for oxidative mitochondrial metabolism. In turn, pyruvate accumulates and is subsequently diverted to generate large amounts of lactate (Figure 9, green arrows). Meanwhile, we observed significant decreases in the abundance of nearly all amino acids detected in our analysis. Along with the increases in urea and uric acid, these data suggest that HFD induces a tangible change in nitrogen/amino acid metabolism. Such an effect can be explained by the increased need for anaplerotic substrates in the TCA cycle (indicated by purple arrows in Figure 9).
Figure 9.
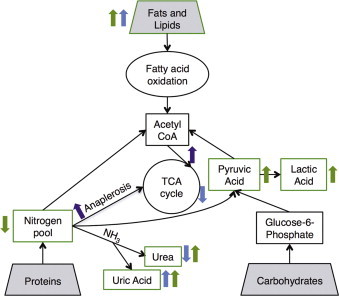
Model of Drosophila response to HFD. Green arrows indicate changes in metabolite abundance in flies on a HFD, purple arrows are hypothesized effects on a HFD, and blue arrows show metabolic effect of down-regulating a gene altered by HFD, CG9510. Flies show increased fatty acids, as well as a significant increase in pyruvate and lactate, decreased free amino acids, and increased urea levels on a HFD. This indicates that an increased abundance of acetyl co-a is entering the TCA cycle, increasing the need for anaplerosis in order to replenish TCA intermediates. By down-regulating expression of CG9510, flies still have increased fatty acids, but are also decreasing TCA intermediates and urea levels.
In order for AcCoA to enter the TCA cycle, oxaloacetate is required to act as a co-substrate for citrate synthesis. Unlike glucose and amino acids, lipids cannot enter the TCA cycle via anaplerotic pathways and generate AcCoA via β-oxidation. In the context of HFD, glucose may be primarily metabolized to lactate. Therefore, increased amino acid catabolism can serve as a more significant source of anaplerotic substrates to sustain TCA cycling when HFD is provided. In turn, amino acids that are catabolized in the TCA cycle become more depleted under these conditions. Importantly, the observed increase in oxygen consumption indicates that oxidative phosphorylation and flux through the TCA cycle are maintained or elevated on a HFD, despite the fact that glycolytic metabolism increases. This provides independent support for the notion that amino acid oxidation is increased in flies on a HFD to sustain anaplerosis in mitochondria.
Metabolomic profiling in human subjects has also showed a change in amino acid metabolism, specifically branch chain amino acid (BCAA) catabolism, in obese compared to lean subjects [10]. While we observed a decrease in BCAA abundance in the Drosophila model, human studies have shown an overall increase in plasma BCAA levels. This may be due to the fact that human subjects are eating a typical American diet with high levels of both fat and protein. Dietary protein has >20% BCAA, and given that dietary BCAAs reach the blood at nearly the same levels as in the diet [54], this would lead to a large increase in circulating BCAA levels. In our study, on the other hand, Drosophila consumes a HFD with an increase only in saturated fat levels. Furthermore, as amino acids are broken down, nitrogen is released which must be converted to urea or uric acid. Indeed, we observed significantly elevated levels of both in flies on HFD.
4.2. Transcriptional regulation of CG9510 in response to HFD
The impact of HFD on metabolic pathways was also seen at a transcriptional level with altered pathways important in transport, metabolism of amino acids and breakdown of sugars and waste products. HFD decreased expression of CG9510 (Supplementary Dataset), and with independent manipulation of the expression of this particular gene, TG levels and cold tolerance were both impacted in these flies (Figures. 3 and 4). One caveat to note is that in the transgenic flies, expression of CG9510 was altered throughout development, while HFD only affected flies in adulthood. While it would be interesting to evaluate adult-specific expression of CG9510, using an inducible system would bring with it additional confounding factors.
CG9510 has sequence homology to human ASL, an enzyme at the intersection between carbon and nitrogen metabolism, catalyzing the breakdown of argininosuccinate into arginine and fumarate. Interestingly, mammals on HFD or with high liver fat also present decreased levels of urea cycle enzymes [52], including decreased ASL [50].
Metabolomic analysis confirmed the function of CG9510 in flies as similar to ASL. As would be expected given the complexity of an entire organism responding to dietary change, not all changes seen in the HFD were manifested in the CG9510 transgenic flies. Transgenic flies with decreased expression of CG9510 had increased fatty acid abundance, similar to those on HFD, even though the transgenic flies were on RD. It is possible that the transgenic CG9510 flies are unable to oxidize fatty acids as efficiently, which also would explain the increased TG levels seen in these flies. The fact that the relative abundance of aspartate is elevated, while urea and citrate are decreased, establishes that CG9510, similar to ASL, plays a role in maintaining the balance of carbon and nitrogen metabolism. In support of this role, the transgenic flies had increased uric acid levels, as the dramatic decrease in urea production would have required them to rely instead on the uric acid pathway for disposing of nitrogen. This demonstrates that by modulating CG9510 during HFD, flies attempt to compensate for specific components of the metabolic imbalance caused by the diet (indicated by blue arrows in Figure 9). In doing so, however, the end result may be detrimental to the overall phenotype given the increased TG and decreased stress tolerance and lifespan that accompany down-regulation of CG9510 in transgenic flies. Although more detailed studies are required to display changes in pathway fluxes proposed in our model, our metabolomic, transcriptional, and phenotypic results provide a compelling link between HFD and an imbalance in carbohydrate, lipid, and amino acid metabolism.
4.3. Conclusion
HFD dramatically alters the balance of metabolism in Drosophila. With an increased availability of fatty acids from the diet, flies seem to shift away from pyruvate as a source for AcCoA, allowing pyruvate to be converted into lactate. We see a decrease in amino acid abundance in HFD flies and an increase in urea levels, likely due to an increased demand for TCA cycle intermediates through anaplerosis in order for the increased supply of AcCoA to enter the cycle. The influence of HFD on nitrogen metabolism is seen through transcriptional changes as well, with several metabolic pathways altered in microarray analysis. During HFD, flies alter expression of the homolog for human ASL, CG9510, potentially to compensate for the imbalance in nitrogen metabolism. The importance of regulating this gene is also seen in respect to TG storage, stress tolerance, heart function and lifespan, as down-regulating CG9510 in transgenic flies phenocopies the effect of HFD, while overexpression of the gene ameliorates some of the negative consequences of HFD. The role of this gene at the junction of carbon and nitrogen metabolism identifies a mechanism by which HFD impacts the regulation of metabolic balance.
Conflict of interest
The authors declare that there are no conflicts of interest.
Acknowledgments
We are grateful to Dr. Priti Azad, Dr. Dan Zhou, and Dr. Jin Xue for their assistance in analyzing microarray results, and to Orit Poulsen, Ying Lu-Bo, Mary Hsiao, and other members of the Haddad laboratory for guidance in experimental protocols. We wish to thank the Bloomington stock center and VDRC for Drosophila stocks.
Footnotes
This is an open-access article distributed under the terms of the Creative Commons Attribution-NonCommercial-ShareAlike License, which permits non-commercial use, distribution, and reproduction in any medium, provided the original author and source are credited.
Contributor Information
Christian M. Metallo, Email: cmetallo@ucsd.edu.
Gabriel G. Haddad, Email: ghaddad@ucsd.edu.
Appendix A. Supporting information
Supplementary data associated with this article can be found in the online version at 10.1016/j.molmet.2013.10.003.
Appendix A. Supplementary materials
Supplementary data
Supplementary data
References
- 1.Hedley A.A., Ogden C.L., Johnson C.L., Carroll M.D., Curtin L.R., Flegal K.M. Prevalence of overweight and obesity among US children, adolescents, and adults, 1999–2002. JAMA. 2004;291:2847–2850. doi: 10.1001/jama.291.23.2847. [DOI] [PubMed] [Google Scholar]
- 2.Ogden C.L., Carroll M.D., Kit B.K., Flegal K.M. Prevalence of obesity and trends in body mass index among US children and adolescents, 1999–2010. JAMA. 2012;307:483–490. doi: 10.1001/jama.2012.40. [DOI] [PMC free article] [PubMed] [Google Scholar]
- 3.O'Brien P.E., Dixon J.B. The extent of the problem of obesity. American Journal of Surgery. 2002;184:S4–S8. doi: 10.1016/s0002-9610(02)01172-8. [DOI] [PubMed] [Google Scholar]
- 4.Dietz W.H. Health consequences of obesity in youth: childhood predictors of adult disease. Pediatrics. 1998;101:518–525. [PubMed] [Google Scholar]
- 5.Expert Panel Clinical guidelines on the identification, evaluation, and treatment of overweight and obesity in adults: executive summary. American Journal of Clinical Nutrition. 1998;68:899–917. doi: 10.1093/ajcn/68.4.899. [DOI] [PubMed] [Google Scholar]
- 6.Ogden C.L., Yanovski S.Z., Carroll M.D., Flegal K.M. The epidemiology of obesity. Gastroenterology. 2007;132:2087–2102. doi: 10.1053/j.gastro.2007.03.052. [DOI] [PubMed] [Google Scholar]
- 7.Fontaine K.R., Redden D.T., Wang C., Westfall A.O., Allison D.B. Years of life lost due to obesity. JAMA. 2003;289:187–193. doi: 10.1001/jama.289.2.187. [DOI] [PubMed] [Google Scholar]
- 8.Marshall S. Role of insulin, adipocyte hormones, and nutrient-sensing pathways in regulating fuel metabolism and energy homeostasis: a nutritional perspective of diabetes, obesity, and cancer. Science's STKE. 2006;2006 doi: 10.1126/stke.3462006re7. (re7–re7) [DOI] [PubMed] [Google Scholar]
- 9.Adams S.H. Emerging perspectives on essential amino acid metabolism in obesity and the insulin-resistant state. Advances in Nutrition: An International Review Journal. 2011;2:445–456. doi: 10.3945/an.111.000737. [DOI] [PMC free article] [PubMed] [Google Scholar]
- 10.Newgard C.B., An J., Bain J.R., Muehlbauer M.J., Stevens R.D., Lien L.F. A branched-chain amino acid-related metabolic signature that differentiates obese and lean humans and contributes to insulin resistance. Cell Metabolism. 2009;9:311–326. doi: 10.1016/j.cmet.2009.02.002. [DOI] [PMC free article] [PubMed] [Google Scholar]
- 11.Perez C.L., Van Gilst M.R. A ^1^3C isotope labeling strategy reveals the influence of insulin signaling on lipogenesis in C. elegans. Cell Metabolism. 2008;8 doi: 10.1016/j.cmet.2008.08.007. (9–9) [DOI] [PubMed] [Google Scholar]
- 12.Baker K.D., Thummel C.S. Diabetic larvae and obese flies-emerging studies of metabolism in Drosophila. Cell Metabolism. 2007;6:257–266. doi: 10.1016/j.cmet.2007.09.002. [DOI] [PMC free article] [PubMed] [Google Scholar]
- 13.Leopold P.P., Perrimon N.N. Drosophila and the genetics of the internal milieu. Nature. 2007;450:186–188. doi: 10.1038/nature06286. [DOI] [PubMed] [Google Scholar]
- 14.Oldham S., Hafen E. Insulin/IGF and target of rapamycin signaling: a TOR de force in growth control. Trends in Cell Biology. 2003;13:79–85. doi: 10.1016/s0962-8924(02)00042-9. [DOI] [PubMed] [Google Scholar]
- 15.Honegger B., Galic M., Köhler K., Wittwer F., Brogiolo W., Hafen E. Imp-L2, a putative homolog of vertebrate IGF-binding protein 7, counteracts insulin signaling in Drosophila and is essential for starvation resistance. Journal of Biology. 2008;7:10. doi: 10.1186/jbiol72. [DOI] [PMC free article] [PubMed] [Google Scholar]
- 16.Teleman A.A. Molecular mechanisms of metabolic regulation by insulin in Drosophila. Biochemical Journal. 2010;425:13–26. doi: 10.1042/BJ20091181. [DOI] [PubMed] [Google Scholar]
- 17.Tatar M., Bartke A., Antebi A. The endocrine regulation of aging by insulin-like signals. Science. 2003;299:1346–1351. doi: 10.1126/science.1081447. [DOI] [PubMed] [Google Scholar]
- 18.Birse R.T., Choi J., Reardon K., Rodriguez J., Graham S., Diop S. High-fat-diet-induced obesity and heart dysfunction are regulated by the TOR pathway in Drosophila. Cell Metabolism. 2010;12:533–544. doi: 10.1016/j.cmet.2010.09.014. [DOI] [PMC free article] [PubMed] [Google Scholar]
- 19.Bharucha K.N. The epicurean fly: using Drosophila melanogaster to study metabolism. Pediatric Research. 2009;65:132–137. doi: 10.1203/PDR.0b013e318191fc68. [DOI] [PubMed] [Google Scholar]
- 20.Colombani J., Raisin S., Pantalacci S., Radimerski T., Montagne J., Léopold P. A nutrient sensor mechanism controls Drosophila growth. Cell. 2003;114:739–749. doi: 10.1016/s0092-8674(03)00713-x. [DOI] [PubMed] [Google Scholar]
- 21.Heinrichsen E.T., Haddad G.G. Role of high-fat diet in stress response of Drosophila. PLoS ONE. 2012;7 doi: 10.1371/journal.pone.0042587. (e42587–e42587) [DOI] [PMC free article] [PubMed] [Google Scholar]
- 22.Van Gaal L.F., Mertens I.L., De Block C.E. Mechanisms linking obesity with cardiovascular disease. Nature. 2006;444:875–880. doi: 10.1038/nature05487. [DOI] [PubMed] [Google Scholar]
- 23.Boden G., Salehi S. Why does obesity increase the risk for cardiovascular disease? Current Pharmaceutical Design. 2013 doi: 10.2174/1381612811319320003. [DOI] [PubMed] [Google Scholar]
- 24.Canavoso L.E., Jouni Z.E., Karnas K.J., Pennington J.E., Wells M.A. Fat metabolism in insects. Annual Review of Nutrition. 2001;21:23–46. doi: 10.1146/annurev.nutr.21.1.23. [DOI] [PubMed] [Google Scholar]
- 25.Wang S., Tulina N., Carlin D.L., Rulifson E.J. The origin of islet-like cells in Drosophila identifies parallels to the vertebrate endocrine axis. Proceedings of the National Academy of Sciences of the United States of America. 2007;104:19873–19878. doi: 10.1073/pnas.0707465104. [DOI] [PMC free article] [PubMed] [Google Scholar]
- 26.DiAngelo J.R., Birnbaum M.J. Regulation of fat cell mass by insulin in Drosophila melanogaster. Molecular and Cellular Biology. 2009;29:6341–6352. doi: 10.1128/MCB.00675-09. [DOI] [PMC free article] [PubMed] [Google Scholar]
- 27.Wolf M.J., Rockman H.A. Drosophila melanogaster as a model system for the genetics of postnatal cardiac function. Drug Discovery Today: Disease Models. 2008;5:117–123. doi: 10.1016/j.ddmod.2009.02.002. [DOI] [PMC free article] [PubMed] [Google Scholar]
- 28.Pandey U.B., Nichols C.D. Human disease models in Drosophila melanogaster and the role of the fly in therapeutic drug discovery. Pharmacological Reviews. 2011;63:411–436. doi: 10.1124/pr.110.003293. [DOI] [PMC free article] [PubMed] [Google Scholar]
- 29.Dietzl G., Chen D., Schnorrer F., Su K.-C., Barinova Y., Fellner M. A genome-wide transgenic RNAi library for conditional gene inactivation in Drosophila. Nature. 2007;448:151–156. doi: 10.1038/nature05954. [DOI] [PubMed] [Google Scholar]
- 30.Rondeau R.E., Baths Slush. Journal of Chemical and Engineering Data. 1966 [Google Scholar]
- 31.Grassian A.R., Metallo C.M., Coloff J.L., Stephanopoulos G., Brugge J.S. Erk regulation of pyruvate dehydrogenase flux through PDK4 modulates cell proliferation. Genes & Development. 2011;25:1716–1733. doi: 10.1101/gad.16771811. [DOI] [PMC free article] [PubMed] [Google Scholar]
- 32.Metallo C.M., Walther J.L., Stephanopoulos G. Evaluation of ^1^3C isotopic tracers for metabolic flux analysis in mammalian cells. Journal of Biotechnology. 2009;144:8. doi: 10.1016/j.jbiotec.2009.07.010. [DOI] [PMC free article] [PubMed] [Google Scholar]
- 33.Antoniewicz M.R., Kelleher J.K., Stephanopoulos G.G. Accurate assessment of amino acid mass isotopomer distributions for metabolic flux analysis. Analytical Chemistry. 2007;79:7554–7559. doi: 10.1021/ac0708893. [DOI] [PubMed] [Google Scholar]
- 34.Krishnan S., Sun Y., Mohsenin A., Wyman R., Haddad G. Behavioral and electrophysiologic responses of Drosophila melanogaster to prolonged periods of anoxia. Journal of Insect Physiology. 1997;43:203–210. doi: 10.1016/s0022-1910(96)00084-4. [DOI] [PubMed] [Google Scholar]
- 35.Hsiao A., Ideker T., Olefsky J.M., Subramaniam S. VAMPIRE microarray suite: a web-based platform for the interpretation of gene expression data. Nucleic Acids Research. 2005;33:W627–W632. doi: 10.1093/nar/gki443. [DOI] [PMC free article] [PubMed] [Google Scholar]
- 36.Huang D.W., Sherman B.T., Lempicki R.A. Bioinformatics enrichment tools: paths toward the comprehensive functional analysis of large gene lists. Nucleic Acids Research. 2009;37:1–13. doi: 10.1093/nar/gkn923. [DOI] [PMC free article] [PubMed] [Google Scholar]
- 37.Da Wei Huang B.T., Sherman R.A. Lempicki, Systematic and integrative analysis of large gene lists using DAVID bioinformatics resources. Nature Protocols. 2009;4:44–57. doi: 10.1038/nprot.2008.211. [DOI] [PubMed] [Google Scholar]
- 38.Rozen S., Skaletsky H. Primer3 on the WWW for general users and for biologist programmers. Methods in Molecular Biology. 2000;132:365–386. doi: 10.1385/1-59259-192-2:365. [DOI] [PubMed] [Google Scholar]
- 39.Grönke S., Beller M., Fellert S., Ramakrishnan H., Jäckle H., Kühnlein R.P. Control of fat storage by a Drosophila PAT domain protein. Current Biology. 2003;13:603–606. doi: 10.1016/s0960-9822(03)00175-1. [DOI] [PubMed] [Google Scholar]
- 40.Ja W.W., Carvalho G.B., Mak E.M., de la Rosa N.N., Fang A.Y., Liong J.C. Prandiology of Drosophila and the CAFE assay. Proceedings of the National Academy of Sciences of the United States of America. 2007;104:8253–8256. doi: 10.1073/pnas.0702726104. [DOI] [PMC free article] [PubMed] [Google Scholar]
- 41.Ocorr K., Reeves N.L., Wessells R.J., Fink M., Chen H.-S.V., Akasaka T. KCNQ potassium channel mutations cause cardiac arrhythmias in Drosophila that mimic the effects of aging. Proceedings of the National Academy of Sciences of the United States of America. 2007;104:3943–3948. doi: 10.1073/pnas.0609278104. [DOI] [PMC free article] [PubMed] [Google Scholar]
- 42.Vogler G., Ocorr K. Visualizing the beating heart in Drosophila. Journal of Visualized Experiments. 2009;31:1425. doi: 10.3791/1425. [DOI] [PMC free article] [PubMed] [Google Scholar]
- 43.Fink M., Callol-Massot C., Chu A., Ruiz-Lozano P., Belmonte J.C.I., Giles W. A new method for detection and quantification of heartbeat parameters in Drosophila, zebrafish, and embryonic mouse hearts. Biotechniques. 2009;46:101–113. doi: 10.2144/000113078. [DOI] [PMC free article] [PubMed] [Google Scholar]
- 44.Araujo R.L., Andrade B.M., Padrón A.S., Gaidhu M.P., Perry R.L.S., Carvalho D.P. High-fat diet increases thyrotropin and oxygen consumption without altering circulating 3,5,3′-triiodothyronine (T3) and thyroxine in rats: the role of iodothyronine deiodinases, reverse T3 production, and whole-body fat oxidation. Endocrinology. 2010;151:3460–3469. doi: 10.1210/en.2010-0026. [DOI] [PubMed] [Google Scholar]
- 45.Fanelli M.T., Kaplan M.L. Effects of high fat and high carbohydrate diets on the body composition and oxygen consumption of ob/ob mice. Journal of Nutrition. 1978;108:1491–1500. doi: 10.1093/jn/108.9.1491. [DOI] [PubMed] [Google Scholar]
- 46.So M., Gaidhu M.P., Maghdoori B., Ceddia R.B. Analysis of time-dependent adaptations in whole-body energy balance in obesity induced by high-fat diet in rats. Lipids in Health and Disease. 2011;10:99. doi: 10.1186/1476-511X-10-99. [DOI] [PMC free article] [PubMed] [Google Scholar]
- 47.Birse R.T., Bodmer R. Lipotoxicity and cardiac dysfunction in mammals and Drosophila. Critical Reviews in Biochemistry and Molecular Biology. 2011;46:376–385. doi: 10.3109/10409238.2011.599830. [DOI] [PMC free article] [PubMed] [Google Scholar]
- 48.Diop S.B., Bodmer R. Drosophila as a model to study the genetic mechanisms of obesity-associated heart dysfunction. Journal of Cellular and Molecular Medicine. 2012;16:966–971. doi: 10.1111/j.1582-4934.2012.01522.x. [DOI] [PMC free article] [PubMed] [Google Scholar]
- 49.Lovejoy J., Newby F.D., Gebhart S.S., DiGirolamo M. Insulin resistance in obesity is associated with elevated basal lactate levels and diminished lactate appearance following intravenous glucose and insulin. Metabolism. 1992;41:22–27. doi: 10.1016/0026-0495(92)90185-d. [DOI] [PubMed] [Google Scholar]
- 50.Toye A.A., Dumas M.E., Blancher C., Rothwell A.R., Fearnside J.F., Wilder S.P. Subtle metabolic and liver gene transcriptional changes underlie diet-induced fatty liver susceptibility in insulin-resistant mice. Diabetologia. 2007;50:1867–1879. doi: 10.1007/s00125-007-0738-5. [DOI] [PubMed] [Google Scholar]
- 51.Satapati S., Sunny N.E., Kucejova B., Fu X., He T.T., Méndez-Lucas A.A. Elevated TCA cycle function in the pathology of diet-induced hepatic insulin resistance and fatty liver. Journal of Lipid Research. 2012;53:1080–1092. doi: 10.1194/jlr.M023382. [DOI] [PMC free article] [PubMed] [Google Scholar]
- 52.Schäff C., Börner S., Hacke S., Kautzsch U., Albrecht D., Hammon H.M. Increased anaplerosis, TCA cycling, and oxidative phosphorylation in the liver of dairy cows with intensive body fat mobilization during early lactation. Journal of Proteome Research. 2012;11:5503–5514. doi: 10.1021/pr300732n. [DOI] [PubMed] [Google Scholar]
- 53.Sitnick M., Bodine S.C., Rutledge J.C. Chronic high fat feeding attenuates load-induced hypertrophy in mice. The Journal of Physiology. 2009;587:5753–5765. doi: 10.1113/jphysiol.2009.180174. [DOI] [PMC free article] [PubMed] [Google Scholar]
- 54.Layman D.K., Walker D.A. Potential importance of leucine in treatment of obesity and the metabolic syndrome. Journal of Nutrition. 2006;136:319S–323S. doi: 10.1093/jn/136.1.319S. [DOI] [PubMed] [Google Scholar]
Associated Data
This section collects any data citations, data availability statements, or supplementary materials included in this article.
Supplementary Materials
Supplementary data
Supplementary data