Abstract
Dermal pericapillary fibrin is a hallmark of venous disease and is thought to play a pathogenic role in the development of ulceration. However, the actual spatial configuration of pericapillary fibrin is unknown, and it remains unclear whether it truly represents a barrier that can impair physiological exchanges between the blood and dermis. Using confocal microscopy on tissue specimens taken from the edges of venous ulcers in six patients, we report a detailed analysis of dermal pericapillary fibrin deposits. Sections were evaluated with an antibody to human fibrinogen/fibrin and viewed, vertically and horizontally, with confocal microscopy. The distribution of fibrin deposition was highly variable and patchy, with areas of great intensity next to others of marginal intensity. Vertical cut sections showed the highest concentration of fluorescent material next to the lumen of dermal capillaries. Horizontal sections showed that maximal fluorescence was distributed at random. Our findings indicate that fibrin deposits in venous ulcers are patchy and discontinuous around dermal vessels. As such, these deposits are unlikely to act as a true and stable anatomic barrier as originally proposed. However, pericapillary fibrin may still act as a physiological barrier under conditions of poor blood flow where even marginal or patchy fibrin deposition might have a greater effect on the exchange of oxygen and other nutrients between blood and dermis.
Keywords: fibrin, venous ulcer, confocal microscopy, fibrin cuff, immunofluorescence
INTRODUCTION
Dermal pericapillary fibrin deposition has been shown to be commonly present in lipodermatosclerotic non-ulcerated skin, at the edges of venous ulcers, and within the ulcer bed (1; 2). The importance of dermal pericapillary fibrin cuffs in the pathogenesis of venous ulcers is still the basis of different hypotheses. The original hypothesis suggested that pericapillary fibrin is the result of venous hypertension, rather than a primary cause of tissue ischemia (3; 4; 5).
However, a major issue has been whether fibrin cuffs represent a true and distinct anatomic barrier to the diffusion of oxygen and other nutrients from the circulation to the tissue. In this barrier hypothesis (5), the cuffs are thought to be pathogenic and lead to the loss of tissue integrity and to ulceration. However, little is known about the morphology of the pericapillary cuffs and whether the fibrin layer is continuous around the blood vessels as a barrier should be. In this report, using laser scanning confocal microscopy, we show in more detail the pattern and intensity of dermal pericapillary fibrin deposition in venous ulcers. We describe fibrin distribution along and around blood vessels, and its spatial configuration. Laser scanning confocal microscopy enabled us to create horizontal and vertical views, study multiple layers of the tissue, visualize the presence and amount of fibrin, and create three-dimensional images of pericapillary fibrin deposition.
MATERIALS AND METHODS
Tissue specimens
We studied six ambulatory patients with venous ulceration of the lower extremities who were referred to our Wound Care Center. All the patients participating in this study had a history of persistent and recurrent venous ulceration for more than six months. The six patients, who had a total of eight ulcers, ranged in age from 33 to 80 years. All patients signed an informed consent and the study was approved by the Institutional Review Board (IRB). We performed eight excisional biopsies from a random site along the edges of eight ulcers. Specimens were immunostained for fibrin using immunofluorescence and screened for the presence and amount of fibrin deposition with a standard epifluorescence microscope.
Immunofluorescence
Biopsy specimens were placed in Michel’s solution for transport to the laboratory where they were stored at −70 °C. Cryostat sections (5-6 μm) were immunostained with fluorescein isothiocyanate conjugated goat antihuman fibrinogen antibody at a dilution of 1:20. The antigenic similarities of fibrinogen and fibrin are such that the antibody binds to both. Specimens were first examined under an epifluorescence microscope and the presence of pericapillary fibrin determined by two observers. The degree of pericapillary fibrin present was graded on a scale of 0 (absent), 1+, 2+, 3+ or 4+ (maximal), depending on the intensity of the immunofluorescence.
Confocal microscopy
Fibrin fluorescence intensity was evaluated using a laser scanning confocal microscope (Multiprobe 2001, Molecular Dynamics, Sunnyvale, CA) equipped with an argon/krypton laser to excite the dye at 488nm. Sections were viewed with a 60X (1, 4 numerical aperture) oil immersion objective. The confocal aperture was set at 50 μm, corresponding to a depth resolution of 0.6 μm with the objective described above. A computer equipped with Imagespace version 3.10 (Molecular Dynamics) was used for operating the system and for processing the images. The software was used to determine the intensity of the fluorescence in selected areas of the images obtained. The calibration curves were obtained from horizontal and vertical scans. The accumulation of labeled fibrin and fibrin related products in different layers around and along the vessel was measured as a ratio of intensity of fluorescence in the selected layer.
Data Processing
Specimens with optimal fluorescence (3+/4+) were completely surrounded by fibrin and mostly isolated veins were used. Using LSCM, we obtained horizontal and vertical scans of our specimen. Graphs were created by measuring the amount of pixels that represents the brightness of the fluorescence as seen in the LSCM. To create depth perception, or z-graphs, we randomly chose a coordinate (‘confocal spot’) on the wall of a selected vessel. This confocal spot was being followed through several layers of horizontal scans, and was referred to as the z1-graph. In addition, a z2-graph was made from a second confocal spot on the vessel wall, lateral to the first. Both outcomes were divided and the resultant graph, z1/z2, was projected. The z graphs should be interpreted as the multi-layer semi-quantification of fluorescence intensity along the vessel, representing the relative presence and amount of fibrin and fibrin related products.
The x-y graphs were created by drawing a reference axis through the vessel wall, starting in the vessel lumen and ending outside the pericapillary cuff. These graphs demonstrate fluorescence intensity from the vessel lumen towards the perivascular tissue.
To create vertical views, we used horizontal views and placed a horizontal axis over the vessel wall, perpendicular to both vessel walls. The positioning of this axis determined the level of vertical views. Vertical views demonstrated fibrin deposition at both sides of the vessel lumen and showed fluorescence in multiple tissue sections through the thickness of the specimen, in contrary to horizontal views which each represented one single section. The split screen pictures showed both horizontal and vertical views, the latter projected at the level of the horizontal axis. In fact, the vertical view consists of a stack of horizontal sections. The vertical graphs represented fluorescence accumulation at one side of the vessel lumen. Pixels in the vertical and x-y graphs each represented 0.17 μm. Intersectional distance in the z graphs depended on the step-size, varying between 0.1 and 0.6 μm. Fluorescence intensity in all graphs was quantified on a relative scale of 0-250. Sequential graphs represented relative distribution of fibrin and fibrin related products; fluorescence intensity was not quantified in absolute units.
RESULTS
All eight specimens (from a total of six patients) showed some degree of fibrin deposition. Out of these eight samples, four showed optimal immunofluorescence (3+/4+). The analysis was preformed on all eight samples unless otherwise specified and in all cases where representative results are described the findings were present in at least 90% of the samples.
Horizontal views and graphs
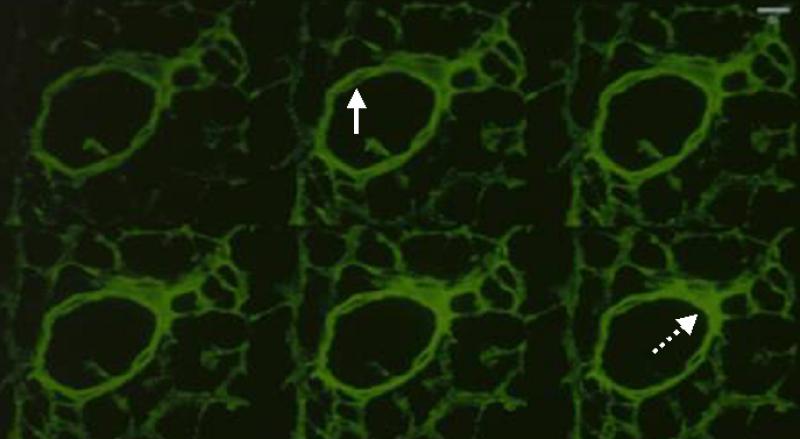
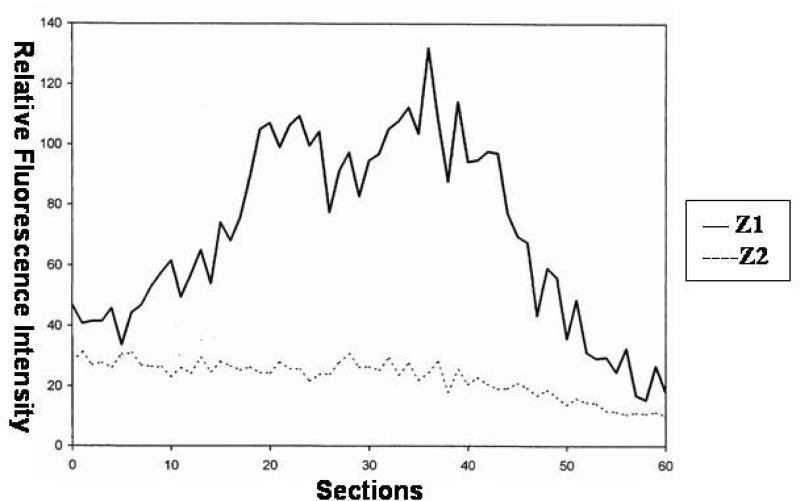
Immunofluorescence was mostly concentrated around the small dermal vessels, suggesting the presence of cohesive and dense polymerized fibrin in the pericapillary area. Fibrin deposition was maximal in the pericapillary areas and in the tissue immediately surrounding the dermal vessels. The photomicrograph in Figure 1 shows horizontal views of sequential cuts (sections 1, 3, 5, 7, 9, and 11) of a representative dermal vessel. Fibrin micro-distribution varied considerably around the vessel wall and in the perivascular tissue. Some coordinates expressed maximal fluorescence as deep as 1 μm beneath the tissue surface. Therefore, antibody penetration was not restricted to the upper sections; distribution of fibrinogen and fibrin-related products appeared variably present throughout all sections. This is an important point because it is an example of the fact that the patchy intensity of fibrin as determined by the fibrinogen/fibrin antibody is unlikely to be an artifact. Taken together, these findings suggest that fibrinogen leaks out of the intravascular space and show that the fibrin distribution varies in different tissue planes (Figure 1). Previous studies using conventional histology were not able to make this important observation. Figure 2 confirms these findings by showing graphs of the relative distribution of fibrin in the z plane, along the vessel. As shown in Figure 2, the multiple peaks in the z1 and z2 graphs indicate great variability in fluorescence intensity. We found bright, fluctuating fluorescence intensity in the z1-plane and more moderate, stable fluorescence patterns in the z2-plane. The exact significance of the more stable fibrin distribution outside the vessel lumen is not exactly clear. However, it probably speaks of the dynamic nature and kinetics of fibrin extravasation. Fibrinogen has to leak from the vessel lumen through the endothelium and into the extracellular space. Therefore, more variability in fibrinogen/fibrin immunostaining can be expected within the lumen and in the vessel wall. Once outside the vessel wall, fibrinogen is quickly polymerized to fibrin and, thus, accumulates and appears to be more stably established. It should be noted that z1 represents the multi-section fibrin distribution within the vessel, and z2 represents the multi-section fibrin distribution in the surrounding tissue.
Figure 1.
Sections of horizontally imaged pericapillary fibrin deposition using laser scanning a confocal microscope from a representative blood vessel. The sequence is from left to right and represents sections 1, 3, 5, 7, 9, 11 respectively. The intensity of fibrin deposition varies according to the plane as determined by confocal microscopy. The solid and dashed arrows point to areas of low or high fibrin intensity, respectively.
Figure 2.
Horizontal graph from a representative blood vessel. Z1 represents the intensity of fluorescence on a random spot on the vessel wall through different cut sections, as shown in the pixel density measured by the computer. Z2 represents the intensity of fluorescence at a random spot outside the vessel wall. The multiple peaks in Z1 and Z2 indicated great variability in fluorescence intensity in each cut section.
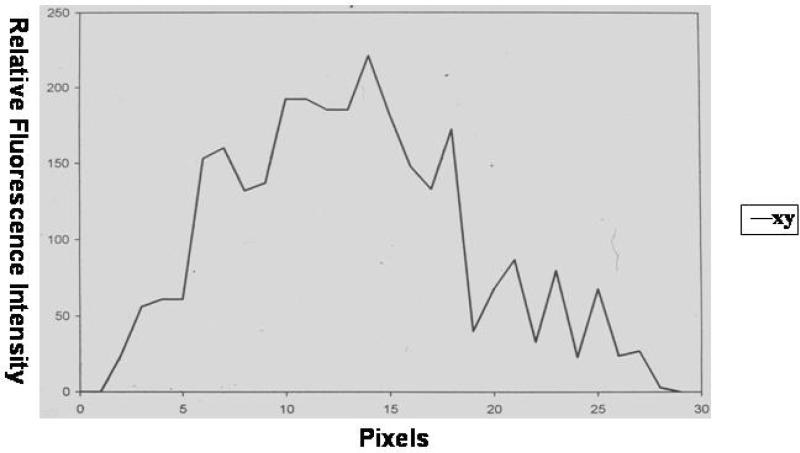
The x-y sequential graph in Figure 3 shows an increase in fluorescence intensity over the first 10-15 pixels, representing a margin of ± 2 μm (pixel size 0.17 μm). The majority of fluorescence is expressed over a range of 15-20 pixels, representing a margin of 3 μm. In the outer regions we found a gradual fading and eventually stable fluorescence intensity. These fluorescence patterns suggest that fibrin deposition is decreased in the area closest to the lumen, is then maximally present as pericapillary fibrin cuffs, and shows rapid decline in the outer tissue regions.
Figure 3.
Fluorescence intensity on the vessel wall. This was measured on a random spot from the lumen (pixel 1) to the perivascular surrounding (pixel >20) from a representative blood vessel.
Vertical confocal views and vertical graphs
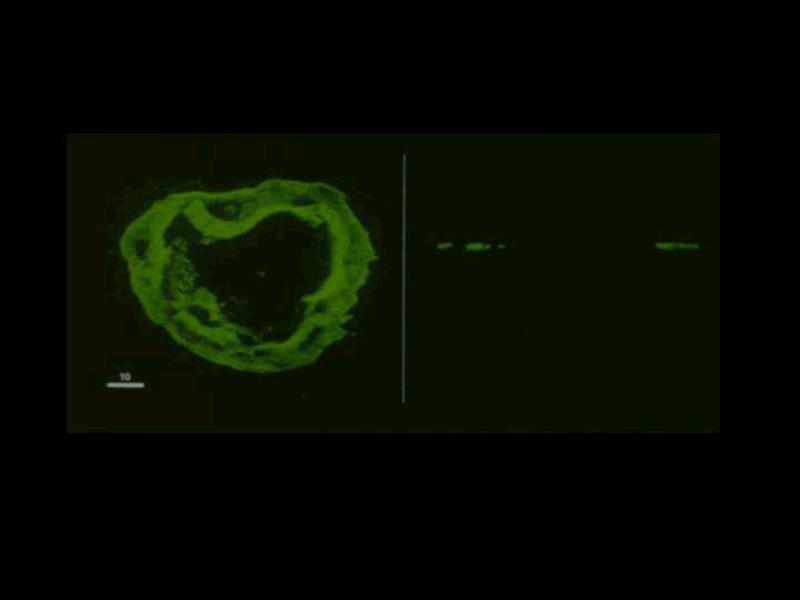
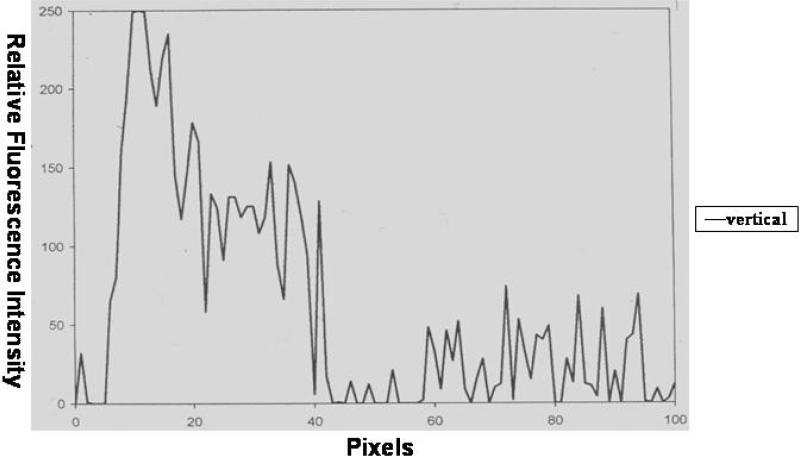
The vertical confocal views supported the hypothesis that fibrin deposition around dermal vessels varies considerably. The left side of Figure 4 shows a representative vessel as seen in a horizontally cut section with the corresponding vertical view on the right side. The vessel lumen, as seen in the vertical view, was flanked by fuzzy fluorescence patches. The fluorescent patches on either side of the vessel lumen showed differences in density and configuration. The graph for this type of vertical cut section is shown in Figure 5, which showed considerable variability in fluorescence intensity in multiple layers from the vessel lumen (pixel 1) to the outer regions (pixels >60). We found maximal fluorescence intensity over the range of 10-15 pixels, which represents a margin of which represents a margin of ± 2 μm (pixel size 0.17μm). Unlike what was observed in the horizontal graphs, the vertical graph did not show a gradual increase in fibrin deposition. Vertical imaging pointed to multiple peaks in the amount of fibrin over a large range of 40-70 pixels, representing a margin of 7-12 μm. There is then a decrease in fluorescence intensity towards the periphery of the vessel wall.
Figure 4.
Confocal Microscopy in horizontal and vertical planes. Left) Confocal microscopy picture of a representative capillary with its fibrin deposition. Right) The same capillary as seen in a vertical cut section.
Figure 5.
Graph of fluorescence intensity of a vessel in a vertical cut section. Pixel 0 represents the area on the vessel lumen and pixels > 60 represent the outer layer of the vessel.
DISCUSSION
The presence of pericapillary fibrin in venous disease is well established, but its pathogenic role is not certain. Originally, fibrin cuffs have been thought to behave as a structural barrier for the diffusion of oxygen and other nutrients (5; 6). However, several studies question the importance of pericapillary fibrin cuffs as a barrier to the diffusion of oxygen and nutrients. First, it has been uncertain whether the cuffs are truly continuous around the dermal capillaries; a discontinuous cuff would make its presence of and function as an anatomical barrier unlikely (7). Second, the gross intensity and extent of pericapillary fibrin cuffs has no relationship to the relative degree of venous insufficiency, level of transcutaneous oxygen tension, or lipodermatosclerosis score (4). There are indications that ulcers can heal in spite of the persistence of fibrin cuffs (4). The results presented here support the hypothesis that pericapillary fibrin cuffs are discontinuous. Both horizontal and vertical imaging demonstrated transectional peaks in pericapillary fibrin expression, patch-like fibrin deposition within the pericapillary cuffs, and relative differences in fibrin density. Our studies indicate that fibrin expression, in both pericapillary fibrin cuffs and outer tissue regions, is variable in all planes.
Nevertheless, it is still possible that pericapillary fibrin cuffs can physiologically obstruct the diffusion of oxygen and nutrients. Deposition throughout tissue may be variable and discontinuous, but pericapillary fibrin was never absent in the specimens studied. Low oxygen tension in venous ulcers (8) is still unexplained and the deposition of pericapillary fibrin, although discontinuous, might impede diffusion of oxygen in a situation of localized ischemia. The deposition and persistence of fibrin and certain fibrinogen fragments may impede healing of venous leg ulcers. It s also possible that the extent of fibrin cross-linking, which we could not test for in this morphological study, may be important in a pathogenic role of pericapillary fibrin. Moreover, fibrin may interfere with wound healing by decreasing fibroblast activity. Fibrin and fibrinogen have a direct down-regulatory effect on procollagen type I synthesis (7). Our results support the therapeutic relevancy of enhancing fibrinolysis in patients with venous disease (9; 10). Conversely, we have shown that keratinocytes attach and spread well in fibrin that is fully cross-linked (11). Therefore, one possible future study should explore the extent of fibrin cross-linking and correlate it with the confocal findings performed in this report. Perhaps, not all fibrin is appropriately cross-linked.
There are always areas of concern when trying to determine the specific configuration of a molecule in tissues. Some of the problems, particularly in regards to antibody penetration, have been dealt with by our careful sectioning and ability to graph the distribution of fibrin at multiple levels. Other problems as we have already mentioned, have to do with differences in the diffusion properties of cross-linked and uncross-linked fibrin; to our knowledge, this has not be addressed in the context of venous ulceration. In summary, however, our data indicate that fibrin deposition is highly discontinuous around dermal blood vessels. This has important implications for the hypothesis of fibrin cuffs as a true anatomic-like barrier between the circulation and tissue. Our studies show that there is no true anatomic barrier, at least from the morphological standpoint. However, one should still consider that fibrin may not be a pure epiphenomenon and simply a marker for leaky capillaries. Thus, in situations of low profusion, fibrin may presumably still act as a partial barrier in spite of its patchy distribution. Moreover, as we have previously shown, fibrin can trap growth factors and other extracellular molecules and render them unavailable to the healing process (8).
ACKNOWLEDGMENTS
We are very grateful to the contributions of Martijn van de Scheur in the preparation of the manuscript. This work was supported in part by NIH Grants DK067836, P20RR018757, and the Wound Biotechnology Foundation.
National Institutes of Health
R01 DK067836-04
REFERENCES
- 1.Falanga V. Venous ulceration. J Dermatol Surg Oncol. 1993;19:764–771. doi: 10.1111/j.1524-4725.1993.tb00422.x. [DOI] [PubMed] [Google Scholar]
- 2.Falanga V, Moosa HH, Nemeth AJ, Alstadt SP, Eaglstein WH. Dermal pericapillary fibrin in venous disease and venous ulceration. Arch Dermatol. 1987;123:620–623. [PubMed] [Google Scholar]
- 3.Burnard KG, Whimster IA, Browse NL. Pericapillary fibrin in the ulcer bearing skin of the leg: the cause of lipodermatosclerosis and venous ulceration. Br Med J. 1982;285:1071–1072. doi: 10.1136/bmj.285.6348.1071. [DOI] [PMC free article] [PubMed] [Google Scholar]
- 4.Falanga V, Kirsner R, Katz MH, Gould E, Englstein WH, McFalls S. Pericapillary fibrin cuffs in venous ulceration: persistence with treatment and during ulcer healing. J Dermatol Surg Oncol. 1992;18:409–413. doi: 10.1111/j.1524-4725.1992.tb03694.x. [DOI] [PubMed] [Google Scholar]
- 5.Browse NI, Burnand KG. The cause of venous ulceration. Lancet. 1982;2:243–45. doi: 10.1016/s0140-6736(82)90325-7. [DOI] [PubMed] [Google Scholar]
- 6.Senior RM, Skozen WF, Griffin GL, Wilner GD. Effects of fibrinogen derivatives upon the inflammatory response. J Clin Invest. 1986;77:1014–1019. doi: 10.1172/JCI112353. [DOI] [PMC free article] [PubMed] [Google Scholar]
- 7.Pardes JB, Tonneson MG, Falanga V. Capillaries surrounding chronic venous ulcers demonstrate muscle cell hyperplasia and increased laminin and type IVcollagen. J Invest Dermatol. 1990;94:563. [Google Scholar]
- 8.Falanga V, Englstein WH. The trap hypothesis of venous ulceration. Lancet. 1993;341:1006–8. doi: 10.1016/0140-6736(93)91085-z. [DOI] [PubMed] [Google Scholar]
- 9.Burton CS. Venous ulcers. Am J Surg. 1994;167:37s–40s. doi: 10.1016/0002-9610(94)90009-4. [DOI] [PubMed] [Google Scholar]
- 10.Falanga V, Kruskal J, Franks JJ. Fibrin and fibrinogen related antigens in patients with venous disease and venous ulceration. Arch Dermatol. 1991;127:75–78. [PubMed] [Google Scholar]
- 11.Weiss E, Yamaguchi Y, Falabella A, Crane S, Tokuda Y, Falanga V. Un-cross-linked fibrin substrates inhibit keratinocyte spreading and replication: correction with fibronectin and factor XIII cross-linking. J Cell Physiol. 1998;174:58–65. doi: 10.1002/(SICI)1097-4652(199801)174:1<58::AID-JCP7>3.0.CO;2-F. [DOI] [PubMed] [Google Scholar]


