

Abstract
Background
In multiple sclerosis (MS), brain atrophy quantification is affected by white matter lesions. LEAP and FSL-lesion_filling, replace lesion voxels with white matter intensities; however, they require precise lesion identification on 3DT1-images.
Aim
To determine whether 2DT2 lesion masks co-registered to 3DT1 images, yield grey and white matter volumes comparable to precise lesion masks.
Methods
2DT2 lesion masks were linearly co-registered to 20 3DT1-images of MS patients, with nearest-neighbor (NNI), and tri-linear interpolation. As gold-standard, lesion masks were manually outlined on 3DT1-images. LEAP and FSL-lesion_filling were applied with each lesion mask. Grey (GM) and white matter (WM) volumes were quantified with FSL-FAST, and deep gray matter (DGM) volumes using FSL-FIRST. Volumes were compared between lesion mask types using paired Wilcoxon tests.
Results
Lesion-filling with gold-standard lesion masks compared to native images reduced GM overestimation by 1.93 mL (p < .001) for LEAP, and 1.21 mL (p = .002) for FSL-lesion_filling. Similar effects were achieved with NNI lesion masks from 2DT2. Global WM underestimation was not significantly influenced. GM and WM volumes from NNI, did not differ significantly from gold-standard. GM segmentation differed between lesion masks in the lesion area, and also elsewhere. Using the gold-standard, FSL-FAST quantified as GM on average 0.4% of the lesion area with LEAP and 24.5% with FSL-lesion_filling. Lesion-filling did not influence DGM volumes from FSL-FIRST.
Discussion
These results demonstrate that for global GM volumetry, precise lesion masks on 3DT1 images can be replaced by co-registered 2DT2 lesion masks. This makes lesion-filling a feasible method for GM atrophy measurements in MS.
Keywords: Multiple sclerosis, Lesion filling, LEAP, FSL
Highlights
-
•
In multiple sclerosis brain atrophy measurement is affected by white matter lesions.
-
•
LEAP and FSL-lesion_filling replace lesion voxels with white matter intensities.
-
•
The two lesion-filling methods show differences.
-
•
2D lesion masks can be registered and used for lesion-filling on 3DT1 images.
-
•
This makes lesion-filling a feasible method for atrophy measurements in MS.
1. Introduction
In the multiple sclerosis (MS) brain, volume loss or “atrophy” of the grey (GM) and white matter (WM) has been observed (Benedict et al., 2005; De Stefano et al., 2007; Fisher et al., 2008; Miller et al., 2002; Minneboo et al., 2008). While 3DT1-weighted images with thin sections are highly suitable for quantifying the GM and WM volumes, the white matter MS lesions are also visible on these images as signal hypo-intensities, affecting most automated image segmentation methods (Battaglini et al., 2012; Chard et al., 2010; Nakamura and Fisher, 2009; Sdika and Pelletier, 2009). Three recent methods circumvent this problem by replacing (“filling”) lesion voxels with white matter intensities (Battaglini et al., 2012; Chard et al., 2010; Sdika and Pelletier, 2009) on images with simulated lesions, yielding segmentations as if lesions were absent. Although these methods are able to reduce the WM lesion influence on atrophy measurements, they require outlining of the lesions on 3DT1 images. In the absence of satisfactory automated WM lesion segmentation methods (Garcia-Lorenzo et al., 2013; Llado et al., 2012), these outlines have to be generated manually on the large number of sections for each 3DT1 image volume, which is labor-intensive and therefore too costly for large studies. As a result, the lesion-filling methods are currently not used to their full potential. By contrast, many clinical trials and academic studies do generate manual lesion masks for 2D dual-echo images, which normally have thicker slices (e.g. 3 mm compared to 1 mm of the 3DT1 sections). If these 2D lesion masks could be used instead of manual 3D lesion masks, lesion-filling could be applied in large studies to achieve improved quantification of tissue-specific atrophy without the prohibitive cost of precise 3D manual outlining.
Therefore, in the present study, we assessed the performance of MS lesion-filling with co-registered WM lesion masks from 2DT2-weighted images. By using two interpolation methods and a range of thresholds, we created different versions of the co-registered 2DT2 lesion masks. We then applied lesion-filling to the corresponding regions of the 3DT1 images, using two methods: the “LEAP” method (Chard et al., 2010) and FSL-lesion_filling (Battaglini et al., 2012). For each resulting image we quantified tissue volumes using FSL-FAST and FSL-FIRST, and assessed agreement of the resulting global GM and WM volumes and deep GM volumes with those obtained using gold-standard 3D lesion masks. Additionally, we investigated whether the observed differences on the voxelwise GM segmentations from FSL-FAST occurred inside lesion areas, in other regions, or both.
2. Materials and methods
The flowchart in Fig. 1 illustrates our workflow. FSL version 5.0.4 was used for the processing.
Fig. 1.
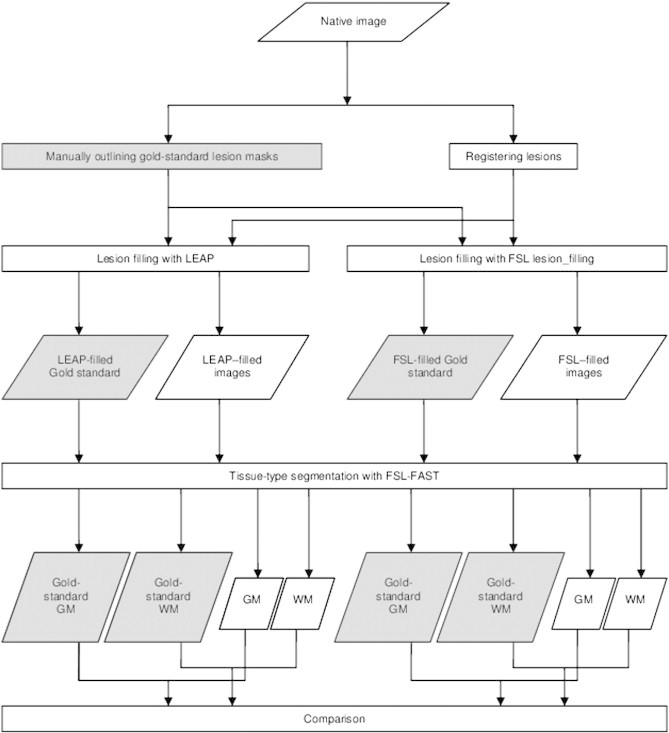
Flow-chart of the image processing.
2.1. Patients and images
Previously acquired 3DT1 image volumes were selected from a total of 20 MS patients (center A: 10 patients, 3 T; center B: 10 patients, 1.5 T). Ethics committee approval and informed consent were obtained from the patients for the original study in which they participated. The image acquisition parameters and clinical data of the patients are listed in Table 1.
Table 1.
Descriptive values per center reported as median (interquartile range IQR).
| Amsterdam | London | |
|---|---|---|
| Nr. patients (women) | 10 (4) | 10 (5) |
| Age (years) median (IQR) | 44 (32–48) | 34 (30–44) |
| Disease typea | 9 RRMS, 1 SPMS | 10 RRMS |
| Disease duration (years) median (IQR) | 8 (8–9) | 2 (1.5-2.5) |
| EDSSb | 1.5 (1–4.25) | 1.5 (1–2) |
| Disease modifying treatment | 5 patients | - |
| NBV on gold-standard filled images (L)c median (IQR) | 1.43 (1.48-1.53) | 1. 54 (1.48-1.58) |
| Lesion load (mL) median (IQR)d | 1.2 (0.52-4.55) | 6.27 (2.21-15.99) |
| Lesion numbers median (IQR)d | 21 (16–40) | 15 (10–22) |
| 3DT1 hypointense lesion volume (mL) median (IQR) | 1.55 (0.9-4.3) | 6 (2–11.1) |
| 3DT1 hypointense lesion numbers median (IQR) | 20 (16–42) | 15 (9–31) |
| Field strength (T) | 3.0 | 1.5 |
| 3D-T1 voxel size (mm) | Sagittal 0.97/0.97/1 | Axial 1.17/1.17/1.5 |
| PDT2 voxel size (mm) | 0.5/0.5/3 | 0.9/0.9/5 |
RRMS = relapsing-remitting multiple sclerosis SPMS = secondary progressive multiple sclerosis.
EDSS = Expanded Disability Status Scale.
NBV = Normalized Brain Volume (calculated with FSL-SIENAX).
Lesion load (lesion numbers) = lesion volume (lesion numbers) on the 2DT2 lesion masks that had already been manually outlined for the original study in the participating centers.
2.2. 2DT2 lesion masks
We collected the 2DT2 lesion masks that had already been manually outlined for the original study in the participating centers. Using FLIRT (Jenkinson et al., 2002), the 2DT2-weighted images were linearly registered to 3DT1 images, both with nearest neighbor (NNI) and tri-linear interpolation (TLI) and the transformation matrix applied to the lesion masks obtained on the 2DT2-weighted scans. To the registered TLI masks, we additionally applied a range of thresholds between 0 and 1, with a step size of 0.1, giving 11 different TLI lesion masks. Together with the NNI lesion masks, this yielded 12 different versions of 3DT1-co-registered lesion masks derived from the 2DT2 lesion masks. All the registered masks were visually checked for registration errors.
2.3. 3D lesion masks
Gold-standard 3D lesion masks were manually outlined by a single observer (NCGR) on 3DT1 images by adjusting the contours of the 2DT2 lesion masks after registering them to the 3DT1 images. In the rare occurrence where a 2D lesion did not correspond to a 3DT1 hypointense area, the lesion contour was not deleted, but still considered a lesional area. The lesion masks were all inspected for correctness by VP.
2.4. Lesion filling
For each of the 13 different lesion mask versions (12 co-registered and the gold standard set), images underwent lesion-filling with two methods.
The first lesion-filling method is LEAP, described in detail elsewhere (Chard et al., 2010). Briefly, LEAP separates brain from non-brain tissue (Smith, 2002), corrects image non-uniformity using N3 (Sled, 1997), generates a simulated WM image without any lesions based on the noise and signal inhomogeneity of the original image, and finally replaces the original intensity values within the lesion masks with intensity values taken from corresponding locations in the simulated WM image.
The second method used for lesion-filling was FSL-lesion_filling (Battaglini et al., 2012). Briefly, this fills lesion mask voxels with intensities based on the neighboring non-lesion voxels of the lesion masks.
2.5. Quantification of volumes
For each patient, brain tissue volumes were quantified from the following 27 image volumes: the native (non-filled) 3DT1 image volume; the set of thirteen 3DT1 image volumes obtained after lesion-filling with LEAP using the different lesion masks; and the set of thirteen 3DT1 image volumes obtained after lesion-filling with FSL-lesion_filling using the different lesion masks (see Fig. 1 for the flowchart illustrating this).
In each case, we first removed non-brain tissue using BET, with optimized parameters as previously described (Popescu et al., 2012). Next, global GM and WM volumes were quantified using the partial volume estimation within FSL-FAST (Smith et al., 2004); and deep grey matter (DGM) volumes were calculated using FSL-FIRST (Patenaude et al., 2011); specifically, volumes were obtained for the following structures: brainstem, and bilateral putamen, caudate nucleus, thalamus, putamen, hippocampus, amygdala, and nucleus accumbens. Bilateral volumes of GM structures were averaged. The GM and WM volumes obtained on the native images are calculated with default FSL-FAST so they would also include the misclassified voxels.
Brain tissue volume, normalized for subject head size (NBV), was estimated with SIENAX (Smith et al., 2002) part of FSL (Smith et al., 2004).
2.6. Statistics
For each of the two lesion-filling methods (LEAP and FSL-lesion_filling), we compared the GM, WM and DGM volumes obtained using each version of the co-registered lesion masks and the native images to the corresponding values obtained when using the gold-standard lesion masks using paired Wilcoxon signed ranks test. The significance level was p < 0.05.
3. Results
Fig. 2 shows an MRI image example before lesion filling with no lesion masks, with superimposed gold-standard masks, NNI registered lesion masks and TLI registered lesion masks with different thresholds. As expected, co-registered lesion masks do not overlap perfectly with 3DT1 lesion areas.
Fig. 2.
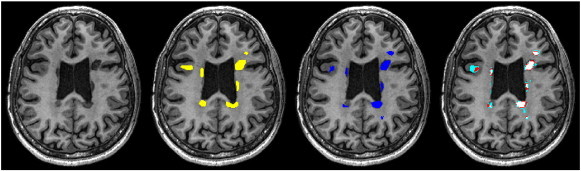
Axial view of 3DT1 image and different lesion masks for a 47-years old, male RRMS patient scanned at 3 T. From left to right: Image with no lesion masks. Image with precise manual lesion masks (yellow). Image with nearest neighbor registered lesion masks (dark blue). Image with trilinearly registered lesion masks with different thresholds: light blue: threshold = 0.2; red: threshold = 0.5; pink: threshold = 0.8.
3.1. Global GM and WM volumes from FSL-FAST voxelwise PVE segmentation
The native images, images after lesion filling (with LEAP and FSL-lesion_filling) and the GM and WM segmentation of these images are depicted in Fig. 3.
Fig. 3.
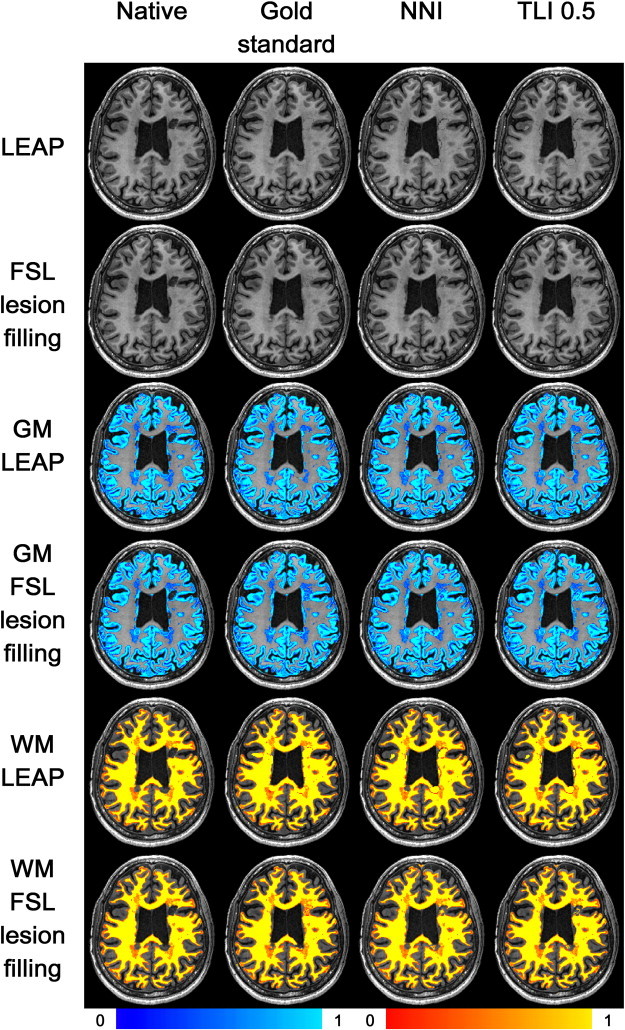
Images after lesion filling with LEAP (row 1) and FSL-lesion_filling (row 2). Rows 3 and 4: grey matter (GM) segmentation after lesion filling with LEAP (row 3) and FSL-lesion_filling (row 4). Rows 5 and 6: white matter (WM) segmentation after lesion filling with LEAP (row 5) and FSL-lesion_filling (row 6). From left to right: no lesion masks; image with precise manual lesion masks; image with nearest neighbor registered lesion masks; image with trilinearly registered lesion masks threshold = 0.5. The color scales are the same for all images and are depicted below.
Fig. 4 shows the boxplots of the global GM and WM volumes for each of the lesion mask types and for the native images. Supplementary eTable 1 lists these results and Supplementary eTable 2 the DGM volumes. Lesion-filling with LEAP using gold-standard lesion masks resulted in smaller global GM volumes compared to native images (1.93 mL, p < .001). Conversely, global WM volumes were not different using lesion filling with gold-standard lesion masks compared to native images (0.2 mL, p = .7). For lesion filling with FSL-lesion_filling, very similar results were observed for both GM and WM volumes (Supplementary eTable 1).
Fig. 4.
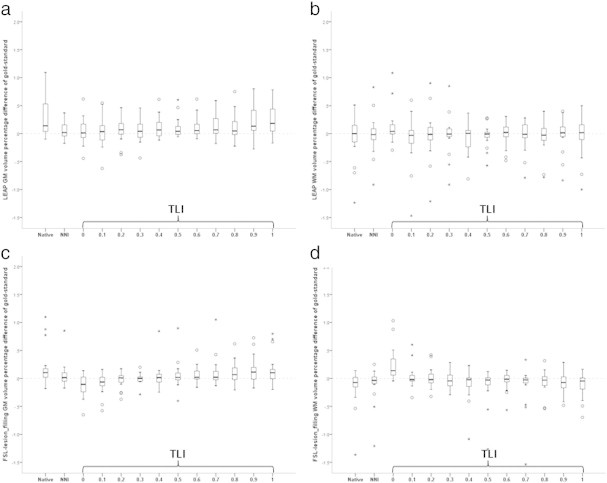
Boxplots of the relative error in grey matter (GM) volumes (a, b) and white matter (WM) volumes (c, d) from segmentation of images after filling lesions obtained with different lesion masks using LEAP for lesion filling (a, c) and FSL lesion_filling (b, d). The GM and WM volumes are reported as percentual difference relative to the GM volume obtained after filling the gold-standard (manual) lesion masks and then applying FSL-FAST segmentation. Native = native (unfilled) images. NNI = after filling with nearest-neighbor co-registered masks. TLI = after filling with trilinearly co-registered masks and then thresholding with the indicated value.
Fig. 4 shows the boxplots of the global GM and WM volumes for each of the lesion mask types and for the native images. Supplementary eTable 1 lists these results and Supplementary eTable 2 the DGM volumes. Lesion-filling with LEAP using gold-standard lesion masks resulted in smaller global GM volumes compared to native images (1.93 mL, p < .001). Conversely, global WM volumes were not different using lesion filling with gold-standard lesion masks compared to native images (0.2 mL, p = .7). For lesion filling with FSL-lesion_filling, very similar results were observed for both GM and WM volumes (Supplementary eTable 1).
For both LEAP lesion filling and FSL-lesion_filling, GM volumes from FSL-FAST measured on images filled with NNI masks were not statistically different from the GM volumes obtained from the gold-standard segmentation (p = .232 and p = .279 respectively). For FSL-lesion_filling, lesion masks obtained through tri-linear interpolation and subsequent thresholding showed a trend towards underestimation of global GM volume for low thresholds, and overestimation of global GM volume for higher thresholds. For LEAP, these same lesion masks resulted in less consistent behavior regarding the resulting global GM volumes (Fig. 4).
3.2. Deep GM volumes from FSL-FIRST
In this sample, the DGM volumes quantified by FSL-FIRST did not differ between the native images and the images filled using gold-standard lesion masks (Supplementary eTable 2), neither for LEAP nor for FSL-lesion_filling. In line with this, there were also no differences for any of the co-registered lesion masks for either lesion filling method (Supplementary eTable 2): p-values for the different DGM structures were between .232 and .526 for LEAP, and between .145 and .911 for FSL-lesion_filling. To illustrate this, Fig. 5 shows the boxplots of the relative error in mean bilateral thalamic volumes.
Fig. 5.
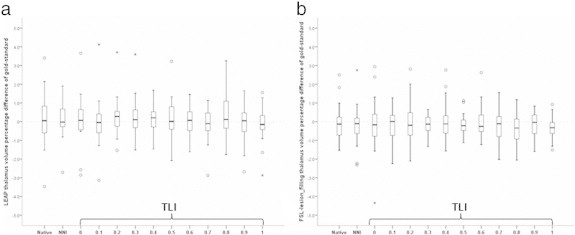
Boxplots of the relative error in mean bilateral thalamic volumes from segmentation of images after filling lesions obtained with different lesion masks using LEAP for lesion filling (a) and FSL lesion_filling (b). The thalamic volumes are reported as percentual difference relative to the thalamic volume obtained after filling the gold-standard (manual) lesion masks and then applying FSL-FAST segmentation. Native = native (unfilled) images. NNI = after filling with nearest-neighbor co-registered masks. TLI = after filling with trilinearly co-registered masks and then thresholding with the indicated value. These graphs are similar to the behavior of the other DGM structures both with LEAP lesion filling as well as with FSL-lesion_filling.
In this sample, the DGM volumes quantified by FSL-FIRST did not differ between the native images and the images filled using gold-standard lesion masks (Supplementary eTable 2), neither for LEAP nor for FSL-lesion_filling. In line with this, there were also no differences for any of the co-registered lesion masks for either lesion filling method (Supplementary eTable 2): p-values for the different DGM structures were between .232 and .526 for LEAP, and between .145 and .911 for FSL-lesion_filling. To illustrate this, Fig. 5 shows the boxplots of the relative error in mean bilateral thalamic volumes.
3.3. Location of differences in voxelwise FSL-FAST PVE segmentations
Because significant global GM volume differences were observed from the analysis of FSL-FAST voxelwise segmentations, we analyzed whether these differences were mainly localized in lesion areas, or also elsewhere in the brain. The differences were located both inside and outside of the lesion area as visible in Fig. 6. With increasing lesion volumes, the overestimation of total GM volume increases. Interestingly, GM overestimation inside lesion areas is partially offset by an underestimation outside the lesion areas. Both effects show a tendency to increase with increasing lesion volumes (Fig. 6 panels A and B). These effects were observed for both lesion filling methods, though to a slightly smaller extent for FSL-lesion_filling. When using NNI masks these effects were markedly reduced and much better agreement with gold-standard results was achieved across the range of lesion volumes (Fig. 6 panels C and D).
Fig. 6.
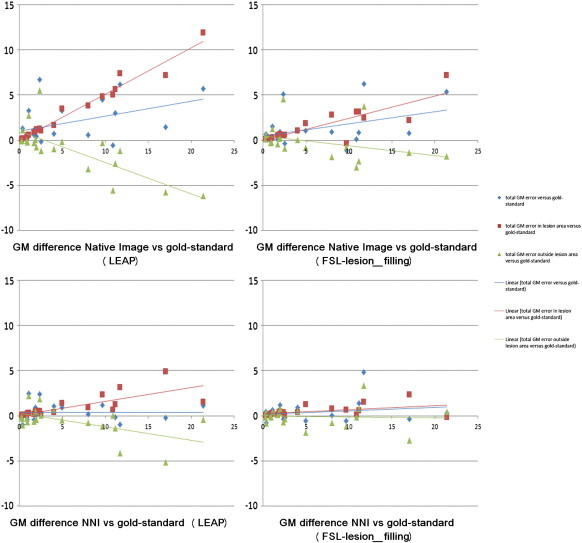
Location of grey matter (GM) differences (mm3) to gold-standard lesion-filling with LEAP (left column) and FSL-lesion-filling (right column) as a function of the gold-standard lesion volume. Above the native images compared to gold-standard and below the images filled with nearest-neighbor registered masks (NNI) compared to gold-standard. In blue with diamond-shaped markers is depicted the total GM difference from gold-standard, in red with square markers the difference within the lesion area and in green with triangular markers the difference outside of the lesion area.
The NNI lesion masks did not overlap perfectly with 3DT1 lesion areas; there were 42% false positive voxels (averaged across patients) compared to gold-standard and 60% false negative voxels (averaged across patients) compared to gold-standard. But after FSL-FAST segmentation only 0.17% of the segmented GM was found within the false negative voxels and 0.03% within the false positive voxels (Fig. 7). The percentage of false positive voxels compared to gold-standard was not significantly correlated with gold-standard lesion volume (Spearman's rho = 0.08 p = 0.74), the percentage of false negative voxels had a significant negative correlation with gold-standard lesion volume (Spearman's rho = − 0.63, p = 0.003), indicating that for higher lesion volumes, there are less false negative voxels.
Fig. 7.
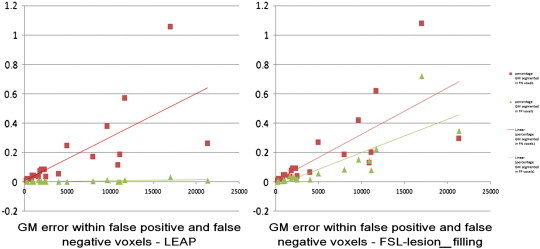
Percentage of grey matter (GM) segmented within the false negative and false positive voxels of the images filled with nearest-neighbor registered masks (NNI) after lesion-filling with LEAP (left) and FSL-lesion-filling (right) as a function of the gold-standard lesion volume. In red with square markers is depicted the percentage of GM segmented within the false negative voxels and in green with triangular markers the percentage of GM segmented within the false positive voxels.
Finally, on native images on average 49.8% of the lesion area is quantified as GM. After lesion-filling this percentage is highly improved: when using the gold-standard, on average 0.4% of the LEAP-filled lesion area is quantified as GM, and 24.5% of the FSL-lesion_filling filled lesion area is quantified as GM (Fig. 3).
4. Discussion
This study demonstrates that when co-registered lesion masks from 2D images are used for lesion filling on 3DT1 images of patients with MS, the quantitative GM volumes obtained are very similar to those obtained using manually outlined 3D lesion masks.
Quantification of GM volumes has become an important goal in MS research and evaluation of therapeutic efficacy. Without lesion filling, the error in global GM volume can be substantial, but lesion filling reduces this GM quantification error (Battaglini et al., 2012; Nakamura and Fisher, 2009; Sanfilipo et al., 2005). In the current study, this GM quantification error from the native images amounted to an average overestimation of 0.3% and in individual cases was as high as 1%. These effects are sizable in MS, where GM atrophy rates are approximately 0.2-0.6% per year (Fisher et al., 2008). This confirms the need for a practical solution to this GM quantification problem caused by the WM lesions.
However, despite technical developments in recent years, the lesion-filling solution to atrophy quantification in MS has so far not achieved its full potential. An important reason is that in the absence of satisfactory automated lesion segmentation methods (Garcia-Lorenzo et al., 2013; Llado et al., 2012; Mortazavi et al., 2012), lesion-filling requires labor-intensive precise manual outlining on high-resolution 3D images which is usually prohibitively costly and this crucial practical aspect of the method has so far received limited attention. The present study provides a viable solution to this problem, by demonstrating that lesion-filling using co-registered lesion outlines from 2D images with the nearest neighbor method (NNI) produces accurate volumetric results for global GM and WM, as well as for DGM structures.
Among the interpolation methods for the registration of the lesion masks, NNI most consistently provided volumetric results comparable to gold-standard. This was visible with both lesion-filling methods, indicating that our result is not lesion-filling method dependent.
Although the NNI masks do not overlap perfectly with the gold-standard masks, they significantly improve the GM segmentation, due to changes in segmentation not only in the lesion area but also outside of the lesion area (Fig. 6). Registering PDT2 lesion-masks proves as expected not to be perfect, but a feasible approach for significant improvement in global GM volumetry when more precise lesion masks are unavailable.
The white matter segmentation as well as the DGM segmentation proved to be less sensitive to the influence of the lesions, as the results before and after lesion-filling with any lesion mask were not statistically different. This is in contrast with another study in MS with a comparable sample size and a lesion filling method similar to FSL-lesion_filling where the DGM volumes were significantly smaller after lesion filling than before (Gelineau-Morel et al., 2012). Also in the study of Chard et al. (2010) the white matter volume was significantly increased after lesion-filling. This may be due to the fact that our patients have a relative low lesion load compared to these two studies. In light of the results of these studies, and recalling that with higher lesion loads the percentage of false negative lesional voxels compared to gold-standard decreases, it is likely that the effect of lesion-filling using masks from T2-weighted images will have a proportionally greater beneficial effect on brain segmentation as the brain lesion load increases.
Direct comparison of the two filling methods showed that significantly more voxels of the areas filled with FSL-lesion_filling were segmented as GM than after filling with LEAP. FSL-lesion_filling uses neighboring voxels for lesion-filling and as such the neighboring CSF and GM intensities will also be used for filling, resulting in GM being segmented within the lesion masks even after filling. On the other hand the LEAP method does not account for the neighboring voxels, which can create intensity differences between the filled lesions and the surrounding WM, as visible in Fig. 3. In the current study, this boundary did not have a negative effect on FSL-FAST or FSL-FIRST segmentation, but it cannot be excluded that its presence may influence other segmentation methods. This may also account for the segmentation of the FSL-lesion_filling images yielding results closer to the segmentation of native images. Studies that utilize lesion-filling with different software platforms should ideally assess the effect of different lesion filling methods on the results.
Current segmentation algorithms (including FSL-FAST) often used in MS research may misclassify lesion voxels as GM due to the labeling of lesion voxels according to their intensities (falling within the GM intensity range) and the dependence on its neighbors (Smith et al., 2004). Compared with the native images, the misclassification within the lesion area is markedly improved by lesion-filling with both methods. Still, the effect of lesion filling extends beyond the limits of the lesions and influences the whole GM segmentation, probably due to the changes in the whole image intensity histogram, used by FSL-FAST. This effect was marked on GM areas outside lesions, in line with previous studies (Chard et al., 2010; Gelineau-Morel et al., 2012) on simulated images. Here we have confirmed and quantified this effect on a multi-center MS patients' dataset. The NNI registered lesion masks used for lesion filling proved to markedly reduce these effects (both inside and outside the lesion area) and produced results very similar to using gold standard lesion masks.
Limitations: The data in this study consists of 20 patients from two different sites, with different MRI acquisition protocols, including a different magnetic field strength, and lesion outlining protocols. The fact that GM quantification using NNI co-registered lesion masks is accurate across all images is an initial demonstration of the robustness of this approach. It suggests that the NNI registered lesion masks could also be used for lesion filling in multi-center studies, but more research on larger sample sizes is needed to confirm this.
The gold-standard lesion masks were manually outlined on 3DT1 images by adjusting the contours of the 2D dual-echo lesion masks after registering them to the 3DT1 images, and were not primarily drawn on the 3DT1 images. Our aim was to include the same lesions in the gold-standard masks as in the registered mask, which allowed the comparison to be fair. Aiming for a practical and easy to use solution for lesion-filling we have registered the 2D dual-echo lesion masks “as-is”, so no specific correction has been made for regional DGM and cortical lesions. It cannot be excluded that these lesions would influence the registration and lesion-filling as well as the segmentation after lesion-filling, however we did not see any difference in the DGM volumes before and after lesion-filling, and we were also able to identify the NNI registration method as being similar to gold-standard. Future studies should also investigate the influence of lesion location on lesion-filling.
5. Conclusion
Lesion-filling with MS lesion masks outlined on PDT2 images and co-registered to 3DT1 images using nearest neighbor interpolation yields accurate GM atrophy quantification in MS. The proposed approach combines the high resolution of 3DT1 for atrophy quantification, and the time and cost efficiency of lesion outlining on 2D images.
Disclosures
Veronica Popescu was supported by the MAGNIMS/ECTRIMS Fellowship 2009 and is currently supported by the Dutch MS Research Foundation grant 10-718MS.
The MS Center Amsterdam is funded by the Dutch MS Research Foundation program grant 98-358, 02-358b, 05-358c, 09-358d. D. T. Chard has received research support from the MS Society of Great Britain and Northern Ireland, and the UCLH/UCL NIHR Biomedical Research Centre.
Acknowledgements and conflict of interest
V. Popescu is currently supported by grant 10-718 of the Dutch MS Research Foundation.
N. C. G. Ran has nothing to disclose.
F. Barkhof serves on the editorial boards of Brain, European Radiology, the Journal of Neurology, Neurosurgery & Psychiatry, the Journal of Neurology, Multiple Sclerosis and Neuroradiology and serves as a consultant for Bayer-Shering Pharma, Sanofi-Aventis, Biogen-Idec, UCB, Merck-Serono, Novartis and Roche.
D. T. has received honoraria from Serono Symposia International Foundation, Bayer and Teva for faculty-led education work, Teva for advisory board work, and holds stock in GlaxoSmithKline.
C. A. Wheeler-Kingshott has nothing to disclose.
H. Vrenken receives research support from the Dutch MS Research Foundation, grant numbers 05-358c, 09-358d and 10-718, has performed sponsored contract research projects for Pfizer, Novartis and Merck-Serono, and has received speaker's honorarium from Novartis (The Novartis Innovation Exchange Lounge, ECTRIMS 2011).
The MS Center Amsterdam is funded by the Dutch MS Research Foundation program grant 98-358, 02-358b, 05-358c, 09-358d.
The following are the supplementary data related to this article.
Grey (GM) and white matter (WM) volumes (mm3) per lesion mask version/type using LEAP as lesion-filling method and FSL-lesion_filling. The data are expressed as median (IQR). NNI = nearest neighbor co-registered lesion masks. TLI = trilinearly co-registered lesion masks.
FSL-FIRST volumes (mm3) for LEAP and FSL-lesion_filling. The data are expressed as median (IQR) of the average of the bilateral structures. NNI = nearest neighbor co-registered lesion masks. TLI = trilinearly co-registered lesion masks.
Supplementary data to this article can be found online at http://dx.doi.org/10.1016/j.nicl.2014.01.004.
Footnotes
This is an open-access article distributed under the terms of the Creative Commons Attribution-NonCommercial-No Derivative Works License, which permits non-commercial use, distribution, and reproduction in any medium, provided the original author and source are credited.
References
- Battaglini M., Jenkinson M., De Stefano N. Evaluating and reducing the impact of white matter lesions on brain volume measurements. Hum. Brain Mapp. 2012;33(9):2062–2071. doi: 10.1002/hbm.21344. [DOI] [PMC free article] [PubMed] [Google Scholar]
- Benedict R.H. Regional lobar atrophy predicts memory impairment in multiple sclerosis. AJNR Am. J. Neuroradiol. 2005;26(7):1824–1831. [PMC free article] [PubMed] [Google Scholar]
- Chard D.T. Reducing the impact of white matter lesions on automated measures of brain gray and white matter volumes. J. Magn. Reson. Imaging. 2010;32(1):223–228. doi: 10.1002/jmri.22214. [DOI] [PubMed] [Google Scholar]
- De Stefano N., Battaglini M., Smith S.M. Measuring brain atrophy in multiple sclerosis. J. Neuroimaging. 2007;17(Suppl. 1):10S–15S. doi: 10.1111/j.1552-6569.2007.00130.x. [DOI] [PubMed] [Google Scholar]
- Fisher E. Gray matter atrophy in multiple sclerosis: a longitudinal study. Ann. Neurol. 2008;64(3):255–265. doi: 10.1002/ana.21436. [DOI] [PubMed] [Google Scholar]
- Garcia-Lorenzo D. Review of automatic segmentation methods of multiple sclerosis white matter lesions on conventional magnetic resonance imaging. Med. Image Anal. 2013;17(1):1–18. doi: 10.1016/j.media.2012.09.004. [DOI] [PubMed] [Google Scholar]
- Gelineau-Morel R. The effect of hypointense white matter lesions on automated gray matter segmentation in multiple sclerosis. Hum. Brain Mapp. 2012;33(12):2802–2814. doi: 10.1002/hbm.21402. [DOI] [PMC free article] [PubMed] [Google Scholar]
- Jenkinson M. Improved optimization for the robust and accurate linear registration and motion correction of brain images. Neuroimage. 2002;17(2):825–841. doi: 10.1016/s1053-8119(02)91132-8. [DOI] [PubMed] [Google Scholar]
- Llado X. Automated detection of multiple sclerosis lesions in serial brain MRI. Neuroradiology. 2012;54(8):787–807. doi: 10.1007/s00234-011-0992-6. [DOI] [PubMed] [Google Scholar]
- Miller D.H. Measurement of atrophy in multiple sclerosis: pathological basis, methodological aspects and clinical relevance. Brain. 2002;125(Pt 8):1676–1695. doi: 10.1093/brain/awf177. [DOI] [PubMed] [Google Scholar]
- Minneboo A. Predicting short-term disability progression in early multiple sclerosis: added value of MRI parameters. J. Neurol. Neurosurg. Psychiatry. 2008;79(8):917–923. doi: 10.1136/jnnp.2007.124123. [DOI] [PubMed] [Google Scholar]
- Mortazavi D., Kouzani A.Z., Soltanian-Zadeh H. Segmentation of multiple sclerosis lesions in MR images: a review. Neuroradiology. 2012;54(4):299–320. doi: 10.1007/s00234-011-0886-7. [DOI] [PubMed] [Google Scholar]
- Nakamura K., Fisher E. Segmentation of brain magnetic resonance images for measurement of gray matter atrophy in multiple sclerosis patients. Neuroimage. 2009;44(3):769–776. doi: 10.1016/j.neuroimage.2008.09.059. [DOI] [PMC free article] [PubMed] [Google Scholar]
- Patenaude B. A Bayesian model of shape and appearance for subcortical brain segmentation. Neuroimage. 2011;56(3):907–922. doi: 10.1016/j.neuroimage.2011.02.046. [DOI] [PMC free article] [PubMed] [Google Scholar]
- Popescu V. Optimizing parameter choice for FSL-Brain Extraction Tool (BET) on 3D T1 images in multiple sclerosis. Neuroimage. 2012;61(4):1484–1494. doi: 10.1016/j.neuroimage.2012.03.074. [DOI] [PubMed] [Google Scholar]
- Sanfilipo M.P. The relationship between whole brain volume and disability in multiple sclerosis: a comparison of normalized gray vs. white matter with misclassification correction. Neuroimage. 2005;26(4):1068–1077. doi: 10.1016/j.neuroimage.2005.03.008. [DOI] [PubMed] [Google Scholar]
- Sdika M., Pelletier D. Nonrigid registration of multiple sclerosis brain images using lesion inpainting for morphometry or lesion mapping. Hum. Brain Mapp. 2009;30(4):1060–1067. doi: 10.1002/hbm.20566. [DOI] [PMC free article] [PubMed] [Google Scholar]
- Sled J. Department of Biomedical Engineering. McGill University; Montreal: 1997. A non-parametric method for automatic correction of intensity non-uniformity in MRI data; p. 99. [Google Scholar]
- Smith S.M. Fast robust automated brain extraction. Hum. Brain Mapp. 2002;17(3):143–155. doi: 10.1002/hbm.10062. [DOI] [PMC free article] [PubMed] [Google Scholar]
- Smith S.M. Accurate, robust, and automated longitudinal and cross-sectional brain change analysis. Neuroimage. 2002;17(1):479–489. doi: 10.1006/nimg.2002.1040. [DOI] [PubMed] [Google Scholar]
- Smith S.M. Advances in functional and structural MR image analysis and implementation as FSL. Neuroimage. 2004;23(Suppl. 1):S208–S219. doi: 10.1016/j.neuroimage.2004.07.051. [DOI] [PubMed] [Google Scholar]
Associated Data
This section collects any data citations, data availability statements, or supplementary materials included in this article.
Supplementary Materials
Grey (GM) and white matter (WM) volumes (mm3) per lesion mask version/type using LEAP as lesion-filling method and FSL-lesion_filling. The data are expressed as median (IQR). NNI = nearest neighbor co-registered lesion masks. TLI = trilinearly co-registered lesion masks.
FSL-FIRST volumes (mm3) for LEAP and FSL-lesion_filling. The data are expressed as median (IQR) of the average of the bilateral structures. NNI = nearest neighbor co-registered lesion masks. TLI = trilinearly co-registered lesion masks.