

Abstract
Acetylcholine-esterase (AchE) inhibitors are one of the most potent drug molecules against Alzheimer's disease (AD). But, patients treated with current AchE inhibitors often experience severe side effects. Quercetin is a plant flavonoid compound which can act as AchE inhibitor and it may be a better alternative to current AchE inhibitors in terms of effectiveness with no or fewer side effects.
Aims
The aim of the study was to compare quercetin with conventional AchE inhibitors to search for a better drug candidate.
Methods and materials
Physico-chemical properties of conventional drugs and quercetin were predicted using bioinformatics tools. Molecular docking of these compounds on the active site of AchE was performed using AutoDock and comparative analysis was performed. Later, modification on the basic structure of quercetin with different functional groups was done to perform QSAR analysis.
Result and discussion
Quercetin showed a similar drug likeness score to the conventional drugs. The binding strength for quercetin in the active site of the enzyme was −8.8 kcal/mol, which was considerably higher than binding scores for some of the drugs such as donepezil (binding score −7.9 kcal/mol). Fifteen hydrogen bonds were predicted between quercetin and the enzyme whereas conventional drugs had fewer or even no hydrogen bonds. It implies that quercetin can act as a better inhibitor than conventional drugs. To find out even better inhibitor, similar structures of quercetin were searched through SIMCOMP database and a methylation in the 4-OH position of the molecule showed better binding affinity than parent quercetin. Quantitative structure activity relationship study indicated that O-4 methylation was specifically responsible for better affinity.
Conclusion
This in silico study has conclusively predicted the superiority of the natural compound quercetin over the conventional drugs as AchE inhibitor and it sets the need for further in-vitro study of this compound in future.
Keywords: Alzheimer's disease, Molecular docking, In silico, Quercetin, Cholinesterase inhibitors
1. Introduction
Alzheimer's disease (AD) impacts the part of brain that controls cognitive function affecting the memory, reasoning capabilities, learning abilities and language capabilities. Moreover, it can also bring non-cognitive disabilities into the patients like depression, agitation, hallucinations and delusions. According to a recent estimate, more than 35 million people are affected by Alzheimer's disease worldwide1 while another study estimated 4.5 million U.S. cases in the year 2000 alone and predicted that the number will rise 3-fold to 13.2 million by 2050. Despite the genetic predisposition to AD, several factors including diabetes, obesity etc. has been associated with Alzheimer's disease.2–5 Old age has been considered as one of the major risk factors for AD and the probability of being affected by it doubles every 5 years after mid-seventies and the rate is even higher for the people at an age of 85.6,7
Molecular research suggests that the main cause of AD is the genesis and uncanny deposition of abnormal proteins (senile plaques and neuro-fibrillary tangles) in aging brain resulting in oxidative and inflammatory damage and finally leading to energy failure and extensive neuronal loss.8 There is also a confirmed link between AD and cholinergic signaling of the brain in abundant available evidences.9 Degeneration of nuclei in the basal forebrain results in a loss of excitatory cholinergic transmission to the cerebral cortex and this is thought to contribute significantly to the cognitive deficits present in Alzheimer's disease.10
Depletion of the neurotransmitter acetylcholine in AD due to reduced number of acetylcholine receptor and increased activity of acetylcholine-esterase are considered as prominent features of AD. In Alzheimer's disease, cortical cholinergic innervations are reduced leading to shifting of tau protein to its hyper-phosphorylated form. Once the tau is hyper-phosphorylated, it reduces secretion of soluble APP (Amyloid Precursor Protein) and thus increases the production of β-amyloid protein. Increased accumulation of these proteins leads to form plaque that causes the toxic effect to the neuronal cell leading to its severe damage or death if this situation persists.11–13
Different AChE inhibitors are highly prescribed as medicine because they serve to restore neurotransmission by blocking the action of acetylcholine-esterase. This action cleaves endogenously produced acetylcholine in synaptic clefts.14 These inhibitors subsequently play a role in the reduction of phosphorylation of tau protein causing a reduction of amyloid plaque deposition. Moreover, these drugs can show anti-oxidant properties which impede the lesion formations of toxic substances and thus bring a pause in the promotion of Alzheimer's disease.15
Currently acetylcholine-esterase inhibitors such as tacrine, galantamine, rivastigmine and donepezil are widely used as conventional drugs for the therapeutic purpose of AD and have been found to improve cognitive function in AD patients.16–18 But these AChE inhibitors are known to have side effects such as hepatotoxicity and cardiovascular disease.19 Because of these side effects along with other shortcoming such as short life of the inhibitors and poor binding with the acetylcholine-esterase, the search for better acetylcholine-esterase inhibitors is still going on.
A recent study reports the isolation of a biologically active acetylcholine-esterase inhibitors from medicinal plants named quercetin from its natural source Agrimonia pilosa.20 Quercetin, a major flavonoid under the class of flavonols, is found in many foods like cauliflower, nuts, tea, apples, berries, and beverages. This natural flavonoid compound has the anti-oxidant property similar to other chemically synthesized acetylcholine-esterase inhibitors and thereby it has the potential to be a good alternative candidate for Alzheimer's disease treatment through coline-estarase inhibition. In present study, we have performed an in silico comparison between the natural compound quercetin and the widely used conventional drugs (tacrine, galantamine, rivastigmine and donepezil) as an acetylcholine-esterase inhibitor. We have also performed an in silico quantitative structure activity relationship study of quercetin to investigate the functional groups that may help to design a better inhibitor of acetylcholine-esterase. To the best of our knowledge, this is the first report comparing a natural acetylcholine-esterase inhibitor with conventional inhibitors widely used.
2. Materials and methods
2.1. Retrieval and construction of dataset
2.1.1. Receptor protein and ligand
The three dimensional structure of Human Acetylcholine-esterase complex with FASCICULIN-II (PDB ID 1B41) was obtained from RCSB Protein Databank (http://www.rcsb.org/pdb/home/home.do). PDB structure of only Acetyl-cholinesterase was obtained using Pymol21 after removing the atomic coordinates of FASCICULIN-II. The structure was visualized in Raswin and UCSF-Chimera 1.6.1 UCSF.22,23 Quercetin was chosen as ligand and its structure was firstly retrieved as SDF format from PubChem compound (Table 1) followed by conversion into PDB format to perform molecular docking studies.
Table 1.
List of conventional drugs and natural inhibitor along with their identity and 2D conformer.
| Conventional drug/natural inhibitor name | PubChem compound CID | 2D conformer |
|---|---|---|
| Donepezil | 3152 |  |
| Tacrine | 1935 |  |
| Galantamine | 908828 |  |
| Rivastigmine | 77991 |  |
| Quercetin | 5280343 |  |
2.1.2. Conventional acetylcholine-esterase inhibitors
For detailed general information about the drugs, Drug Bank Database (www.drugbank.ca) was explored by drug names. For further analysis, 3D structure of the drugs was obtained from PubChem (http://pubchem.ncbi.nlm.nih.gov) database as SDF format which was later converted to pdb format by Open Babel 2.3.1.24 The structures of the conventional drugs along with their PDB IDs are given in Table 1.
2.2. Molecular properties and drug likeness
Molecular properties and drug likeness of each selected compound was analyzed by Molinspiration WebME Editor 3.81 (http://molinspiration.com:9080/webme/webme.html) and Molsoft L.L.C.: Drug-Likeness and molecular property prediction (molsoft.com/mprop/) which predicts the molecular properties from the given valid structures and based on these molecular properties it gives an overall drug likeness score.
2.3. Molecular docking and visualization
Docking studies with conventional inhibitory drugs and quercetin against Acetylcholine esterase were done by AutoDock. Protein and ligands were analyzed and modified for docking purpose using AutoDock Tools which is incorporated in the MGL tools (http://mgltools.scripps.edu). The grid box size was set at 44, 60, and 72 A° towards X, Y and Z axis respectively to include all the amino acid residues present in the rigid acetyl-cholinesterase protein for docking study. Values of X, Y, and Z center were set at 116.077, 103.442 and −143.125 A° respectively and the spacing was 1.000 A° during AutoDock analysis. AutoDock Vina reads the protein and ligand as PDBQT and performs the actual docking on the basis of configuration prepared by AutoDock Tools.25 The output result which was also in PDBQT format was later converted to PDB by using Open Babel 2.3.1 tool. The output files for every conventional drug along with quercetin were visualized by Pymol Molecular Visualization Software. The best conformer for each inhibitor was selected on the basis of lower free energy and lower root mean square value.
2.4. Study of molecular interactions
Molecular interactions, such as like the number of hydrogen bonds, between the inhibitors and acetyl-cholinesterase were analyzed by Pymol Molecular Visualization system. During these analyses, the cutoff distance of hydrogen bond was set at 3.2.
2.5. QSAR analysis
Similar compounds of Quercetin were searched in the SIMCOMP database.26 Among the retrieved compounds, those having similarity score in a range 0.4–1.0 were chosen and their structures were downloaded in SDF format from the PubChem database using their corresponding IDs. Converting these SDF files to PDB, for every compound chosen from SIMCOMP database, a similar molecular docking study was performed as stated above. The result is summarized in Supplementary Table 1. The single modified compound (see Supplementary Table 1) showing better affinity towards acetylcholine-esterase than quercetin was chosen for further analysis. To identify whether the better binding affinity was specific for modification to special group or it was just a result of any other group interacting in that position, a variety of quercetin structures with groups other than that particular group to the specific atom were prepared. Chlorination, bromination, sulfation and carboxylation were some of the modifications done to the structure. The structures were then made 3D with the help of molecular drawing tools ChemSketch27 and docking studies were performed afterward.
3. Results and discussion
3.1. Comparative analysis of molecular properties reveals drug like property of quercetin
To compare the binding affinity of quercetin with conventional drugs to human acetylcholine esterase enzyme (Fig. 1), the atomic co-ordinates of the 4 different commercial drugs along with the quercetin were retrieved from the PubChem database. The structural information of these compounds is summarized in Table 1. Molecular properties of quercetin in comparison to the conventional drugs, predicted by Molinspiration WebME Editor Tool (Table 2), show that the number of hydrogen bond donors and acceptors in quercetin outnumbers that of all the conventional drugs (tacrine, galantamine, donepezil and rivastigmine). Specifically quercetin has 7 hydrogen bond acceptors and 5 hydrogen bond donors (Table 2) in its structure according to this prediction. Besides the status of hydrogen bonds, it has a molecular weight of 302.238 and a log P value 1.683 (Table 2) which imply that similar to other conventional drugs, quercetin does not violate the rule of Lipinski's “rule of five”28 which is an important criterion to predict a compound as a potential drug molecule to act in the biological system. Lipinski's “rule of five” molecules having molecular weight > 500, log P > 5, hydrogen bond acceptors >10 and hydrogen bond donors > 5 show poor absorption or permeation rate. The volume and molecular weight of quercetin is moderate compared to the conventional drugs used (Table 2). But interestingly it has a polar surface area of 131.351 which is higher than any other conventional drugs used. A detail of other properties like octanol–water partition coefficient, number of non-hydrogen atoms, and the number of rotatable bonds is summarized in Table 2.
Fig. 1.
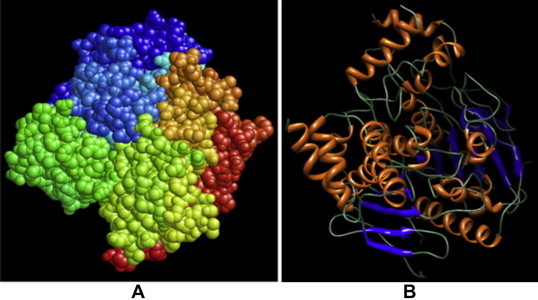
Structural representation of acetylcholine-esterase. (A) Space-fill representation of 3D structure of acetylcholine-esterase. Different groups on the surface of the protein are highlighted by different color combinations and (B) Helix-loop-helix structural representation of 3-D model of acetylcholine-esterase. α-helices (blue) and β pleated sheets (light yellow) are connected by loops. These images were generated by using Pymol and UCSF-CHIMERA respectively.
Table 2.
Molecular properties of conventional drugs and quercetin.
| Property | Details | Value |
||||
|---|---|---|---|---|---|---|
| Rivastigmine | Donepezil | Galantamine | Tacrine | Quercetin | ||
| log P | Octanol-water partition coefficient | 2.276 | 4.1 | 1.987 | 3.05 | 1.683 |
| TPSA | Polar surface area | 32.781 | 38.777 | 41.934 | 38.915 | 131.351 |
| N atoms | Number of non-hydrogen atoms | 18.0 | 28.0 | 22.0 | 15.0 | 22.0 |
| MW | Molecular weight | 250.342 | 379.5 | 301.386 | 198.269 | 302.238 |
| n ON | Number of hydrogen-bond acceptors (O and N atoms) | 4 | 4 | 4 | 2 | 7 |
| n OHNH | Number of hydrogen-bond donors (OH and NH groups) | 0 | 0 | 1 | 2 | 5 |
| n violations | Number of rule of 5 violations | 0 | 0 | 0 | 0 | 0 |
| n rotb | Number of rotatable bonds | 5 | 6 | 1 | 0 | 1 |
| Volume | Molecular volume | 254.014 | 367.895 | 284.431 | 191.533 | 240.084 |
3.2. High drug likeness score of quercetin
Overall drug likeliness score for drug molecules constitute a distribution that is skewed to right and peaks in the range of 0.8–1.2 on a drug likeliness score.29–33 In this study, drug likeness score for all of the conventional drugs was predicted by Molsoft L.L.C.: Drug-Likeness and molecular property prediction tool. The result is summarized in Table 3. Interestingly, the natural compound quercetin has the highest drug likeness score (1.0) while the FDA approved drug tacrine has a value of 0.97 according to the prediction (Table 3).
Table 3.
Drug likeness score for different inhibitors.
| Name of inhibitors | Drug likeness score |
|---|---|
| Donepezil | 0.91 |
| Galantamine | 0.46 |
| Rivastigmine | 0.97 |
| Tacrine | 0.97 |
| Quercetin | 1.00 |
3.3. Molecular docking shows higher binding affinity of quercetin
Natural compound quercetin along with other conventional inhibitors of acetylcholine-esterase was allowed to bind at the active site using same parameter as mentioned in method section 2.3. The binding score of these compounds is summarized in Table 4. Quercetin has higher binding score than the conventional drugs when allowed to bind at the same pocket of the acetylcholine-esterase as conventional drugs. The higher binding energy (−8.8 kcal/mol) of quercetin at the active site of acetylcholine-esterase potentiates its ability to act as an inhibitor against this protein. Tacrine and galantamine show a closer score (−8.6 kcal/mol each) to quercetin in case of binding at the active site of acetylcholine-esterase, while the conventional drugs donepezil and rivastigmine show lower binding energy of −7.6 kcal/mol and −8.0 kcal/mol respectively. The binding of the conventional drugs and the natural compound quercetin on the surface of the acetylcholine-esterase is illustrated in Fig. 2. The surface of the protein is colored differently for each of the inhibitor to distinguish one from another. This figure shows that all of the docked inhibitors (including quercetin) bind at the same active site pocket of acetylcholine-esterase.
Table 4.
Binding affinity for different inhibitors calculated when they were docked with acetylcholine-esterase.
| Name of inhibitors | Affinity (Kcal/mol) |
|---|---|
| Donepezil | −7.9 |
| Galantamine | −8.0 |
| Rivastigmine | −8.6 |
| Tacrine | −8.6 |
| Quercetin | −8.8 |
Fig. 2.
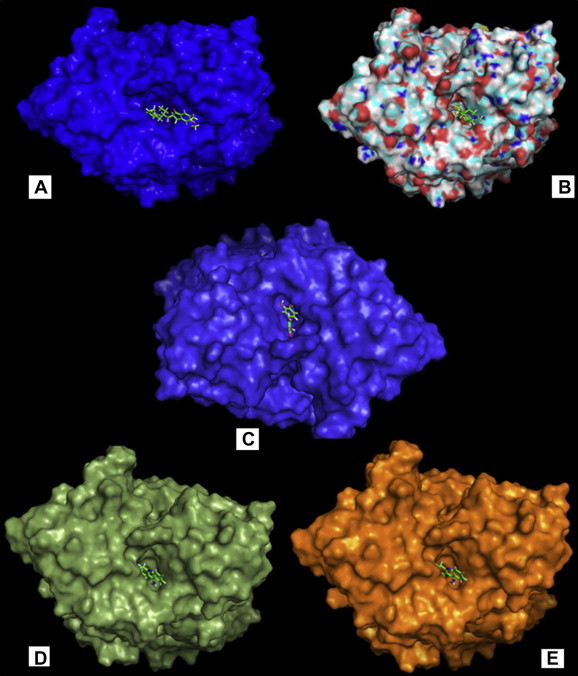
Molecular docking of acetyl-cholinesterase inhibitors (A–E) represent the binding of donepezil, galantamine, quercetin, rivastigmine, and tacrine respectively in the same pocket on the surface of acetyl-cholinesterase protein. The surface of the protein is highlighted by different colors for each case.
3.4. Molecular interactions between acetylcholine-esterase and docked ligands
While binding at the active site, a number of hydrogen bonds between different atoms of acetylcholine-esterase and the inhibitors participate to interact with each other to make the binding stronger. But an exception is found for donepezil that has no hydrogen bond to interact with the acetylcholine-esterase. Moreover, tacrine and rivastigmine have only one hydrogen bond and they both interact with Tyr 124 amino acid residue of acetylcholine-esterase. Galantamine forms a moderate number of hydrogen bonds with acetylcholine-esterase that involves Tyr 124, Ser 293, Tyr 341 residues of this protein (Fig. 3). While the conventional drugs form fewer to moderate number of hydrogen bonds with active site residues of acetylcholine-esterase, the natural compound quercetin forms a higher number of hydrogen bonds.
Fig. 3.
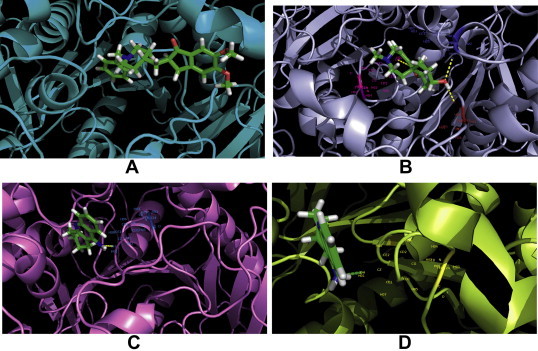
Docked chemical compounds in the acetyl-cholinesterase pocket. (A) Acetylcholine-esterase-donepezil bound form. No hydrogen bond formed in the hydrogen bond parameter used. (B) Galantamine-acetylcholine-esterase complex. Yellow dashes indicate hydrogen bonds formed between the enzyme and the drug molecule. Amino acid residues at Tyr 124, Tyr 341 and Ser 293 of acetylcholine-esterase participate in these intermolecular interactions and they are labeled along with their atoms. (C) Rivastigmine-acetylcholine-esterase complex. Yellow dash indicates the hydrogen bond between the drug molecule and Tyr 124 residue of acetylcholine-esterase. All the atoms of Tyr 124 are labeled in the diagram. (D) Tacrine-acetylcholine-esterase complex. Green dash indicates a single hydrogen bond between the drug compound and enzyme. The distance of the hydrogen bond measured is 3.0.
When the same parameter used for other inhibitors, quercetin forms ten hydrogen bonds with active site residues of the protein (Fig. 4). The hydrogen bonds formed by quercetin involve the same amino acid residues Tyr 124, Ser 293 and Tyr 341 as for conventional drugs (galantamine, tacrine, rivastigmine). Moreover, different atoms of other amino acid residues such as Phe 295, Arg 296, Tyr 337 and Tyr 341 participate to form the hydrogen bonds. A detail about the hydrogen bond acceptors and donors and length of these hydrogen bonds for all the inhibitors is summarized in Table 5. Interactive views (Figs. 3 and 4) at the active site of the acetylcholine esterase for different inhibitors show the hydrogen bonds (dashed line) binding to different atoms of the amino acid residues in the active site (highlighted with different colors) of the protein. The parameter used (see the methods and material) for hydrogen bond visualization was same for all the inhibitors.
Fig. 4.
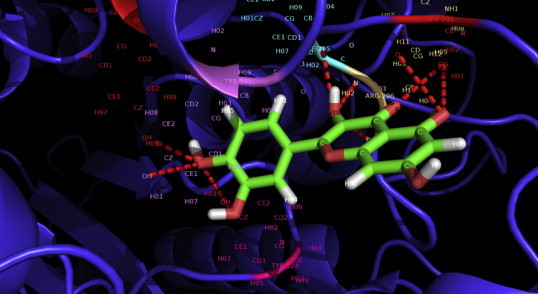
Deep view at the Quercetin-acetylcholine-esterase complex. Different atoms of the quercetin structure participate in a number of hydrogen bonds (highlighted in red dashes) formed with acetylcholine-esterase which have been labeled. Tyr 124, Ser 293, Phe 295, Arg 296 and Tyr 341 are the participated amino acid residues of the enzyme to form ten hydrogen bonds which outnumber the interactions for other (e.g. tacrine, donepezil, galantamine, and rivastigmine) drug–enzyme complex. This figure clearly implies the strong binding of Quercetin in the active pocket of acetylcholine-esterase. This image has been developed using Pymol Molecular Visualization system.
Table 5.
Detail of molecular interactions of different inhibitors with acetylcholine-esterase.
| Ligand–receptor complex | No. of hydrogen bonds | Hydrogen bond donor | Hydrogen bond acceptor | Length of hydrogen bond (A°) |
|---|---|---|---|---|
| Quercetin–acetylcholine-esterase | 10 | Quercetin: 1: O | Acetyl-cholinesterase: A:Tyr 124: OH | 2.8 |
| Quercetin: 1: O | Acetyl-cholinesterase: A:Tyr 341: OH | 3.2 | ||
| Quercetin: 1: O | Acetyl-cholinesterase: A:Tyr 337: HO1 | 2.7 | ||
| Quercetin: 1: H | Acetyl-cholinesterase: A: Phe 295: N | 3.0 | ||
| Quercetin: 1: O | Acetyl-cholinesterase: A: Arg 296: N | 2.8 | ||
| Quercetin: 1: O | Acetyl-cholinesterase: A: Ser 293: OG | 2.7 | ||
| Acetyl-cholinesterase: A: Tyr 124: OH | Quercetin: 1: O | 2.9 | ||
| Acetyl-cholinesterase: A: Ser 293: OG | Quercetin: 1: O | 2.9 | ||
| Acetyl-cholinesterase: A: Arg 296: O | Quercetin: 1: O | 2.7 | ||
| Quercetin: 1: H | Acetyl-cholinesterase: A: Ser 293: OG | 2.9 | ||
| Rivastigmine–acetylcholine-esterase | 1 | Rivastigmine: 1: O | Acetyl-cholinesterase: A:Tyr 124: OH | 3.0 |
| Tacrine–acetylcholine-esterase | 1 | Tacrine: 1: O | Acetyl-cholinesterase: A:Tyr 124: OH | 3.0 |
| Galantamine–acetylcholine-esterase | 3 | Acetyl-cholinesterase: A:Tyr 124: OH | Galantamine: 1: O | 3.0 |
| Galantamine: 1: OH | Acetyl-cholinesterase: A:Tyr 341: O | 2.8 | ||
| Galantamine: 1: OH | Acetyl-cholinesterase: A: Ser 293: O | 3.0 | ||
| Donepezil–acetylcholine-esterase | 0 |
3.5. Quantitative structural activity relationships
The structures retrieved on the basis of similarity score via SIMCOMP search tool were all docked to the target molecule. The grid/search space for these molecules to perform molecular docking was kept the same as for the inhibitors mentioned earlier (see methods and materials). The name of the retrieved structures, their similarity score and binding score at the active site of acetylcholine-esterase is summarized in Supplementary Table 1. Among all of the compounds selected for docking at the active site of acetylcholine-esterase, azaleatin (better known as 4-OH methylated form of quercetin) shows a higher binding energy (−9.0 kcal/mol) than quercetin. To identify whether the better binding affinity was specific for methylation or it was just a result of any other group interacting in that position, a variety of quercetin structure with groups other than methyl attached to the O-4 atom were prepared. Chlorination, bromination, sulfation and carboxylation were some of the modifications done to the structure. The structures were then made 3D with the help of molecular drawing tools ChemSketch.
To carry out a Quantitative Structural Activity Relationships (QSAR) on the basis of binding score we had to set a reference structure for comparing binding scores. Among conventional drugs, tacrine was chosen as the reference molecule. Different groups were added to tacrine structure just as in for quercetin. For both conventional drug and quercetin the binding value for different groups were normalized by dividing the values with that of the binding value of the molecule without any groups added.
A scatter plot of the logarithm of normalized binding values of quercetin and tacrine was generated (Fig. 5). The expected result for the scatter plot was a liner graph with methylation showing optimum scores. The results found in the scatter plot meet the expectation to a good extent.
Fig. 5.
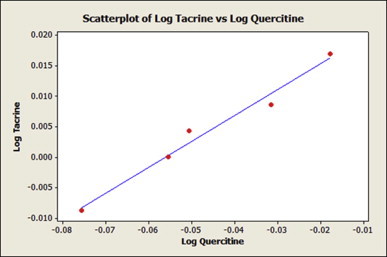
Scatter plot of Log of different group attached Quercetin versus corresponding Log of the identical group attached Tacrine. The scatter plot shows a liner pattern.
The scatter plot reveals the correlation between the values from two candidates was positive. The modifications caused similar changes to the binding values to both the parent candidates (Fig. 5). From the scores in Table 6 it is evident that the distant most point from the origin belongs to methylated structure. This predicts that the methylated form of quercetin can improve this molecule as drug molecule.
Table 6.
Modifying groups for tacrine and quercetin and their normalized log values.
| Modifying group | Log of tacrine values | Log of quercetin value |
|---|---|---|
| –Br | 0.0086002 | −0.0315171 |
| –Cl | 0.0043214 | −0.0506100 |
| –CH3 | 0.0170333 | −0.0177288 |
| –NO2 | −0.0087739 | −0.0757207 |
| –SO3H | 0.0000001 | −0.0555173 |
4. Conclusion
In overall analysis, docking techniques have predicted quercetin to act as a better natural drug molecule than current commercial ones. Quercetin fulfills all the natural prerequisites of a drug molecule- good binding affinity with the receptor, good absorptivity and low toxicity. The study employs docking technique to reaffirm the ability of the molecule as a drug and implies possible chemical modification in quercetin structure- a methylation at 4-OH position – to further improve the binding affinity. Although due to more hydrogen bond with the target molecule our structure was more stable, more hydrogen atoms add to the polarity (lower log P, more Hydrogen bond atom and greater polar surface area) of the structure and hence it is very critical to check the excretion and intrusion property inside the cell. This can only be answered by in-vitro ADMETox experimentation. Our in silico study has conclusively predicted the superiority of the natural compound quercetin over the conventional drugs as AchE inhibitor and it sets the need for further in-vitro study of this compound in future.
Contributor Information
Md. Rezaul Islam, Email: rezaul.nayeem@gmail.com.
Sajib Chakraborty, Email: sajib@univdhaka.edu.
Appendix A. Supplementary data
The following is the supplementary data related to this article:
Conflicts of interest
All authors have none to declare.
References
- 1.Querfurth H.W., LaFerla F.M. Mechanisms of disease. N Engl J Med. 2010;362:329–344. doi: 10.1056/NEJMra0909142. [DOI] [PubMed] [Google Scholar]
- 2.Martins I.J., Hone E., Foster J.K. Apolipoprotein E, cholesterol metabolism, diabetes, and the convergence of risk factors for Alzheimer's disease and cardiovascular disease. Mol Psychiatry. 2006;11:721–736. doi: 10.1038/sj.mp.4001854. [DOI] [PubMed] [Google Scholar]
- 3.Priyadarshini M., Kamal M.A., Greig N.H. Alzheimer's disease and type 2 diabetes: exploring the association to obesity and tyrosine Hydroxylase. CNS Neurol Disord Drug Targets. 2012;11:482–489. doi: 10.2174/187152712800792767. (Formerly Current Drug Targets. [DOI] [PMC free article] [PubMed] [Google Scholar]
- 4.Fewlass D.C., Noboa K., Pi-Sunyer F.X., Johnston J.M., Yan S.D., Tezapsidis N. Obesity-related leptin regulates Alzheimer’s Aβ. FASEB J. 2004;18:1870–1878. doi: 10.1096/fj.04-2572com. [DOI] [PubMed] [Google Scholar]
- 5.Profenno L.A., Porsteinsson A.P., Faraone S.V. Meta-analysis of Alzheimer's disease risk with obesity, diabetes, and related disorders. Biol Psychiatry. 2010;67:505–512. doi: 10.1016/j.biopsych.2009.02.013. [DOI] [PubMed] [Google Scholar]
- 6.Wilson R.S., Arnold S.E., Schneider J.A., Kelly J.F., Tang Y., Bennett D.A. Chronic psychological distress and risk of Alzheimer’s disease in old age. Neuroepidemiology. 2006;27:143–153. doi: 10.1159/000095761. [DOI] [PubMed] [Google Scholar]
- 7.2012 Alzheimer’s disease facts and figures. Alzheimer's Dement. 2012;8:131–168. doi: 10.1016/j.jalz.2012.02.001. The Journal of The Alzheimer's Association. [DOI] [PubMed] [Google Scholar]
- 8.Gómez-Isla T., Hollister R., West H. Neuronal loss correlates with but exceeds neurofibrillary tangles in Alzheimer's disease. Ann Neurol. 1997;41:17–24. doi: 10.1002/ana.410410106. [DOI] [PubMed] [Google Scholar]
- 9.Buckingham S.D., Jones A.K., Brown L.A., Sattelle D.B. Nicotinic acetylcholine receptor signalling: roles in Alzheimer's disease and amyloid neuroprotection. Pharmacol Rev. 2009;61:39–61. doi: 10.1124/pr.108.000562. [DOI] [PMC free article] [PubMed] [Google Scholar]
- 10.Babic T. The cholinergic hypothesis of Alzheimer’s disease: a review of progress. J Neurol Neurosurg Psychiatr. 1999;67:558. doi: 10.1136/jnnp.67.4.558. [DOI] [PMC free article] [PubMed] [Google Scholar]
- 11.Schliebs R., Arendt T. The cholinergic system in aging and neuronal degeneration. Behav Brain Res. 2011;221:555. doi: 10.1016/j.bbr.2010.11.058. [DOI] [PubMed] [Google Scholar]
- 12.Butterfield D.A., Drake J., Pocernich C., Castegna A. Evidence of oxidative damage in Alzheimer's disease brain: central role for amyloid β-peptide. Trends Mol Med. 2001;7:548–554. doi: 10.1016/s1471-4914(01)02173-6. [DOI] [PubMed] [Google Scholar]
- 13.Meyer-Luehmann M., Spires-Jones T.L., Prada C. Rapid appearance and local toxicity of amyloid-β plaques in a mouse model of Alzheimer's disease. Nature. 2008;451:720–724. doi: 10.1038/nature06616. [DOI] [PMC free article] [PubMed] [Google Scholar]
- 14.Evans J.G., Wilcock G., Birks J. Evidence-based pharmacotherapy of Alzheimer's disease. Int J Neuropsychopharmacol. 2004;7:351–369. doi: 10.1017/S1461145704004444. [DOI] [PubMed] [Google Scholar]
- 15.Gilgun-Sherki Y., Melamed E., Offen D. Antioxidant treatment in Alzheimer's disease. J Mol Neurosci. 2003;21:1–11. doi: 10.1385/JMN:21:1:1. [DOI] [PubMed] [Google Scholar]
- 16.Aguglia E., Onor M.L., Saina M., Maso E. An open-label, comparative study of rivastigmine, donepezil and galantamine in a real-world setting. Curr Med Res Opin. 2004;20:1747–1752. doi: 10.1185/030079904X6273. [DOI] [PubMed] [Google Scholar]
- 17.Ritchie C.W., Ames D., Clayton T., Lai R. Metaanalysis of randomized trials of the efficacy and safety of donepezil, galantamine, and rivastigmine for the treatment of Alzheimer disease. Am J Geriatr Psychiatry. 2004;12:358. doi: 10.1176/appi.ajgp.12.4.358. [DOI] [PubMed] [Google Scholar]
- 18.Jeremy P.R., Rigby John, Adam C.H., Rowland Rosalind. Cardiovascular monitoring with acetylcholinesterase inhibitors: a clinical protocol. Adv Psychiatr Treat. 2007;13:178–184. [Google Scholar]
- 19.Kröger E., Berkers M., Carmichael P.H., Souverein P., van Marum R., Egberts T. Use of rivastigmine or galantamine and risk of adverse cardiac events: a database study from the Netherlands. Am J Geriatric Pharmacother. 2012;10:373–380. doi: 10.1016/j.amjopharm.2012.11.002. [DOI] [PubMed] [Google Scholar]
- 20.Jung M., Park M. Acetylcholinesterase inhibition by flavonoids from Agrimonia pilosa. Molecules. 2007;12:2130–2139. doi: 10.3390/12092130. [DOI] [PMC free article] [PubMed] [Google Scholar]
- 21.DeLano W.L. 2002. The PyMOL Molecular Graphics System. http://www.pymol.org/: DeLano Scientific. [Google Scholar]
- 22.Sayle R.A., Milner-White E.J. RASMOL: biomolecular graphics for all. Trends Biochem Sci. 1995;20:374. doi: 10.1016/s0968-0004(00)89080-5. [DOI] [PubMed] [Google Scholar]
- 23.Pettersen E.F., Goddard T.D., Huang C.C. UCSF Chimera—a visualization system for exploratory research and analysis. J Comput Chem. 2004;25:1605–1612. doi: 10.1002/jcc.20084. [DOI] [PubMed] [Google Scholar]
- 24.O'Boyle N.M., Banck M., James C.A. Open Babel: an open chemical toolbox. J Cheminformatics. 2011;3:1–14. doi: 10.1186/1758-2946-3-33. [DOI] [PMC free article] [PubMed] [Google Scholar]
- 25.Trott O., Olson A.J. AutoDock Vina: improving the speed and accuracy of docking with a new scoring function, efficient optimization, and multithreading. J Comput Chem. 2010;31:455–461. doi: 10.1002/jcc.21334. [DOI] [PMC free article] [PubMed] [Google Scholar]
- 26.Hattori M., Tanaka N., Kanehisa M., Goto S. SIMCOMP/SUBCOMP: chemical structure search servers for network analyses. Nucleic Acids Res. 2010;38(suppl 2):W652–W656. doi: 10.1093/nar/gkq367. [DOI] [PMC free article] [PubMed] [Google Scholar]
- 27.Fan Y., Cheng M., Cheng Y. The reformation in our organic chemistry classes caused by the excellent software ACD/ChemSketch [J] J Guangzhou Univ. 2002;6 (Natural Science Edition) [Google Scholar]
- 28.Lipinski C.A. Drug-like properties and the causes of poor solubility and poor permeability. J Pharmacol Toxicol Methods. 2000;44:235–249. doi: 10.1016/s1056-8719(00)00107-6. [DOI] [PubMed] [Google Scholar]
- 29.Egan W.J., Walters W.P., Murcko M.A. Guiding molecules towards drug-likeness. Curr Opin Drug Discov Devel. 2002;5:540–549. [PubMed] [Google Scholar]
- 30.Brüstle M., Beck B., Schindler T., King W., Mitchell T., Clark T. Descriptors, physical properties, and drug-likeness. J Med Chem. 2002;45:3345–3355. doi: 10.1021/jm011027b. [DOI] [PubMed] [Google Scholar]
- 31.Walters W.P., Murcko M.A. Prediction of 'drug-likeness'. Adv Drug Deliv Rev. 2002;54:255–271. doi: 10.1016/s0169-409x(02)00003-0. [DOI] [PubMed] [Google Scholar]
- 32.Clark D.E., Pickett S.D. Computational methods for the prediction of 'drug-likeness'. Drug Discov Today. 2000;5:49–58. doi: 10.1016/s1359-6446(99)01451-8. [DOI] [PubMed] [Google Scholar]
- 33.Müller K.R., Rätsch G., Sonnenburg S., Mika S., Grimm M., Heinrich N. Classifying 'drug-likeness' with kernel-based learning methods. J Chem Inf Model. 2005;45:249–253. doi: 10.1021/ci049737o. [DOI] [PubMed] [Google Scholar]
Associated Data
This section collects any data citations, data availability statements, or supplementary materials included in this article.