

Abstract
Epilepsy is a common neurological disorder affecting approximately 1% of the population. Mutations in voltage-gated sodium channels are responsible for several monogenic epilepsy syndromes. More than 800 mutations in the voltage-gated sodium channel SCN1A have been reported in patients with generalized epilepsy with febrile seizures plus and Dravet syndrome. Heterozygous loss-of-function mutations in SCN1A result in Dravet syndrome, a severe infant-onset epileptic encephalopathy characterized by intractable seizures, developmental delays and increased mortality. A common feature of monogenic epilepsies is variable expressivity among individuals with the same mutation, suggesting that genetic modifiers may influence clinical severity. Mice with heterozygous deletion of Scn1a (Scn1a+/−) model a number of Dravet syndrome features, including spontaneous seizures and premature lethality. Phenotype severity in Scn1a+/− mice is strongly dependent on strain background. On the 129S6/SvEvTac strain Scn1a+/− mice exhibit no overt phenotype, while on the (C57BL/6J × 129S6/SvEvTac)F1 strain Scn1a+/− mice exhibit spontaneous seizures and early lethality. To systematically identify loci that influence premature lethality in Scn1a+/− mice, we performed genome scans on reciprocal backcrosses. QTL mapping revealed modifier loci on mouse chromosomes 5, 7, 8 and 11. RNA-seq analysis of strain-dependent gene expression, regulation and coding sequence variation provided a list of potential functional candidate genes at each locus. Identification of modifier genes that influence survival in Scn1a+/− mice will improve our understanding of the pathophysiology of Dravet syndrome and may suggest novel therapeutic strategies for improved treatment of human patients.
Keywords: epilepsy, epileptic encephalopathy, seizures, Dravet syndrome, severe myoclonic epilepsy of infancy, voltage-gated ion channels, voltage-gated sodium channels, mouse model, RNA-seq, transcriptomics
Introduction
Mutations in voltage-gated sodium channels are responsible for a variety of epilepsy syndromes with varying degrees of clinical severity (Meisler and Kearney, 2005; Scheffer et al, 2008; Meisler et al, 2010). Over 800 patient mutations have been reported in SCN1A, which encodes the Nav1.1 channel protein. The phenotype most commonly associated with SCN1A mutation is Dravet syndrome, a severe infant-onset epileptic encephalopathy (Claes et al, 2009). Dravet syndrome usually begins between 6 and 18 months of age and is characterized by generalized clonic, tonic–clonic, or hemiclonic seizures, often precipitated by fever. Patients subsequently develop other afebrile seizure types, including myoclonic, atypical absence, or complex focal seizures. Development is normal prior to onset, but disease progression is accompanied by a decline of psychomotor and cognitive development (Dravet et al, 2005). Dravet syndrome patients have a significantly increased risk of mortality, with 15-20% mortality by 20 years of age. This is mainly attributed to prolonged status epilepticus in early childhood and sudden unexplained death in epilepsy (SUDEP) in adolescents and adults (Genton et al, 2011). In most Dravet syndrome patients, SCN1A mutations arise de novo and are not inherited. However, there are several cases of Dravet syndrome in which mutations were inherited from mildly affected parents, as well as individuals with de novo loss-of-function or truncation mutations that presented with milder phenotypes (Depienne et al. 2009;Depienne et al. 2010;Guerrini et al. 2010;Nabbout et al. 2003;Osaka et al. 2007;Yu et al. 2010). This suggests that clinical severity is influenced by additional factors, which may include genetic modifiers.
Approximately half of Dravet syndrome SCN1A patient mutations result in protein truncation, suggesting that SCN1A is haploinsufficient. Mice with heterozygous targeted deletion of Scn1a (Scn1a+/−) recapitulate many features of Dravet syndrome and provide a useful disease model. Scn1a+/− null heterozygotes, with 50% of Nav1.1 protein, develop spontaneous seizures and sporadic death beginning in the third week of life (Yu et al. 2006). A high percentage of early death occurs in the fourth postnatal week. Scn1a+/− mice that die prematurely have a high incidence of short duration, generalized seizures in the 24 hours preceding death than those that survive, while status epilepticus is rare (Kalume et al. 2013). GABAergic interneurons isolated from Scn1a+/− mice exhibit reduced sodium current and impaired action potential firing (Yu et al 2006). This results in reduced action potential-dependent inhibitory GABAergic neurotransmission and enhanced neuronal excitability (Han et al. 2012). Genetic background dramatically influences phenotype severity and survival of Scn1a+/− mice. On the C57BL/6J (B6) strain, the phenotype is more severe with spontaneous seizures and premature lethality, while there is no observable phenotype on the 129X1/SvJ strain background (Yu et al 2006). This suggests that modifier genes contribute to phenotype severity in the Dravet syndrome mouse model.
In this study, we performed QTL mapping and identified multiple modifier loci that contribute to strain-dependent differences in survival in the Scn1a+/− mouse model of Dravet syndrome. Using RNA-seq transcriptome analysis, we performed an initial survey of potential candidate modifier genes and identified several high priority candidates for follow-up in future studies.
Materials and Methods
Mice
Scn1atm1Kea mice on a pure 129S6/SvEvTac (129) inbred strain background were generated by homologous recombination in TL1 ES cells (129S6/SvEvTac) (Supplementary Figure S1). The mouse line Scn1atm1Kea has been maintained as a co-isogenic strain by continuous backcrossing of null heterozygotes to 129 (abbreviated 129.Scn1a+/−). Strain B6 was crossed to 129.Scn1a+/− to generate (B6 × 129.Scn1a+/−)F1 offspring (F1.Scn1a+/−). For mapping, we performed reciprocal backcrosses by mating F1.Scn1a+/− males to strain B6 (B6-N2), or 129 (129-N2) (Figure 1a).
Figure 1.
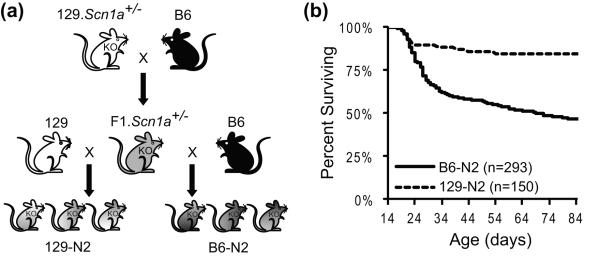
Generation of mapping backcross progeny and phenotyping. (a) Breeding scheme used to generate backcross progeny. First, 129.Scn1a+/− males were crossed to B6 females to generate F1.Scn1a+/− mice. Male F1.Scn1a+/− mice were then crossed with 129 females to generate 129-N2 offspring, or to B6 females to generate B6-N2 offspring. (b) Survival of Scn1a+/− backcross progeny. B6-N2 backcross progeny have significantly reduced survival compared to 129-N2 progeny (Log Rank p<0.0001)(n=293 for B6-N2 backcross; n=150 for 129-N2 backcross).
129S6/SvEvTac mice (stock #129SVE) were obtained from Taconic (Germantown, NY) and C57BL/6J mice (stock #00064) were obtained from The Jackson Laboratory (Bar Harbor, ME). All mice were maintained in an SPF barrier facility with a 12:12 hour light:dark schedule and ad libitum access to food and water. These studies were approved by the Vanderbilt University Animal Care and Use Committee in accordance with the National Institutes of Health Guide for the Care and Use of Laboratory Animals.
Phenotyping
Mice were ear tagged and tail-biopsied on postnatal day 14 (P14). At P21, N2 backcross mice were weaned into holding cages containing 4-5 mice of the same sex and age. Mice of both sexes were used and wildtype littermates were included in all holding cages. Survival was monitored to 12 weeks of age. During that time, all mice were monitored daily for general health and any mouse that was visibly unhealthy (e.g. stunted, underweight, dehydrated, poorly groomed, immobile) was euthanized and excluded from the study. We used survival as the primary phenotype measure for our mapping study. Deaths in the Scn1a+/− mice were sudden and unpredictable, occurring in otherwise healthy appearing animals. Occasionally, generalized tonic clonic seizures (GTCS) of short duration (<2 minutes) were witnessed. GTCS were followed by a short period of post-ictal immobility, but recovery was attained within 10 minutes. Following a witnessed GTCS, death was often recorded in the subsequent 24 hours. It has previously been demonstrated that sudden death is strongly correlated with seizure history in the Scn1a+/− mouse model (Kalume et al 2013).
Statistical Analysis
Survival was compared between groups by Kaplan Meier analysis and P-values were calculated with the Mantel Cox log rank test. P < 0.05 was considered statistically significant.
Genotyping
DNA was isolated from P14 tail biopsies using the Gentra Puregene Mouse Tail Kit according to the manufacturer’s instructions (Qiagen, Valencia, CA). The Scn1a genotype was determined by multiplex PCR using a forward primer located upstream of the recombination event and reverse primers located in Scn1a exon 1 and in the selection cassette (Supplementary Figure S1). These primers amplify a 983 bp product from the wildtype allele and a 622 bp product from the targeted allele (Supplementary Figure S1). Genome-wide microsatellite genotyping was performed by analysis of PCR products on 7% non-denaturing polyacrylamide gels stained with ethidium bromide. Genome-wide single nucleotide polymorphism (SNP) genotyping using Illumina’s Mouse Medium Density Linkage panel was performed at The Johns Hopkins Center for Inherited Disease Research (CIDR).
Genetic Analysis – B6-N2 Backcross
For the B6-N2 backcross, statistical analyses to identify modifier loci were performed using a two-part model (Broman 2003). For the two-part model, we performed a log10 transformation of the survival phenotype data to attenuate the skew in the distribution. Statistical analyses were performed with R/qtl (version 1.26-14). Suggestive (α=0.25) and significant (α=0.05) LOD thresholds were determined by permutation tests, with 10,000 permutations. The location of modifier loci was established via 1.5-LOD support intervals, which correspond to ~95% confidence intervals (Lander & Botstein 1989). The percentage of variance explained in the context of a full additive model was determined using the fitqtl command in R/qtl.
Heritability (h2) for the B6-N2 backcross was estimated as a range to reflect the two-part model that considers the phenotype data in two ways: (1) log10[survival] of individuals that die; and (2) the binary trait (live/die). First, h2survival was calculated by [∣(VN2 – VF1)∣/VN2] where VN2 is the variance of the log10[survival] for B6-N2 animals that died prior to 12 weeks of age (VB6N2 = 0.118) and VF1 is the variance of the log10[survival] for F1 animals that died prior to 12 weeks of age (VF1 = 0.101). Second, h2binary was calculated by [∣(PN2 – PF1)∣/PN2] where PN2 is the probability of dying prior to 12 weeks of age for the B6-N2 population (PB6N2 = 0.536) and PF1 is probability of dying prior to 12 weeks of age for the F1 population (PF1 = 0.718). Heritability range (h2survival – h2binary) of the premature lethality phenotype for the B6-N2 backcross was estimated to be 14 – 34%. ∣
Genetic Analysis – 129-N2 Backcross
For the 129-N2 backcross genome scan, we performed selective genotyping of early lethals (survival < 12 weeks of age) using microsatellite markers spaced at an average distance of 20 cM across the genome (Supplementary Table S1). The number of early lethals with heterozygous versus homozygous genotypes at each marker were compared and tested for deviation from the expected 1:1 segregation with the χ2 test. On chromosomes with suggestive evidence of linkage (p<0.05), we performed genotyping of survivors (survival > 12 weeks of age) and genotyping of additional markers in early lethals. To rule out the possibility of segregation distortion at markers due to genotyping or technical errors, we tested for departure from the expected 1:1 ratio in the combined population of early lethals and survivors with the χ2 test using a threshold of p < 0.05 for significance. Interval mapping was then performed on the selected chromosomes under a binary model using R/qtl software. The binary phenotype trait classified individual outcomes into two groups: early lethals (survival < 12 weeks of age); and survivors (survival > 12 weeks of age). The percentage of variance explained in the context of a full additive model was determined using the fitqtl command in R/qtl.
Heritability (h2) for the 129-N2 backcross was estimated by [∣(PN2 – P129)∣/PN2] where PN2 is the probability of dying prior to 12 weeks of age for the 129-N2 population (P129N2 = 0.169) and P129 is probability of dying prior to 12 weeks of age for the 129 parental population (PF1 = 0.110). Heritability of the premature lethality phenotype for the 129-N2 backcross was estimated to be 35%. This is similar to the binary heritability estimate for the B6-N2 backcross (34%).
RNA-Seq
Total RNA was isolated from whole brain samples of 4 week old B6 or 129 male and female mice (n=4/strain/sex) using TRIzol reagent according to the manufacturer’s instructions (Invitrogen, Carlsbad, CA). All samples had an RNA integrity number >8.2 (2100 Bioanalyzer, Agilent, Santa Clara, CA). For each group, a pooled sample was generated by combining total RNAs from four mice.
Samples were processed for RNA-seq using the TruSeq RNA sample preparation kit (Illumina, San Diego, CA) as previously described (Hawkins & Kearney 2012). Samples were sequenced by standard methods on the Illumina HiSeq 2000 platform in the Vanderbilt Technologies for Advanced Genomics Next Generation Sequencing Core (http://vantage.vanderbilt.edu) (Bentley et al. 2008). Sequencing was performed in two multiplexed lanes of 100 bp single-end sequencing which resulted in 75 million mappable reads per lane. The Illumina pipeline was used for base calling and quality filtering of sequence reads (Bentley et al 2008). Subsequent analysis was performed on the GALAXY open platform using the Tuxedo Tools analysis suite (Blankenberg et al. 2010;Goecks et al. 2010;Langmead et al. 2009;Trapnell et al. 2009), as previously described (Hawkins & Kearney 2012). Transcript assembly and abundance estimates of transcripts in fragments per kilobase of exon per million fragments mapped (FPKM) were performed by Cufflinks. Additional filtering removed any transcripts with <0.5 FPKM value. Significant differences in total gene and transcript expression, splice site, transcription start site (TSS) and promoter usage were determined using a false discovery rate-adjusted p-value (q-value) in Cuffdiff, with q<0.05 considered significant (Roberts et al. 2011a;Roberts et al. 2011b;Trapnell et al. 2010). Gene ontology analysis was performed using PANTHER tools (Mi et al. 2013).
SNP variant calls were performed using the Genome Analysis Toolkit for SNP Discovery (DePristo et al. 2011;McKenna et al. 2010). SNPs with a Phred score of >Q100 were retained. The following were removed by manual filtering of variant call files (VCF): SNPs that differed between biological replicates within a strain; were heterozygous; or had missing sample data. All retained SNPs were homozygous alternate from the B6 reference genome. Consequences of variants were determined using the Ensembl variant effect predictor tool (McLaren et al. 2010) and the potential impact of non-synonymous SNPs on protein function were determined using the SIFT algorithm (Kumar et al, 2009).
Results
Effect of Genetic Background
Previous studies reported strain-dependent phenotype variability in mice with heterozygous Scn1a loss-of-function alleles, including targeted deletion of Scn1a exon 26 or knockin of the Scn1a-R1407X mutation (Ogiwara et al. 2007;Yu et al 2006). In these studies, the Scn1a mutant phenotype was mild on a 129SvJ background, and became worse when crossed onto C57BL/6J (B6) (Ogiwara et al 2007;Yu et al 2006). The strain difference is most profoundly reflected in survival, which is approximately normal on the 129 strain and is markedly reduced on a mixed 129:B6 background. In order to systematically interrogate the genetic basis of strain-dependent survival, we generated a heterozygous Scn1a+/− null allele by targeted deletion of the first coding exon in TL1 ES cells (129S6/SvEvTac) (Supplementary Figure S1). These mice were established and maintained as a co-isogenic strain on the 129S6/SvEvTac (129) background. These mice recapitulate the phenotypes described by Yu and colleagues (Yu et al, 2006), including strain-dependence of phenotype expression. On the 129 strain, Scn1a+/− mice (129.Scn1a+/−) have no overt phenotype and a normal lifespan (Supplementary Figure S1). In over 240 hours of video-EEG monitoring (P24-P184), we never observed electrographic seizures in 129.Scn1a+/− mice. Crossing 129.Scn1a+/− mice to strain B6 resulted in (B6x129)F1.Scn1a+/− (F1.Scn1a+/−) offspring that exhibit spontaneous seizures and premature lethality, with 50% of mice dying by 1 month of age (Supplementary Figure S1). This suggests that strain B6 contributes modifier alleles that unmask the Scn1a+/− premature lethality phenotype.
Genetic Mapping
To isolate modifier loci responsible for the strain-dependent difference in survival, we performed two mapping backcrosses in which F1.Scn1a+/− heterozygotes were crossed to either B6 mice to generate B6-N2 informative mapping progeny (n=293) or to 129 mice to generate 129-N2 informative mapping progeny (n=150). Scn1a+/− heterozygotes were monitored for survival to 12 weeks of age. In the B6-N2 backcross, 46% of Scn1a+/− offspring survived to 12 weeks of age, while the 129-N2 backcross, 85% of Scn1a+/− offspring survived to 12 weeks (Figure 1). Survival of Scn1a+/− offspring from the B6-N2 backcross was significantly different than F1.Scn1a+/− and 129.Scn1a+/− mice (Log-Rank p<0.0001 and p< 0.0001, respectively). Survival of Scn1a+/− offspring from the 129-N2 backcross was significantly different from F1.Scn1a+/− (Log-Rank p<0.0001), but not 129.Scn1a+/− mice.
We performed QTL mapping analysis and identified several potential Dravet survival modifier loci (Dsm) that are summarized in Tables 1 and 2. Analysis of the B6-N2 backcross using a two-part model, which allows for separate effects on penetrance (live/die) and severity (age at time of early death), found significant or suggestive evidence for linkage on chromosomes 5, 7 and 8 (Figure 2). In this analysis, penetrance indicates whether a mouse died during the 12 week observation period, while severity is represented by age at the time of early death. The modifier locus on chromosome 5 affects penetrance of the lethal phenotype, while modifier loci on chromosomes 7 and 8 primarily affect age at time death (Figure 3). On chromosomes 5 and 8 the B6 allele conferred increased risk of early death, while on chromosome 7 the B6 allele was protective (Figure 4A). There was no evidence for interacting loci from a two-dimensional genome scan with a two-QTL model. Under a full additive model, these QTL explained 10.75% of the phenotype variance. Within this model, Dsm1 contributed 3.6%, Dsm2 contributed 4.3% and Dsm3 contributed 2.5% of the phenotype variance (Table 1). Given that heritability of the premature lethality phenotype estimated to be 14-34% in the B6-N2 backcross, these loci account for a significant proportion of the genetic variance.
Table 1.
Location and significance of Scn1a+/− modifier loci identified in the B6-N2 backcross.
| Locus | Chr |
Peak Position (cM) |
1.5 LOD
support interval (cM) |
Combined (p.mu) | Penetrance (p) | Severity (mu) |
Risk
Allele |
% Variance explained |
|||
|---|---|---|---|---|---|---|---|---|---|---|---|
| LOD | P-value | LOD | P-value | LOD | P-value | ||||||
| Dsm1 | 5 | 34 | 27.3 – 41.3 | 3.02 | 0.1882 | 3.01 | 0.043 | 0.001 | 1 | B6 | 3.6 |
| Dsm2 | 7 | 27.5 | 7.5 – 39.5 | 4.08 | 0.0196 | 0.78 | 0.999 | 3.34 | 0.023 | 129 | 4.3 |
| Dsm3 | 8 | 41.6 | 28.4 – 64.4 | 3.35 | 0.1022 | 0.38 | 1 | 2.96 | 0.0566 | B6 | 2.5 |
Table 2.
Location and significance of Scn1a+/− modifier loci identified in the 129-N2 backcross.
| QTL | Chr | Peak Position (cM) |
1.5 LOD support interval (cM) |
LOD | P-value | Risk Allele | % Variance explained |
|---|---|---|---|---|---|---|---|
| Dsm4 | 5 | 12.9 | 5.6-51.6 | 3.28 | 0.0013 | B6 | 10.3 |
| Dsm5 | 11 | 4.7 | 4.7-39.7 | 2.25 | 0.0170 | 129 | 5.1 |
Figure 2.

Genome-wide interval mapping for Dravet syndrome modifier loci that influence 12-week survival in the B6-N2 backcross. LOD scores for the combined effects on penetrance and severity are plotted for all mouse chromosomes and show suggestive or significant evidence of linkage to chromosomes 5, 7, and 8. Results shown are from a single QTL genome scan under a two-part model using a maximum likelihood procedure in R/qtl software. Horizontal lines mark significance thresholds for genome-wide significant (p=0.05; solid grey) or suggestive (p=0.25; dashed grey) evidence of linkage based on 10,000 permutations of the data. The X-axes are in centimorgans with chromosome numbers indicated below and tick marks representing the location of SNP markers used for genotyping.
Figure 3.

LOD scores for the effect on penetrance (live/die)(blue), severity (age at time of early death)(red) and the combined effect (black) are plotted for chromosomes 5, 7 and 8 and show that the modifier loci exert differential effects on penetrance and severity. Results shown are from a single QTL genome scan under a two-part model using a maximum likelihood procedure in R/qtl software. The horizontal solid grey line marks the significance threshold (p=0.05) for combined effect (LOD(p,mu)) and the dashed grey line marks significance thresholds (p=0.05) for penetrance (LOD(p)) and severity (LOD(mu)). Significance thresholds were determined by 10,000 permutations of the data. The X-axes are in centimorgans with chromosome numbers indicated below and tick marks representing the location of SNP markers used for genotyping.
Figure 4.

Effect of alleles at Dsm loci on survival. Genotypes from the marker closest to each significant modifier peak were used to determine the effect of individual loci on survival. Kaplan-Meier plots for each genotype class show the relationship between survival and alleles at modifier loci identified in the B6-N2 backcross on chromosome 5, 7 and 8 (a), and in the 129-N2 backcross on chromosomes 5 and 11 (b). P-values were calculated with the Mantel-Cox log rank test.
For QTL mapping analysis of the 129-N2 backcross we used a selective genotyping strategy with single marker χ2 analysis to identify chromosomes with suggestive evidence of linkage (Table S1). We then performed additional genotyping and interval mapping on chromosomes of interest under a binary trait model. For the binary phenotype trait, mice were categorized as “early lethals” (<12 week survival) or “survivors” (≥12 week survival). We found suggestive or significant evidence for linkage on chromosomes 5 and 11 (Table 2). Allele effects were varied, with B6 conferring increased risk of early death on chromosome 5 while the B6 allele was protective on chromosome 11 (Figure 4B). Under a full additive model, these QTL explained 26.6% of the phenotype variance, with Dsm4 contributing 10.3% and Dsm5 contributing 5.1% (Table 2). Heritability of the premature lethality phenotype was estimated to be 35% in the 129-N2 backcross; thus, these loci account for a significant proportion of the genetic variance.
Low resolution mapping results from both backcrosses had evidence for linkage on chromosome 5 (Dsm1 and Dsm4). Although the peaks localized to different chromosomal positions, there is complete overlap in their 1.5-LOD support intervals and the direction of allele effects is similar (Figure. 4; Table 1). At both the Dsm1 and Dsm4 loci the 129 allele is protective, while the B6 allele confers increased lethality risk. However, at this level of resolution we cannot be certain whether they represent the same or separate loci. Other loci mapped in the reciprocal backcrosses did not coincide. Dsm2 and Dsm3, which influence age at time of death in the B6-N2 backcross, were not apparent in genetic mapping of the 129-N2 backcross using binary trait analysis (live/die). Lethality was an infrequent outcome in the 129-N2 backcross; therefore, it was not sufficiently powered for mapping modifiers that influence timing of early death. The Dsm5 locus on chromosome 11 was identified in the 129-N2 backcross, but not in the B6-N2 backcross. This suggests the possibility that increased risk of early lethality conferred by the 129 allele may be a recessive trait.
Candidate Gene Analysis by RNA-seq
It was previously demonstrated that selective heterozygous deletion of Scn1a in neocortical/limbic GABAergic interneurons is sufficient to recapitulate the phenotype of the global heterozygous null, including spontaneous seizures and premature lethality (Cheah et al. 2012). This suggests that seizures and resultant premature lethality observed in Scn1a+/− mice are of CNS origin. Therefore, we performed sequence-based brain transcriptome analysis for preliminary identification of potential candidate modifier genes in Dsm intervals using RNA-seq transcriptome analysis. RNA-seq interrogates differential expression at the level of the gene, as well as individual transcripts, and can identify differential usage of splice sites, promoters, and TSS. In addition, because it is sequence-based, all expressed transcripts are interrogated, including novel, un-annotated transcripts. Focused analysis of RNA-seq data in the Dsm modifier loci 1.5 LOD support intervals revealed significant expression and/or regulatory differences between B6 and 129 in approximately 12% of genes using a semi-conservative FDR-adjusted p value (q value) significance threshold of q < 0.05 (Supplementary Table S3). On chromosome 5 we observed differential expression or regulation in 36 genes in Dsm1 and in 148 genes in Dsm4 (Supplementary Tables S2 and S3). Differential expression or regulation was observed in 127 genes in the Dsm2 locus on chromosome 7, in 122 genes in the Dsm3 locus on chromosome 8, and in 81 genes in the Dsm5 locus on chromosome 11 (Supplementary Tables S2 and S3). Gene ontology (GO) analysis indicated that differentially expressed genes in the Dsm1-5 intervals were enriched in several biological processes, including signal transduction (p=0.0343), cell cycle (p=0.0302), cell communication (p=0.0229) and cellular process (p=0.0105).
We further evaluated positional candidate genes by SNP analysis using data obtained from RNA-seq to identify genes with coding variants between B6 and 129. The combined Dsm1/Dsm 4 interval on chromosome 5 contains 965 known and predicted genes. Missense variants were identified in 61 of those genes, including 14 missense variants located in the smaller Dsm1 interval (Supplementary Table S2). In the Dsm2 interval, which contains 1335 known and predicted genes, we found 111 genes with missense variants and 3 genes with stop-gained variants (Supplementary Table S2). The Dsm 3 interval contains 825 known and predicted genes, of which 105 had missense variants (Supplementary Table S2). The Dsm5 interval on chromosome 11 contains 727 known and predicted genes and we identified missense variants in 10 of those genes (Supplementary Table S2). A complete list of the missense and stop-gained coding variants are provided in Supplementary Table S4.
Using additional filtering criteria (consideration of gene function, timing and location of expression, and involvement in neuronal excitability), we assembled a list of high priority candidate genes within the Dsm intervals that have known association with seizures or neuronal excitability (Table 3). Within the Dsm intervals, there are five GABA receptor subunit genes that exhibit significant differences in expression and/or gene regulation. This is of particular interest given the known dysfunction in GABA signaling in the Dravet syndrome mice (Han et al 2012;Ogiwara et al 2007;Yu et al 2006). We also found differences in additional ion channels genes that have been associated with seizures or abnormal neurotransmission, including the calcium channel subunit genes Cacna1a and Cacna2d1, the chloride channel gene Clcn3 and Kcnj11, encoding a potassium channel (Bian et al. 2006;Burgess & Noebels 2000;Dickerson et al. 2002; Gloyn et al. 2006;Rajakulendran et al. 2012;Yamada et al. 2001). There were also several additional differentially expressed non-ion channel genes with prior association with seizures or hyperexcitability, including Atp1a3, Lgi2, Mapk10, Reln and Slc7a10 (Clapcote et al. 2009;Heinzen et al. 2012; Hong et al. 2000; Patrylo et al. 2006; Rosewich et al. 2012; Rutter et al. 2007; Seppala et al. 2011; Shoichet et al 2006; Xie et al. 2005; Yang et al. 1997). This early survey of high priority candidate genes provides useful information for guiding future fine mapping efforts.
Table 3.
Candidate Modifier Genes with significant differences by RNA-seq and prior association with seizures or neuronal hyperexcitability.
| Locus | Chr | Position (Mb)* | Gene Symbol |
Gene Name |
|---|---|---|---|---|
| Dsm4 | 5 | 15.934691-16.374511 | Cacna2d1 | Voltage-dependent calcium channel alpha2, delta1 subunit |
| Dsm4 | 5 | 21.884454-22.344702 | Reln | Reelin |
| Dsml | 5 | 52.537864-52.566303 | Lgi2 | Leucine-rich repeat LGI family, member 2 |
| Dsml | 5 | 70.961057-71.095849 | Gabra2 | GABA-A receptor subunit alpha2 |
| Dsm4 | 5 | 102.907948-103.244334 | Mapk10 | Mitogen-activated protein kinase 10 |
| Dsm2 | 7 | 24.978167-25.005957 | Atp1a3 | Sodium/potassium ATPase alpha 3 polypeptide |
| Dsm2 | 7 | 35.186385-35.204898 | Slc7a10 | Solute carrier family 7 (cationic amino acid transporter, y+ system), member 10 |
| Dsm2 | 7 | 56.716465-57.387188 | Gabrg3 | GABA-A receptor subunit gamma3 |
| Dsm2 | 7 | 46.098725-46.099897 | Kcnjll | Inwardly rectifying potassium channel, subfamily j, member 11 |
| Dsm2 | 7 | 57.590518-57.828802 | Gabrb3 | GABA-A receptor subunit beta3 |
| Dsm3 | 8 | 60.983300-60.910389 | Clcn3 | Chloride channel 3 |
| Dsm3 | 8 | 84.388440-74.640246 | Cacnala | Voltage-dependent calcium channel, P/Q type, alpha1a subunit |
| Dsm5 | 11 | 42.306437-42.321072 | Gabra6 | GABA-A receptor subunit alpha6 |
| Dsm5 | 11 | 42.419757-42.629028 | Gabrb2 | GABA-A receptor subunit beta2 |
GRC m38 assembly
Discussion
Genetic analysis in reciprocal N2 backcrosses identified modifier loci on chromosomes 5, 7, 8 and 11 that influence the early lethality phenotype of the Scn1a+/− Dravet mouse model. This is consistent with previous studies that have demonstrated that seizure related phenotypes are influenced by genetic factors (Chaix et al. 2007;Frankel 2009;Schauwecker 2011;Seyfried et al. 1999;Winawer et al. 2007). In addition, it is consistent with previous results from our laboratory demonstrating that modifier genes influence epilepsy severity and survival in a mouse model with a mutation in the Scn2a voltage-gated sodium channel gene (Bergren et al. 2005;Bergren et al. 2009;Hawkins & Kearney 2012;Jorge et al. 2011). Previous work demonstrated a strong correlation between seizure history and survival in the Scn1a+/− mouse model (Kalume et al 2013). Therefore, it is likely that some modifier genes that influence survival will also influence seizure history. The effect of survival modifiers on seizure history will be assessed in future studies following fine mapping and gene identification.
QTL responsible for strain differences in susceptibility to seizures induced by chemoconvulsants, electroshock and handling have been mapped in mice. Several previous studies mapped QTL responsible for susceptibility to induced seizures to chromosome 5 in regions overlapping the Dsm1 and Dsm4 loci (Ferraro et al 1997;Ferraro et al 1999;Ferraro et al 2001;Ferraro et al 2007). The Bis4 QTL influencing susceptibility to seizures induced by β-carboline was mapped to chromosome 7 in a region that overlaps the Dsm2 interval (Gershenfeld et al. 1999). QTL influencing susceptibility to induced seizures were mapped to intervals of chromosome 11 that overlap with Dsm5 (Ferraro et al 2001;Hood et al. 2006). We previously mapped the Moe1 modifier locus that influences epilepsy severity in the Scn2aQ54 mouse model to distal chromosome 11 (Bergren et al 2005;Bergren et al 2009;Hawkins & Kearney 2012). However, it is not likely to be the same locus because Moe1 is on distal chromosome 11, while Dsm5 is located more proximally. The Dsm3 locus on chromosome 8 has not previously been associated with seizure phenotypes and may represent a novel modifier locus.
There is also overlap between the Dsm loci identified in this report and known human epilepsy loci. For the Dsm1/Dsm4 QTL on mouse chromosome 5, the human syntenic regions contain several epilepsy loci, including partial epilepsy with pericentral spikes (EPPS; 4p15), familial temporal lobe epilepsy (ETL3; 4q13.2-q21.3), and Lennox-Gastaut type epileptic encephalopathy (MAPK10; 4q21.3) (Hedera et al. 2007;Kinton et al. 2002;Shoichet et al. 2006). For the Dsm2 QTL on mouse chromosome 7, the human syntenic region includes the voltage-gated sodium channel β1 subunit gene, SCN1B (19p13.12), that has been implicated in generalized epilepsy with febrile seizures plus (GEFS+) and Dravet syndrome, and GABRB3 (15q12) that has been associated with susceptibility to childhood absence epilepsy (Macdonald et al. 2012;Ogiwara et al. 2012;Patino et al. 2009). Additionally, the Dsm2 interval is syntenic with the human 15q11.2 and 15q13.3 copy number variants (CNVs) that have been associated with epilepsy, neurodevelopmental and neuropsychiatric disorders (Mulley & Mefford 2011). For the Dsm5 interval on mouse chromosome 11, the human syntenic region includes GABRG2 (5q34) implicated in Dravet syndrome, GABRA1 (5q34) implicated in juvenile myoclonic epilepsy and childhood absence epilepsy, and GABRA6 implicated in childhood absence epilepsy (Hernandez et al. 2011;Macdonald et al 2012).
We identified numerous genes in the Dsm1-5 loci with significant differential expression, regulation or coding sequence variation between the resistant 129 and susceptible B6 strains by RNA-seq. We focused our analysis on brain transcriptome based on the observation that heterozygous conditional deletion of Scn1a in forebrain GABAergic neurons recapitulates the global heterozygous null phenotype, including seizures and early lethality (Cheah et al 2012). However, it is possible that non-neuronal, strain-dependent transcript differences in other tissues (e.g. heart), as well as age- or brain region-specific differences may contribute. At this low-resolution stage, the intervals are quite large and by coincidence will contain many strong candidates with differential expression, regulation, or coding sequence variants, and a known link to neuronal hyperexcitability. Moreover, these intervals contain many additional positional candidates that could be novel risk genes that have not previously been associated with epilepsy or SUDEP. Therefore, fine mapping is required to narrow the intervals to focus our search for the responsible modifier genes. The early-stage high priority candidate list is useful for guiding fine mapping efforts. We will use this information to strategically select recombinants for interval specific mapping, allowing us to quickly rule in or out high priority genes. This will make the high resolution mapping stage more efficient and will accelerate modifier gene identification.
Identifying genetic factors that modify premature lethality in Scn1a+/− mice will improve our understanding of the pathophysiology of Dravet syndrome and associated SUDEP risk. This will advance our ability to predict risk based on molecular diagnostic tests and may identify novel therapeutic targets for improved treatment of human patients.
Supplementary Material
Acknowledgements
We thank Jae Maeng for technical support. We acknowledge RNA-seq support from Travis Clark in the Vanderbilt Technologies for Advanced Genomics NextGen Sequencing Core and Christian Schaeffer in the Vanderbilt Computational Genomics Core. This work was supported by National Institutes of Health grants R01-NS053792 (J.A.K.), R21-NS063097 (J.A.K.) and F31-NS077700 (N.A.H.). Genotyping services were provided by the Center for Inherited Disease Research (CIDR). CIDR is fully funded through a federal contract from the National Institutes of Health to The Johns Hopkins University, contract number HHSN268201100011I.
Footnotes
The authors have no conflicts of interest to declare.
References
- Bentley DR, Balasubramanian S, Swerdlow HP, et al. Accurate whole human genome sequencing using reversible terminator chemistry. Nature. 2008;456:53–59. doi: 10.1038/nature07517. [DOI] [PMC free article] [PubMed] [Google Scholar]
- Bergren SK, Chen S, Galecki A, Kearney JA. Genetic modifiers affecting severity of epilepsy caused by mutation of sodium channel Scn2a. Mamm Genome. 2005;16:683–690. doi: 10.1007/s00335-005-0049-4. [DOI] [PubMed] [Google Scholar]
- Bergren SK, Rutter ED, Kearney JA. Fine mapping of an epilepsy modifier gene on mouse Chromosome 19. Mamm Genome. 2009;20:359–366. doi: 10.1007/s00335-009-9193-6. [DOI] [PMC free article] [PubMed] [Google Scholar]
- Bian F, Li Z, Offord J, Davis MD, McCormick J, Taylor CP, Walker LC. Calcium channel alpha2-delta type 1 subunit is the major binding protein for pregabalin in neocortex, hippocampus, amygdala, and spinal cord: an ex vivo autoradiographic study in alpha2-delta type 1 genetically modified mice. Brain Res. 2006;1075:68–80. doi: 10.1016/j.brainres.2005.12.084. [DOI] [PubMed] [Google Scholar]
- Blankenberg D, Von KG, Coraor N, Ananda G, Lazarus R, Mangan M, Nekrutenko A, Taylor J. Galaxy: a web-based genome analysis tool for experimentalists. Curr Protoc Mol Biol. 2010;89:19.10.1–19.10.21. doi: 10.1002/0471142727.mb1910s89. [DOI] [PMC free article] [PubMed] [Google Scholar]
- Broman KW. Mapping quantitative trait loci in the case of a spike in the phenotype distribution. Genetics. 2003;163:1169–1175. doi: 10.1093/genetics/163.3.1169. [DOI] [PMC free article] [PubMed] [Google Scholar]
- Burgess DL, Noebels JL. Calcium channel defects in models of inherited generalized epilepsy. Epilepsia. 2000;41:1074–1075. doi: 10.1111/j.1528-1157.2000.tb00305.x. [DOI] [PubMed] [Google Scholar]
- Chaix Y, Ferraro TN, Lapouble E, Martin B. Chemoconvulsant-induced seizure susceptibility: toward a common genetic basis? Epilepsia. 2007;48(Suppl 5):48–52. doi: 10.1111/j.1528-1167.2007.01289.x. [DOI] [PubMed] [Google Scholar]
- Cheah CS, Yu FH, Westenbroek RE, Kalume FK, Oakley JC, Potter GB, Rubenstein JL, Catterall WA. Specific deletion of NaV1.1 sodium channels in inhibitory interneurons causes seizures and premature death in a mouse model of Dravet syndrome. Proc Natl Acad Sci U S A. 2012;109:14646–14651. doi: 10.1073/pnas.1211591109. [DOI] [PMC free article] [PubMed] [Google Scholar]
- Claes LR, Deprez L, Suls A, Baets J, Smets K, Van DT, Deconinck T, Jordanova A, De Jonghe P. The SCN1A variant database: a novel research and diagnostic tool. Hum Mutat. 2009;30:E904–E920. doi: 10.1002/humu.21083. [DOI] [PubMed] [Google Scholar]
- Clapcote SJ, Duffy S, Xie G, et al. Mutation I810N in the alpha3 isoform of Na+,K+-ATPase causes impairments in the sodium pump and hyperexcitability in the CNS. Proc Natl Acad Sci U S A. 2009;106:14085–14090. doi: 10.1073/pnas.0904817106. [DOI] [PMC free article] [PubMed] [Google Scholar]
- Depienne C, Trouillard O, Gourfinkel-An I, et al. Mechanisms for variable expressivity of inherited SCN1A mutations causing Dravet syndrome. J Med Genet. 2010;47:404–410. doi: 10.1136/jmg.2009.074328. [DOI] [PubMed] [Google Scholar]
- Depienne C, Trouillard O, Saint-Martin C, et al. Spectrum of SCN1A gene mutations associated with Dravet syndrome: analysis of 333 patients. J Med Genet. 2009;46:183–191. doi: 10.1136/jmg.2008.062323. [DOI] [PubMed] [Google Scholar]
- DePristo MA, Banks E, Poplin R, et al. A framework for variation discovery and genotyping using next-generation DNA sequencing data. Nat Genet. 2011;43:491–498. doi: 10.1038/ng.806. [DOI] [PMC free article] [PubMed] [Google Scholar]
- Dickerson LW, Bonthius DJ, Schutte BC, Yang B, Barna TJ, Bailey MC, Nehrke K, Williamson RA, Lamb FS. Altered GABAergic function accompanies hippocampal degeneration in mice lacking ClC-3 voltage-gated chloride channels. Brain Res. 2002;958:227–250. doi: 10.1016/s0006-8993(02)03519-9. [DOI] [PubMed] [Google Scholar]
- Dravet C, Bureau M, Oguni H, Fukuyama Y, Cokar O. Severe myoclonic epilepsy in infancy: Dravet syndrome. Adv Neurol. 2005;95:71–102. [PubMed] [Google Scholar]
- Ferraro TN, Golden GT, Smith GG, et al. Quantitative genetic study of maximal electroshock seizure threshold in mice: evidence for a major seizure susceptibility locus on distal chromosome 1. Genomics. 2001;75:35–42. doi: 10.1006/geno.2001.6577. [DOI] [PubMed] [Google Scholar]
- Ferraro TN, Golden GT, Smith GG, Schork NJ, St Jean P, Ballas C, Choi H, Berrettini WH. Mapping murine loci for seizure response to kainic acid. Mamm Genome. 1997;8:200–8. doi: 10.1007/s003359900389. [DOI] [PubMed] [Google Scholar]
- Ferraro TN, Golden GT, Smith GG, et al. Mapping loci for pentylenetetrazol-induced seizure susceptibility in mice. J Neurosci. 1999;19:6733–9. doi: 10.1523/JNEUROSCI.19-16-06733.1999. [DOI] [PMC free article] [PubMed] [Google Scholar]
- Ferraro TN, Smith GG, Schwebel CL, Lohoff FW, Furlong P, Berrettini WH, Buono RJ. Quantitative trait locus for seizure susceptibility on mouse chromosome 5 confirmed with reciprocal congenic strains. Physiol Genomics. 2007;31:458–462. doi: 10.1152/physiolgenomics.00123.2007. [DOI] [PubMed] [Google Scholar]
- Frankel WN. Genetics of complex neurological disease: challenges and opportunities for modeling epilepsy in mice and rats. Trends Genet. 2009;25:361–367. doi: 10.1016/j.tig.2009.07.001. [DOI] [PMC free article] [PubMed] [Google Scholar]
- Genton P, Velizarova R, Dravet C. Dravet syndrome: the long-term outcome. Epilepsia. 2011;52(Suppl 2):44–49. doi: 10.1111/j.1528-1167.2011.03001.x. [DOI] [PubMed] [Google Scholar]
- Gershenfeld HK, Neumann PE, Li X, St Jean PL, Paul SM. Mapping quantitative trait loci for seizure response to a GABAA receptor inverse agonist in mice. J Neurosci. 1999;19:3731–8. doi: 10.1523/JNEUROSCI.19-10-03731.1999. [DOI] [PMC free article] [PubMed] [Google Scholar]
- Gloyn AL, atloff-Zito C, Edghill EL, Bellanne-Chantelot C, Nivot S, Coutant R, Ellard S, Hattersley AT, Robert JJ. KCNJ11 activating mutations are associated with developmental delay, epilepsy and neonatal diabetes syndrome and other neurological features. Eur J Hum Genet. 2006;14:824–830. doi: 10.1038/sj.ejhg.5201629. [DOI] [PubMed] [Google Scholar]
- Goecks J, Nekrutenko A, Taylor J. Galaxy: a comprehensive approach for supporting accessible, reproducible, and transparent computational research in the life sciences. Genome Biol. 2010;11:R86. doi: 10.1186/gb-2010-11-8-r86. [DOI] [PMC free article] [PubMed] [Google Scholar]
- Guerrini R, Cellini E, Mei D, Metitieri T, Petrelli C, Pucatti D, Marini C, Zamponi N. Variable epilepsy phenotypes associated with a familial intragenic deletion of the SCN1A gene. Epilepsia. 2010;51:2474–2477. doi: 10.1111/j.1528-1167.2010.02790.x. [DOI] [PubMed] [Google Scholar]
- Han S, Tai C, Westenbroek RE, et al. Autistic-like behaviour in Scn1a+/− mice and rescue by enhanced GABA-mediated neurotransmission. Nature. 2012;489:385–390. doi: 10.1038/nature11356. [DOI] [PMC free article] [PubMed] [Google Scholar]
- Hawkins NA, Kearney JA. Confirmation of an epilepsy modifier locus on mouse chromosome 11 and candidate gene analysis by RNA-Seq. Genes Brain Behav. 2012;11:452–460. doi: 10.1111/j.1601-183X.2012.00790.x. [DOI] [PMC free article] [PubMed] [Google Scholar]
- Hedera P, Blair MA, Andermann E, et al. Familial mesial temporal lobe epilepsy maps to chromosome 4q13.2-q21.3. Neurology. 2007;68:2107–2112. doi: 10.1212/01.wnl.0000261246.75977.89. [DOI] [PubMed] [Google Scholar]
- Heinzen EL, Swoboda KJ, Hitomi Y, et al. De novo mutations in ATP1A3 cause alternating hemiplegia of childhood. Nat Genet. 2012;44:1030–1034. doi: 10.1038/ng.2358. [DOI] [PMC free article] [PubMed] [Google Scholar]
- Hernandez CC, Gurba KN, Hu N, Macdonald RL. The GABRA6 mutation, R46W, associated with childhood absence epilepsy, alters 6beta22 and 6beta2 GABA(A) receptor channel gating and expression. J Physiol. 2011;589:5857–5878. doi: 10.1113/jphysiol.2011.218883. [DOI] [PMC free article] [PubMed] [Google Scholar]
- Hong SE, Shugart YY, Huang DT, Shahwan SA, Grant PE, Hourihane JO, Martin ND, Walsh CA. Autosomal recessive lissencephaly with cerebellar hypoplasia is associated with human RELN mutations. Nat Genet. 2000;26:93–96. doi: 10.1038/79246. [DOI] [PubMed] [Google Scholar]
- Hood HM, Metten P, Crabbe JC, Buck KJ. Fine mapping of a sedative-hypnotic drug withdrawal locus on mouse chromosome 11. Genes Brain Behav. 2006;5:1–10. doi: 10.1111/j.1601-183X.2005.00122.x. [DOI] [PubMed] [Google Scholar]
- Jorge BS, Campbell CM, Miller AR, Rutter ED, Gurnett CA, Vanoye CG, George AL, Jr., Kearney JA. Voltage-gated potassium channel KCNV2 (Kv8.2) contributes to epilepsy susceptibility. Proc Natl Acad Sci U S A. 2011;108:5443–5448. doi: 10.1073/pnas.1017539108. [DOI] [PMC free article] [PubMed] [Google Scholar]
- Kalume F, Westenbroek RE, Cheah CS, Yu FH, Oakley JC, Scheuer T, Catterall WA. Sudden unexpected death in a mouse model of Dravet syndrome. J Clin Invest. 2013;123:1798–1808. doi: 10.1172/JCI66220. [DOI] [PMC free article] [PubMed] [Google Scholar]
- Kinton L, Johnson MR, Smith SJ, et al. Partial epilepsy with pericentral spikes: a new familial epilepsy syndrome with evidence for linkage to chromosome 4p15. Ann Neurol. 2002;51:740–749. doi: 10.1002/ana.10221. [DOI] [PubMed] [Google Scholar]
- Kumar P, Henikoff S, Ng PC. Predicting the effects of coding non-synonymous variants on protein function using the SIFT algorithm. Nat Protoc. 2009;4:1073–1081. doi: 10.1038/nprot.2009.86. [DOI] [PubMed] [Google Scholar]
- Lander ES, Botstein D. Mapping mendelian factors underlying quantitative traits using RFLP linkage maps. Genetics. 1989;121:185–199. doi: 10.1093/genetics/121.1.185. [DOI] [PMC free article] [PubMed] [Google Scholar]
- Langmead B, Trapnell C, Pop M, Salzberg SL. Ultrafast and memory-efficient alignment of short DNA sequences to the human genome. Genome Biol. 2009;10:R25. doi: 10.1186/gb-2009-10-3-r25. [DOI] [PMC free article] [PubMed] [Google Scholar]
- Macdonald RL, Kang JQ, Gallagher MJ. GABAA Receptor Subunit Mutations and Genetic Epilepsies. In: Noebels JL, Avoli M, Rogawski MA, Olson RW, editors. Jasper’s Basic Mechanisms of the Epilepsies [Internet] National Center for Biotechnology Information (US); Bethesda (MD): 2012. [PubMed] [Google Scholar]
- McKenna A, Hanna M, Banks E, et al. The Genome Analysis Toolkit: a MapReduce framework for analyzing next-generation DNA sequencing data. Genome Res. 2010;20:1297–1303. doi: 10.1101/gr.107524.110. [DOI] [PMC free article] [PubMed] [Google Scholar]
- McLaren W, Pritchard B, Rios D, Chen Y, Flicek P, Cunningham F. Deriving the consequences of genomic variants with the Ensembl API and SNP Effect Predictor. Bioinformatics. 2010;26:2069–2070. doi: 10.1093/bioinformatics/btq330. [DOI] [PMC free article] [PubMed] [Google Scholar]
- Meisler MH, Kearney JA. Sodium channel mutations in epilepsy and other neurological disorders. J Clin Invest. 2005;115:2010–2017. doi: 10.1172/JCI25466. [DOI] [PMC free article] [PubMed] [Google Scholar]
- Meisler MH, O’Brien JE, Sharkey LM. Sodium channel gene family: epilepsy mutations, gene interactions and modifier effects. J Physiol. 2010;588:1841–1848. doi: 10.1113/jphysiol.2010.188482. [DOI] [PMC free article] [PubMed] [Google Scholar]
- Mi H, Muruganujan A, Thomas PD. PANTHER in 2013: modeling the evolution of gene function, and other gene attributes, in the context of phylogenetic trees. Nucleic Acids Res. 2013;41:D377–D386. doi: 10.1093/nar/gks1118. [DOI] [PMC free article] [PubMed] [Google Scholar]
- Mulley JC, Mefford HC. Epilepsy and the new cytogenetics. Epilepsia. 2011;52:423–432. doi: 10.1111/j.1528-1167.2010.02932.x. [DOI] [PMC free article] [PubMed] [Google Scholar]
- Nabbout R, Gennaro E, Dalla Bernardina B, et al. Spectrum of SCN1A mutations in severe myoclonic epilepsy of infancy. Neurology. 2003;60:1961–7. doi: 10.1212/01.wnl.0000069463.41870.2f. [DOI] [PubMed] [Google Scholar]
- Ogiwara I, Miyamoto H, Morita N, et al. Na(v)1.1 localizes to axons of parvalbumin-positive inhibitory interneurons: a circuit basis for epileptic seizures in mice carrying an Scn1a gene mutation. J Neurosci. 2007;27:5903–5914. doi: 10.1523/JNEUROSCI.5270-06.2007. [DOI] [PMC free article] [PubMed] [Google Scholar]
- Ogiwara I, Nakayama T, Yamagata T, Ohtani H, Mazaki E, Tsuchiya S, Inoue Y, Yamakawa K. A homozygous mutation of voltage-gated sodium channel beta(I) gene SCN1B in a patient with Dravet syndrome. Epilepsia. 2012;53:e200–e203. doi: 10.1111/epi.12040. [DOI] [PubMed] [Google Scholar]
- Osaka H, Ogiwara I, Mazaki E, et al. Patients with a sodium channel alpha 1 gene mutation show wide phenotypic variation. Epilepsy Res. 2007;75:46–51. doi: 10.1016/j.eplepsyres.2007.03.018. [DOI] [PubMed] [Google Scholar]
- Patino GA, Claes LR, Lopez-Santiago LF, et al. A functional null mutation of SCN1B in a patient with Dravet syndrome. J Neurosci. 2009;29:10764–10778. doi: 10.1523/JNEUROSCI.2475-09.2009. [DOI] [PMC free article] [PubMed] [Google Scholar]
- Patrylo PR, Browning RA, Cranick S. Reeler homozygous mice exhibit enhanced susceptibility to epileptiform activity. Epilepsia. 2006;47:257–266. doi: 10.1111/j.1528-1167.2006.00417.x. [DOI] [PubMed] [Google Scholar]
- Rajakulendran S, Kaski D, Hanna MG. Neuronal P/Q-type calcium channel dysfunction in inherited disorders of the CNS. Nat Rev Neurol. 2012;8:86–96. doi: 10.1038/nrneurol.2011.228. [DOI] [PubMed] [Google Scholar]
- Roberts A, Pimentel H, Trapnell C, Pachter L. Identification of novel transcripts in annotated genomes using RNA-Seq. Bioinformatics. 2011a;27:2325–2329. doi: 10.1093/bioinformatics/btr355. [DOI] [PubMed] [Google Scholar]
- Roberts A, Trapnell C, Donaghey J, Rinn JL, Pachter L. Improving RNA-Seq expression estimates by correcting for fragment bias. Genome Biol. 2011b;12:R22. doi: 10.1186/gb-2011-12-3-r22. [DOI] [PMC free article] [PubMed] [Google Scholar]
- Rosewich H, Thiele H, Ohlenbusch A, et al. Heterozygous de-novo mutations in ATP1A3 in patients with alternating hemiplegia of childhood: a whole-exome sequencing gene-identification study. Lancet Neurol. 2012;11:764–773. doi: 10.1016/S1474-4422(12)70182-5. [DOI] [PubMed] [Google Scholar]
- Rutter AR, Fradley RL, Garrett EM, Chapman KL, Lawrence JM, Rosahl TW, Patel S. Evidence from gene knockout studies implicates Asc-1 as the primary transporter mediating d-serine reuptake in the mouse CNS. Eur J Neurosci. 2007;25:1757–1766. doi: 10.1111/j.1460-9568.2007.05446.x. [DOI] [PubMed] [Google Scholar]
- Schauwecker PE. The relevance of individual genetic background and its role in animal models of epilepsy. Epilepsy Res. 2011;97:1–11. doi: 10.1016/j.eplepsyres.2011.09.005. [DOI] [PMC free article] [PubMed] [Google Scholar]
- Scheffer IE, Zhang YH, Jansen FE, Dibbens L. Dravet syndrome or genetic (generalized) epilepsy with febrile seizures plus? Brain Dev. 2009;31:394–400. doi: 10.1016/j.braindev.2009.01.001. [DOI] [PubMed] [Google Scholar]
- Seppala EH, Jokinen TS, Fukata M, et al. LGI2 truncation causes a remitting focal epilepsy in dogs. PLoS Genet. 2011;7:e1002194. doi: 10.1371/journal.pgen.1002194. [DOI] [PMC free article] [PubMed] [Google Scholar]
- Seyfried TN, Todorova MT, Poderycki MJ. Experimental models of multifactorial epilepsies: the EL mouse and mice susceptible to audiogenic seizures. Adv Neurol. 1999;79:279–90. [PubMed] [Google Scholar]
- Shoichet SA, Duprez L, Hagens O, et al. Truncation of the CNS-expressed JNK3 in a patient with a severe developmental epileptic encephalopathy. Hum Genet. 2006;118:559–567. doi: 10.1007/s00439-005-0084-y. [DOI] [PubMed] [Google Scholar]
- Trapnell C, Pachter L, Salzberg SL. TopHat: discovering splice junctions with RNA-Seq. Bioinformatics. 2009;25:1105–1111. doi: 10.1093/bioinformatics/btp120. [DOI] [PMC free article] [PubMed] [Google Scholar]
- Trapnell C, Williams BA, Pertea G, Mortazavi A, Kwan G, van Baren MJ, Salzberg SL, Wold BJ, Pachter L. Transcript assembly and quantification by RNA-Seq reveals unannotated transcripts and isoform switching during cell differentiation. Nat Biotechnol. 2010;28:511–515. doi: 10.1038/nbt.1621. [DOI] [PMC free article] [PubMed] [Google Scholar]
- Winawer MR, Kuperman R, Niethammer M, Sherman S, Rabinowitz D, Guell IP, Ponder CA, Palmer AA. Use of chromosome substitution strains to identify seizure susceptibility loci in mice. Mamm Genome. 2007;18:23–31. doi: 10.1007/s00335-006-0087-6. [DOI] [PMC free article] [PubMed] [Google Scholar]
- Xie X, Dumas T, Tang L, et al. Lack of the alanine-serine-cysteine transporter 1 causes tremors, seizures, and early postnatal death in mice. Brain Res. 2005;1052:212–221. doi: 10.1016/j.brainres.2005.06.039. [DOI] [PubMed] [Google Scholar]
- Yamada K, Ji JJ, Yuan H, Miki T, Sato S, Horimoto N, Shimizu T, Seino S, Inagaki N. Protective role of ATP-sensitive potassium channels in hypoxia-induced generalized seizure. Science. 2001;292:1543–1546. doi: 10.1126/science.1059829. [DOI] [PubMed] [Google Scholar]
- Yang DD, Kuan CY, Whitmarsh AJ, Rincon M, Zheng TS, Davis RJ, Rakic P, Flavell RA. Absence of excitotoxicity-induced apoptosis in the hippocampus of mice lacking the Jnk3 gene. Nature. 1997;389:865–870. doi: 10.1038/39899. [DOI] [PubMed] [Google Scholar]
- Yu FH, Mantegazza M, Westenbroek RE, et al. Reduced sodium current in GABAergic interneurons in a mouse model of severe myoclonic epilepsy in infancy. Nat Neurosci. 2006;9:1142–1149. doi: 10.1038/nn1754. [DOI] [PubMed] [Google Scholar]
- Yu MJ, Shi YW, Gao MM, Deng WY, Liu XR, Chen L, Long YS, Yi YH, Liao WP. Milder phenotype with SCN1A truncation mutation other than SMEI. Seizure. 2010;19:443–445. doi: 10.1016/j.seizure.2010.06.010. [DOI] [PubMed] [Google Scholar]
Associated Data
This section collects any data citations, data availability statements, or supplementary materials included in this article.