

Over the past two decades, there has been an enormous effort to understand, control, and use the relationship between the morphology of nanomaterials and their physical and chemical properties.[1,2] Indeed, a great deal of effort has focused on controlling the size, shape, and composition of nanostructures. However, equally important is the surface chemistry of such structures, especially when one considers that the ratio of surface to bulk atoms is much higher than that in micro- or macroscopic systems. For example, the surface plasmon resonances (SPRs) of nanoparticles are highly dependent upon the dielectric medium that surrounds them, including adlayers of molecules and solvent.[3,4] Catalytic activity of a nanoparticle is also highly dependent upon adsorbate.[5,6] Indeed, the development of ways to control the structure and chemical functionalization of a nanoparticle surface is a major area of research, and has led to the discovery of new properties and applications for this important class of materials.[7] In the case of isotropic metal nanoparticles, functionalization has led to a variety of exciting scientific insights and applications, including the use of nanoparticles for spectroscopic labels,[8] gene-regulation agents,[9] and ultrasensitive biodiagnostic tools.[10] In general, less has been done with anisotropic structures, but there have been some important observations and advances made for nanorod and nanoshell structures.[11–14] For example, Gole and Murphy have reported that gold nanorods functionalized with biotin-disulfide will assemble in an end-to-end manner when interconnecting streptavidin proteins are added to a colloid containing them. The authors concluded that such assembly behavior was indicative of end-selective functionalization.[12] Mann and co-workers described a similar example with oligonucleotide-modified nanorods, but in contrast with the Murphy system, they observe sheet-like assembly of nanorods along their long axes.[11] These results present a challenge to both understand and establish control over the face-selective functionalization of anisotropic nanoparticles.
An ideal system to address this challenge is an anisotropic nanoparticle that can be made in high yield, which is composed of a metal with well-known surface chemistry, exhibits strong, architecture- and environment-sensitive optical features, and has well-defined crystallographic facets. Recently, we and others have developed methods for synthesizing triangular prisms, made of gold or silver, that exhibit these characteristics.[15–18] Nanoprisms of this type are generally single crystals, in some cases twinned, with broad, atomically flat triangular {111} faces, and high energy side crystal facets. Because of their well-defined structures, these prisms are an excellent model system to study processes that involve the face-selective functionalization of nanoparticles. Herein, we present a study aimed at determining the factors that allow one to adsorb alkylthiol-modified oligonucleotides on different facets of an anisotropic gold nanoparticle. To accomplish this goal, face-selective DNA ligand adsorption processes have been studied quantitatively and used to control the selective immobilization of DNA on the edges of the particle, which is confirmed by direct chemical analysis [using electron energy loss spectroscopy (EELS) mapping] and indirectly by subsequent DNA-induced assembly events.
In this work, triangular Au nanoprisms (140 ± 20 nm edge length, 7.5 ± 0.5 nm thick) were synthesized and purified using literature methods.[19] To effect surface modification 3′-alkylthiolated single-stranded DNA (HS-ssDNA) was added to a solution of nanoprisms, and the salt concentration of the solution was raised to 0.15 M NaCl, 0.01 M phosphates in the presence of surfactant (0.01% sodium dodecyl sulfate) over the course of 3 h (see Experimental Section). To confirm that DNA was immobilized on the nanoprism surface, two separate batches of nanoprisms were functionalized with HS-ssDNA sequences that were complementary. The two solutions of DNA-modified nanoprisms were washed separately to remove excess DNA (see Experimental Section) and then combined and characterized by UV–Vis–NIR spectroscopy (Figure 1A).[20] Dehybridization of the assembled DNA-Au nanoprism conjugates occurred over a very narrow temperature range, with a melting temperature, Tm, of 60.1 °C (determined by taking the first-derivative of the melting curve and measuring the full width of the peak at half its maximum, FWHM = 2.4 °C, Figure 1A inset). This sharp melting behavior has been observed previously for pseudo-spherical nanoparticles functionalized with DNA[20–22] and is a diagnostic feature of particles that are densely functionalized with DNA. The melting of the Au nanoprisms was monitored at 1250 nm, which corresponds to the dipole SPR of the Au nanoprisms and indicates that the melting transition is associated with the dehybridization of nanoprisms interconnected by DNA.
Figure 1.
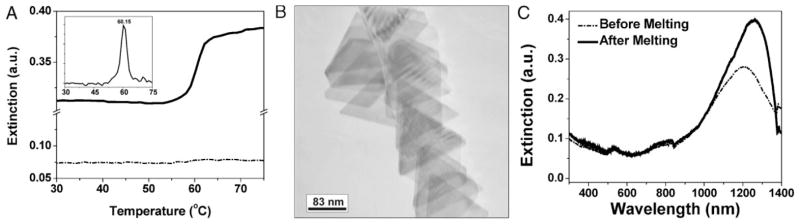
A) Melting profile of a Au nanoprism aggregate interconnected by DNA, monitored at 1250 nm (dipole SPR of gold nanoprisms, black) and 532 nm (dipole SPR of 40 nm gold nanoparticles, dashed). Inset: first derivative of the melting transition at 1250 nm; Tm = 60.1 °C; FWHM = 2.4 °C. B) TEM image of nanoprism-DNA conjugates after melting. C) UV–Vis–NIR spectra of nanoprism conjugates before and after melting. DNA sequences: Sequence A: 5′ACT ATT GAT AAG GAT A10 SH 3′; Sequence B: 5′ATC CTT ATC AAT AGT A10 SH 3′).
Transmission electron microscopy (TEM) images of nanoprisms that were taken after melting show that the nanoprism morphology is unaffected by either the functionalization or melting procedures (Figure 1B). These results are confirmed by UV–Vis–NIR spectroscopy (Figure 1C) where hybridized gold nanoprisms (dashed line) and the same nanoprism mixture after dehybridization by melting (black line), both exhibit the dipole (1250 nm) and quadrupole (800 nm) SPRs indicative of Au nanoprisms.[18] The observation that the nanoprism shape is maintained throughout these processes is significant, because surface reorganization at the high-energy vertices and edges has been observed previously for structures containing high-energy surface sites.[23,24]
The amount of DNA on the nanoprism surface was characterized in order to gain insight into the density of the DNA on the surface and, therefore, the extent of adsorption. If one uses simple geometry and assumes a flat surface on each of the nanoprism facets with a DNA-footprint of 15 nm2,[24] approximately 1200 HS-ssDNA molecules could adsorb per nanoprism, for a prism with 130 nm edge length and 7.5 nm thickness. To determine these loading values experimentally, we have developed a method that is complementary to our previous approach for pseudo-spherical particles,[25] but which takes into consideration the size distribution inherent in the nanoprism solutions. Because of the variation of particle extinction coefficients with particle size, this method uses inductively coupled plasma-mass spectrometry (ICP-MS), instead of UV–Vis extinction, to determine Au nanoprism concentration.[3] In a typical experiment, an aliquot of DNA-functionalized nanoprisms was centrifuged three times in washing buffer to remove excess DNA (3 min at 8,000 rpm, see Supporting Information). The supernatant was then removed and the pellet was resuspended in 20 μL of KCN (0.1 M) for 1 h in order to dissolve the Au and release the alkylthiolated DNA. An aliquot of this dissolved pellet was then analyzed by ICP-MS to determine gold concentration, and also analyzed by fluorescence using the Oligreen™ assay (Invitrogen, Inc.) to determine HS-ssDNA concentration. From these values the average surface coverage of DNA per nanoprism could be obtained (Table 1). Importantly, with a good histogram of prism edge lengths taken from TEM analysis of a large prism population, we can estimate the number of oligonucleotides for a given prism size (Supporting Information). Using this approach, we determined that nanoprisms with 130 nm edge lengths contain approximately 1550 DNA strands per prism on average, a value larger (~19.3%) than the predicted value based on a 15 nm2 DNA footprint.[26] This larger loading value is most likely due to the fact that the theoretical calculation does not take into consideration the portion of the prism at the edge between the side and triangular facets, the truncated and hexagonal nanoprisms in solution, and the effective curvature at those sites.
Table 1.
DNA loading on triangular Au nanoprisms and pseudo-spherical Au nanoparticles. Calculations are based on a 15 nm2 footprint for the DNA molecule on the gold nanoprisms surface and a 13 nm2 footprint for the 80 nm nanoparticles; these footprints account for the differences in surface curvature between the two structures and are based on literature values.[24,25]
| Loading at 1 h observed | Loading at 24 h observed | Full coverage theoretical | Side-only coverage theoretical | |
|---|---|---|---|---|
| 130 nm edge length nanoprisms | 484 ± 40.9 | 1550 ± 121 | 1198 | 195 |
| 150 nm edge length nanoprisms | 643 ± 54.5 | 2030 ± 166 | 1498 | 225 |
| 80 nm pseudo-spherical nanoparticles | 762 ± 8.91 | 1330 ± 40.3 | 1547 | – |
Interestingly, prisms reach their maximum loading after 24 h in excess HS-ssDNA and buffer for a constant ratio of nanoprisms to excess DNA concentrations. However, data obtained earlier in the functionalization procedure, for example, after only 1 h in excess DNA/buffer, show markedly lower loading values (Table 1). Therefore, the timescale of HS-ssDNA adsorption on the nanoprism surface was investigated and compared to the adsorption of HS-ssDNA on CTAB-stabilized 80 nm Au pseudo-spherical nanoparticles which have a surface area per particle on the order of an average nanoprism: 20 106 nm2 for an 80 nm spherical nanoparticle versus 22,860 nm2 for a 150 nm edge length triangular nanoprism; 17 560 nm2 for a 130 nm edge length triangular nanoprism (Figure 2). Interestingly, HS-ssDNA adsorption onto the nanoprism surface shows markedly different time dependence than that of the pseudo-spherical AuNP controls. These data suggest that it takes over 12 h to approach the theoretical HS-ssDNA loading maximum for Au nanoprisms, whereas maximum loading is achieved on pseudo-spherical NPs after only 6 h. We hypothesized that the slower adsorption may be a result of nanoparticle shape. The top triangular faces of the nanoprisms are {111}, and the side facet is a high-energy crystal facet that likely contains at least one twin plane.[19] The difference in surface energy of these two crystal faces may result in faster exchange at the higher-energy side crystal facet.[27] This property could then allow one to site-selectively functionalize Au nanoprism structures.
Figure 2.
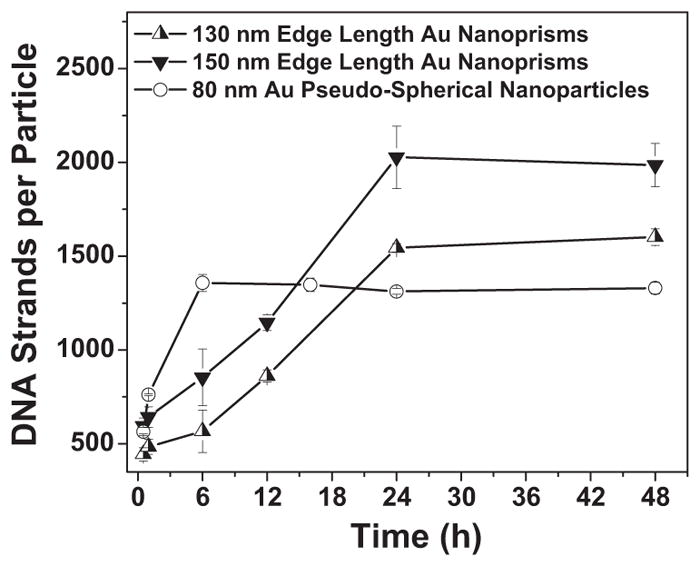
Correlation of time with DNA loading on nanoparticle surface (Error bars indicate five independent experiments).
To test this hypothesis, the location of DNA on the nanoprism surface was characterized at different functionalization time points. However, because nanoprisms are smaller than the wavelengths of visible light, optical microscopy-based techniques such as fluorescence could not provide the spatial resolution necessary to determine DNA location. We therefore first used TEM and asymmetrically functionalized AuNPs (AsyNPs)[28] to investigate the location of DNA on the nanoprism surface. Here, the pseudo-spherical AsyNPs are functionalized on one hemisphere with HS-ssDNA that is complementary to the DNA on the nanoprism, as well as another type of DNA on the hemisphere that is not complementary.[28] This asymmetric-functionalization allows one to use the AsyNPs as EM probes for HS-ssDNA on the nanoprism surface without inducing large scale, DNA-driven aggregation (Figure 3A–C). In a typical experiment, nano-prisms that have been functionalized with HS-ssDNA are removed from such modification solutions by centrifugation (after 4, 12, and 24 h of modification), washed, and combined with the AsyNP probes (Figure 3). At early functionalization time points, the probes bind only to the nanoprism side crystal facets. However, as functionalization time increases, more probes are observed on the nanoprism {111} broad, triangular faces. After 24 h, AsyNP probes can be observed coating the entire nanoprism surface. Additionally, EELS was used to determine the presence of phosphorous from both the center and sides of a single nanoprism structure (here phosphorous indicates the presence of DNA from the phosphodiester linkages of the DNA backbone). Results of this analysis indicate that, indeed, the side facets of the nanoprisms contain more DNA (as indicated by phosphorous EELS signal intensity) than the center of the nanoprism at short time points (Figure 3D).
Figure 3.
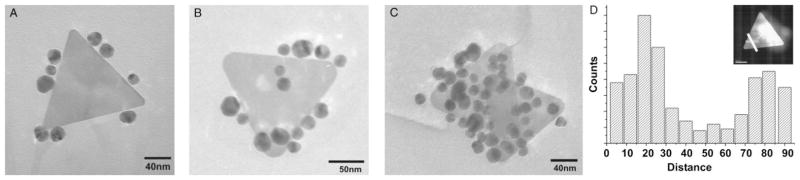
TEM images from experiments using asymmetrically functionalized AuNPs as surface functionalization probes. A) Nanoprisms functionalized for 4 h; B) 12 h; C) 24 h and then hybridized with AuNPs (13 nm) that were asymmetrically functionalized with complementary HS-ssDNA; D) Phosphorous EELS analysis of Au nanoprism surface. The graph shows the signal of phosphorous as a function of distance. Inset is a STEM image of the nanoprism analyzed; the white line indicates the area at which each spectrum was taken.
The ligand functionalization pattern observed in these experiments seems to be one in which DNA adsorbs to the side facets of the nanoprism surface first, slowly functionalizes the outer top surface, and finally the entire prism. This model is consistent with ligand adsorption theories proposed by Murray and co-workers who demonstrated that thiolated-ligand exchange on Au nanoparticles occurs fastest at crystal defect sites, and ligands adsorbed at these locations then migrate onto uniform crystal surfaces.[27] This theory is consistent with the observation that AuNP probes bind preferentially to the sides of the nanoprisms initially (where the number of edges and vertices is highest) and then slowly move from the edge to the center (Figure 3). The experiments with AsyNP probes also show that selectively functionalized prisms can be isolated at different time points. These site-selectively functionalized nanoprisms then represent powerful building blocks for nanoscale assemblies, with a type of valency that should allow for the use of multiple types of DNA links in a highly directional particle assembly scheme.[29]
Taken together, these results represent three advances for anisotropic colloidal nanoparticles. First, Au nanoprisms capped by CTAB can be fully functionalized with an alkylthiolated-DNA moiety, and the ligand-nanoprism conjugate is stable throughout DNA-based melting transitions. Second, DNA-functionalized anisotropic materials can exhibit cooperative melting behavior, similar to their isotropic counterparts. Finally, the inherent anisotropy of surface energetics in anisotropic colloidal particles can be exploited to achieve selective functionalization of the particle surface which has implications in fields ranging from materials design to catalysis.
Experimental Section
Preparation of functionalization buffers
All buffers were prepared using nuclease-free water and molecular biology grade chemicals obtained from Sigma–Aldrich, Inc. To adjust salt conditions in the DNA-nanoprism solutions, a variety of buffer solutions were prepared: a phosphate adjustment buffer (PB, 0.1 M, pH 7.0), a surfactant stock solution (0.1% SDS w/v), a salting buffer (2 M NaCl, pH 7.0), a disulfide cleavage buffer (0.17 M phosphate buffer, pH 8.0), a washing buffer (0.01 M phosphate buffer + 0.01% SDS, pH 7.0), and a hybridization/melting buffer (PBS, 0.01 M phosphate buffer + 0.15 M NaCl, pH 7.4).
Functionalization of Au nanoprisms
Prior to the functionalization of Au nanoprisms, the alkylthiol-functionalized DNA sequences (HS-ssDNA, Sequence A: 5-′ACT ATT GAT AAG GAT A10 SH 3′; Sequence B: 5′ATC CTT ATC AAT AGT A10 SH 3′) treated the oligonucleotides with 0.1 M dithiothreitol (DTT) in disulfide cleaving buffer (0.17 M, pH 8) for 1 h (typically, 4 μL of DTT solution for every 1 OD260 of DNA). The HS-ssDNA solution was purified from DTT using a desalting column (Nap-5, DNA grade, GE Healthcare). Au nanoprisms were purified from their reaction mixture by centrifugation (twice at 3 min at 8000 RPM, Eppendorf 5145D centrifuge) and resuspended in NANOpure™, nuclease-free water prior to functionalization (N.B. Au nanoprisms should not be stored in pure water for extended periods). The nanoprisms were functionalized by using modifications of literature procedures.[24] Briefly, 1.2 OD260 (3.65 μM) of purified HS-ssDNA was added to 1.0 OD1250 of Au nanoprisms and allowed to react while shaking (1100 rpm, 22 °C) for 30 min using an Eppendorf Thermomixer. The salt concentration of the solution was then increased (0.15 M NaCl, 0.01 M phosphates) in the presence of surfactant (0.01% sodium dodecyl sulfate) over a period of 2.5 h. Phosphate, surfactant, and NaCl concentrations were adjusted using stock solutions made from nuclease-free water and reagents (vide supra) where the phosphate and surfactant concentrations were adjusted first, and the total necessary volume of stock NaCl solution was divided into three aliquots, and each aliquot was added to the solution sequentially with 30 min between each addition. After the last salt addition, the solution was allowed to mix for an additional 30 min, at which point DNA adsorption to the nanoprism surface was monitored and marked as t0.
Hybridization and melting experiments
To prepare DNA-nanoprism conjugates for hybridization and melting experiments, the conjugates were first washed in order to remove excess, unbound DNA from solution. To wash, the mixture was centrifuged for 3 min at 8000 rpm (Eppendorf Model 5145D), the supernatant removed, and the pellet resuspended in washing buffer. This process was repeated three times. After the supernatant had been removed the third time, the pellet was resuspended in hybridization/melting buffer and combined with a DNA-nanoprism conjugate that contained a complementary DNA strand (prepared using the same washing procedure). DNA-nanoprism conjugates were hybridized using a 1:1 ratio of complementary-DNA functionalized nanoprisms as measured by OD1250. Melting profiles were obtained by heating the mixture from 25 to 75 °C at a rate of 0.25 °C min−1 using a Varian Cary 5000 Peltier temperature control system, while stirring.
Determining DNA loading on Au nanoprisms
To determine the number of oligonucleotides conjugated to the nanoprism surface, a two step method was used wherein the number of DNA strands were measured using a commercially available ssDNA quantifica-tion assay, and the Au nanoprism concentration was determined using ICP-MS. First, DNA-nanoprism conjugates were prepared and washed to remove excess and loosely bound DNA from solution. To wash the nanoprisms, the solution was centrifuged at 8000 rpm for 3 min (Eppendorf 5145D centrifuge) and the supernatant was removed. The pellet was resuspended in washing buffer, and this washing procedure was repeated four additional times. After the supernatant was removed the fifth time, the pellet was resuspended in 20 μL of 0.1 M aqueous solution of KCN and allowed to sit on the benchtop for 1 h. This process dissolves the Au nanoprism, but does not degrade the ssDNA. The resulting solution was then analyzed using the Quant-It ssDNA Assay with Oligreen® fluorophore (Invitrogen, Inc.) to determine the total number of DNA strands in solution, following the manufacturer protocol. Fluorescence was analyzed using a fluorescent plate reader (Photal Otsuka Electronics FluoDia T70, with excitation at 480 nm and emission at 520 nm).
Following this procedure, a 50 μmL aliquot of the Oligreen-analyzed sample was prepared for analysis by ICP-MS to determine the number of Au atoms. Briefly, an Au standard curve was prepared with values 1, 2, 5, 10, 25, 50, and 100 ppb Au in a matrix of 3% HNO3 (TraceUltra, Sigma–Aldrich) and 1 ppb In, as an internal standard. This matrix was also used to prepare the unknown Au samples. The number of gold atoms obtained by ICP-MS was converted into number of nanoprisms by using the relative frequency of nanoprism edge lengths (determined from a statistical analysis of nanoprism edge length as determined by TEM), the unit cell values of Au (a = 0.4080 nm, 4 atoms per cell, Vunit cell = 0.0679 nm3) and the geometry of the nanoprism. This method allowed a more accurate determination of nanoprism concentration in solution which was critical to obtaining reproducible DNA loading values. With the concentration of nanoprisms and oligonucleotides in hand, the number of oligonucleotides per nanoprism was calculated.
Supplementary Material
Acknowledgments
This work was supported by the ONR and AFOSR. CAM is also grateful for an NIH Director’s Pioneer Award and a NSSEF Fellowship. J. E. M. is grateful to Northwestern University for a Presidential Fellowship.
Footnotes
Supporting Information is available on the WWW under http://www.small-journal.com or from the author.
References
- 1.Henglein A. Chem Rev. 1989;89:1861. [Google Scholar]
- 2.Burda C, Chen X, Narayanan R, El-Sayed MA. Chem Rev. 2005;105:1025. doi: 10.1021/cr030063a. [DOI] [PubMed] [Google Scholar]
- 3.Kelly KL, Coronado E, Zhao LL, Schatz GC. J Phys Chem B. 2003;107:668. [Google Scholar]
- 4.Xue C, Li Z, Mirkin CA. Small. 2005;1:513. doi: 10.1002/smll.200400150. [DOI] [PubMed] [Google Scholar]
- 5.Rupprechter G, Unterhalt H, Morkel M, Galletto P, Hu LJ, Freund HJ. Surf Sci. 2002;502:109. [Google Scholar]
- 6.Zapol P, Curtiss LA. J Comput Theor Nanosci. 2007;4:222. [Google Scholar]
- 7.Kamat PV. J Phys Chem B. 2002;106:7729. [Google Scholar]
- 8.Daniel MC, Astruc D. Chem Rev. 2004;104:293. doi: 10.1021/cr030698+. [DOI] [PubMed] [Google Scholar]
- 9.Rosi NL, Giljohann DA, Thaxton CS, Lytton-Jean AKR, Han MS, Mirkin CA. Science. 2006;312:1027. doi: 10.1126/science.1125559. [DOI] [PubMed] [Google Scholar]
- 10.Rosi NL, Mirkin CA. Chem Rev. 2005;105:1547. doi: 10.1021/cr030067f. [DOI] [PubMed] [Google Scholar]
- 11.Dujardin E, Hsin LB, Wang CRC, Mann S. Chem Commun. 2001:1264. [Google Scholar]
- 12.Gole A, Murphy CJ. Langmuir. 2005;21:10756. doi: 10.1021/la0512704. [DOI] [PubMed] [Google Scholar]
- 13.Huang X, El-Sayed IH, Qian W, El-Sayed MA. J Am Chem Soc. 2006;128:2115. doi: 10.1021/ja057254a. [DOI] [PubMed] [Google Scholar]
- 14.Hirsch LR, Stafford RJ, Bankson JA, Sershen SR, Rivera B, Price RE, Hazle JD, Halas NJ, West JL. Proc Natl Acad Sci USA. 2003;100:13549. doi: 10.1073/pnas.2232479100. [DOI] [PMC free article] [PubMed] [Google Scholar]
- 15.Jin R, Cao Y, Mirkin CA, Kelly KL, Schatz GC, Zheng JG. Science. 2001;294:1901. doi: 10.1126/science.1066541. [DOI] [PubMed] [Google Scholar]
- 16.Malikova N, Pastoriza-Santos I, Schierhorn M, Kotov NA, Liz-Marzan LM. Langmuir. 2002;18:3694. [Google Scholar]
- 17.Ah CS, Yun YJ, Park HJ, Kim WJ, Ha DH, Yun WS. Chem Mater. 2005;17:5558. [Google Scholar]
- 18.Millstone JE, Park S, Shuford KL, Qin L, Schatz GC, Mirkin CA. J Am Chem Soc. 2005;125:5312. doi: 10.1021/ja043245a. [DOI] [PubMed] [Google Scholar]
- 19.Millstone JE, Metraux GS, Mirkin CA. Adv Funct Mater. 2006;16:1209. [Google Scholar]
- 20.Mirkin CA, Letsinger RL, Mucic RC, Storhoff JJ. Nature. 1996;382:607. doi: 10.1038/382607a0. [DOI] [PubMed] [Google Scholar]
- 21.Jin R, Wu G, Li Z, Mirkin CA, Schatz GC. J Am Chem Soc. 2003;125:1643. doi: 10.1021/ja021096v. [DOI] [PubMed] [Google Scholar]
- 22.Lytton-Jean AKR, Mirkin CA. J Am Chem Soc. 2005;127:12754. doi: 10.1021/ja052255o. [DOI] [PubMed] [Google Scholar]
- 23.Peng XG, Wickham J, Alivisatos AP. J Am Chem Soc. 1998;120:5343. [Google Scholar]
- 24.Chen SH, Carroll DL. Nano Lett. 2002;2:1003. [Google Scholar]
- 25.Hurst SJ, Lytton-Jean AKR, Mirkin CA. Anal Chem. 2006;78:8313. doi: 10.1021/ac0613582. [DOI] [PMC free article] [PubMed] [Google Scholar]
- 26.Herne TM, Tarlov MJ. J Am Chem Soc. 1997;119:8916. [Google Scholar]
- 27.Hostetler MJ, Templeton AC, Murray RW. Langmuir. 1999;15:3782. [Google Scholar]
- 28.Xu XY, Rosi NL, Wang YH, Huo FW, Mirkin CA. J Am Chem Soc. 2006;128:9286. doi: 10.1021/ja061980b. [DOI] [PMC free article] [PubMed] [Google Scholar]
- 29.Park SY, Lytton-Jean AKR, Lee B, Weigand S, Schatz GC, Mirkin CA. Nature. 2008;451:553. doi: 10.1038/nature06508. [DOI] [PubMed] [Google Scholar]
Associated Data
This section collects any data citations, data availability statements, or supplementary materials included in this article.