

Abstract
Objectives
Improved means to monitor and guide interventions could be useful in the intensive care unit (ICU). Metabolomic analysis with bioinformatics is used to understand mechanisms and identify biomarkers of disease development and progression. This pilot study evaluated plasma 1H-NMR spectroscopy as a means to monitor metabolism following albumin administration in acute lung injury (ALI) patients.
Design
This study was conducted on plasma samples from 6 albumin-treated and 6 saline-treated patients from a larger double-blind trial. The albumin group was administered 25 g of 25% human albumin in 0.9% saline every 8 h for a total of 9 doses over 72 h. 0.9% saline was used as placebo. Blood samples were collected immediately prior to, 1 h after and 4 h after the albumin/saline administration for the 1st, 4th, and 7th doses (first dose of each day for 3 days). Samples were analyzed by 1H-NMR spectroscopy, and spectra were analyzed by principal component analysis and biostatistical methods.
Measurements and Main Results
After 1 day of albumin therapy, changes in small molecules, including amino acids and plasma lipids, were evident with Principal Component Analysis (PCA). Differences remained 3 days after the last albumin administration. Analysis of data along with spectra from healthy controls showed that patients receiving albumin had a trajectory toward the spectra observed in healthy individuals while placebo controls did not.
Conclusions
The data suggest that metabolic changes detected by 1H-NMR spectroscopy and bioinformatics tool may be useful approach to clinical research especially in acute lung injury.
Keywords: albumin, acute lung injury, metabolomics, 1H-NMR, human plasma
Introduction
Acute lung injury (ALI) and its more severe counterpart, acute respiratory distress syndrome (ARDS) are among the most common conditions encountered in the intensive care unit (ICU) (1, 2). In patients with sepsis, hypoproteinemia is a predictor of the development of ALI and subsequent clinical outcomes, including elevated hydrostatic pressures, fluid retention and weight gain, which are associated with mortality (3, 4). Fluid restrictive strategies and diuretics (e.g., furosemide) are effective reducing the duration of mechanical ventilation (5) and the addition of albumin to furosemide therapy in hypoproteinemic patients with ALI significantly improves oxygenation, net fluid balance and hemodynamic stability (6, 7). However, therapeutic responses are not uniform and the mechanisms underlying any benefit remain unknown (8). Additional means to predict responses, monitor status and improve outcomes are needed.
Metabolic profiling methods could be useful in the ICU by providing means to identify and quantify metabolomic characteristics in plasma to guide clinical care (9). Among the profiling methods available, proton nuclear magnetic resonance (1H-NMR) spectroscopy is attractive because it can provide rapid analysis of metabolites in plasma with minimal sample preparation (10–13) using biofluids, tissue and cell extracts, and other biological source materials. For example, Saude et al found that metabolic profiling of urine determined by 1H-NMR correlated with the presence and magnitude of airway dysfunction in an asthma model using guinea pigs (9). Available data on metabolomics methods and results to date suggest that 1H-NMR metabolomics analysis of human plasma may be a noninvasive diagnostic method to combine with responses to specific treatment in changing critically ill patients. (14–16).
The present research was designed as a pilot study to evaluate metabolic effects in the ICU using 1H-NMR spectroscopy of plasma. In this study, we investigated plasma metabolic changes in response to protocolized albumin administration in ALI patients receiving concomitant furosemide therapy (7). We hypothesized that 1H-NMR spectroscopy with PCA would detect differences in metabolic parameters that were not apparent in standard clinical laboratory parameters in response to albumin versus control group responses.
Materials and Methods
Human Subjects
This pilot study was performed on a subset of plasma samples from a randomized, controlled trial in 11 medical, surgical and trauma intensive care units within two university hospital systems, for which the details of study design and clinical outcomes have been previously reported (7). Briefly, mechanically ventilated hypoproteinemic patients meeting the American-European consensus definition of ALI (17) were treated with continuous infusion furosemide and randomized to receive 100cc or either 25% human albumin or 0.9% saline intravenously every 8 hours for a total of 9 doses over 72 hours (Figure 1). This pilot study was conducted on a subset of 6 albumin-treated and 6 saline-treated patients, from whom blood samples were collected immediately prior to, 1 hour after and 4 hours after the albumin/saline administration every 8 hours over three days. For example, the 1st, 4th, and 7th doses were the first dose of each day for 3 days. The study was reviewed and approved by the Institutional Review Boards of Emory University and Vanderbilt University. For a healthy group, 8 subjects were recruited and studied as previously described {Park, 2009 #309}. The detailed information about participants in this study was described in Table 1.
Figure 1. Experimental design to measure effects of albumin treatment in acute lung injury.
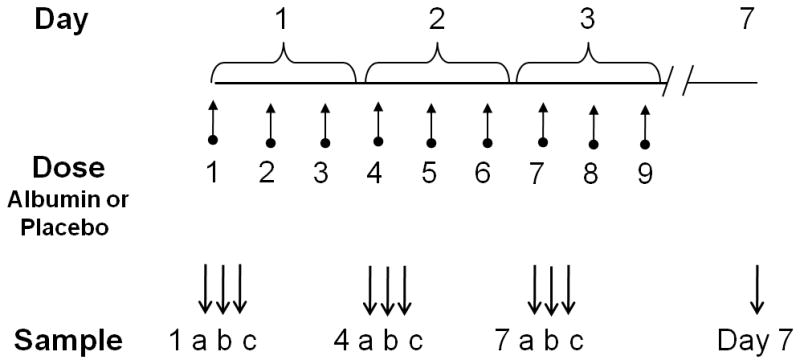
Twelve mechanically ventilated patients with ALI/ARDS whose serum total protein concentrations were <6 g/dL were studied. Patients were equally randomly allocated to receive furosemide with albumin or furosemide with placebo for 72 h. Each patient was administered albumin or placebo every 8 h for a total of 9 doses indicated by upward arrows. Blood samples (a, b and c) were collected surrounding the 1st (Day 1), 4th (Day 2), and 7th (Day 3) doses, immediately prior to, 1 h after and 4 h after the albumin/placebo administration as indicated by the downward arrows. A sample was also collected in the morning on Day 7, i.e., 3 d after the last dose.
Table 1.
Individual characteristics
| Age | Sex | Predisposing Insult | BMI | |
|---|---|---|---|---|
| Placebo | 47 | M | Pneumonia | 19.7 |
| 49 | F | Transfusion | 25.5 | |
| 54 | F | Pneumonia | 26.7 | |
| 70 | F | Sepsis | 29.9 | |
| 71 | M | Sepsis | 27.3 | |
| 82 | F | Sepsis | 25.1 | |
| X=62 ± 6 | X=25.7 ± 1.4 | |||
| Albumin | 21 | F | Sepsis | 21.5 |
| 53 | F | Pneumonia | 36.0 | |
| 64 | F | Pneumonia | 35.0 | |
| 67 | F | Sepsis | 35.4 | |
| 76 | M | Pneumonia | 21.6 | |
| 82 | F | Sepsis | 24.7 | |
| X=60 ± 9 | X=29.0 ± 2.9 | |||
| Healthy | 22 | F | 25.6 | |
| 23 | M | 27.5 | ||
| 45 | F | 24.6 | ||
| 25 | M | 22.2 | ||
| 75 | M | 27.3 | ||
| 79 | M | 32.6 | ||
| 83 | F | 27.6 | ||
| 81 | M | 28.2 | ||
| X=54 ± 10 | X=27.0 ± 1.0 |
Sampling and analyses
Blood samples were collected, processed and plasma stored as previously described (10). Samples from 10 time points were available for analysis from each patient’s 7 day study period. Plasma samples were prepared and 1H-NMR spectra were measured at 600 MHz on a Varian INOVA 600 spectrometer under conditions where stability and reproducibility of the NMR analysis were previously established (10). Preprocessing of 1H-NMR spectra was performed to provide baseline-corrected, aligned and normalized spectra containing 11,708 data points as previously described (10).
Bioinformatics and Statistics
Data dimensionality reduction by PCA was performed after centering the mean of each variable or using variance scaling {Craig, 2006 #321; van den Berg, 2006 #356}, to improved detection of contributions due to low abundance metabolites using Pirouette software (Infometrix, Bothell, WA)(18). In particular, mean-centered data are used in a way that spectral data can be given a mean of zero by subtracting the mean of spectral intensities from entries of spectral intensities at a given point (mean-centering) (19). Second, spectral data can be scaled so that each spectral frequency has unit variance, achieved by dividing each intensity by the standard deviation of spectral data (18). If the data are mean centered, a chemical shift with a large intensity gets a large initial variance whereas a chemical shift with a small peak will get a small variance. Then, since PCA is a maximum variance projection method, the results are biased toward high abundance features. In the case of plasma with these parameter settings, this biases PCA results toward lipid signals. With variance scaling, each intensity on all spectral points is pre-processed so that the each intensity becomes equally important. Therefore, variance scaling removes the dependence of the different levels of the intensities on the metabolic parameters and concentrates the relevant information into the same range for all the variables. Because the latter was more informative, all of the data presented used variance scaling except as indicated.
For PCA, 11,708 frequencies were reduced to see the metabolic profiles for the 12 subjects at each of the 10 time points. Three-dimensional PCA-scores and loading plots with mean-centered or variance scaling were used to visualize patterns and discriminatory factors associated with albumin. Some spectral regions, which were found to contribute to separation by PCA or were known to be characteristic of known plasma metabolites {Nicholson, 1995 #102; Soininen, 2009 #340; Weljie, 2006 #279}, were analyzed by a mixed model repeated measures ANOVA to determine the effect of albumin, time and interaction of albumin and time. Subsequently, 2-sample t tests for each frequency was used to find the significant regions that discriminated due to albumin at p < 0.05.
Results
Subject characteristics
The 12 patients consisted of 9 females and 3 males, with 4 females and 2 males receiving placebo and 5 females and 1 male receiving albumin (Table 1). The mean age for the placebo group was 62 ± 6 years (mean ± SEM), while that for the albumin group was 60 ± 9 years. The placebo and albumin group had similar BMI (25.7 ± 1.4 and 29.0 ± 2.9, respectively) and each group had 3 patients with sepsis as the cause of ALI. For comparison of the metabolic profiles of ICU patients to normal individuals, data were included for fasting samples from a separate study of healthy individuals (10). This group included 3 females and 5 males with a mean age of 54 ± 10 years (Table 1). BMI for this group was 27.0 ± 1.1. These individuals had no known acute or chronic disease, were not on prescription medications and were equilibrated for 3 days to a standardized diet meeting or exceeding nutritional requirements.
PCA of all samples
To determine whether samples separated according to albumin treatment, an analysis was performed with all available 105 spectra in which samples were coded according to baseline (green), placebo (blue) or albumin (red), where the initial sample from each patient taken before the first placebo or albumin treatment was considered baseline, and all samples collected after the first dose were coded as either albumin or placebo. After mean centering, 90% of the variance was represented in the first 3 principal components (PC). The placebo group did not separate from the baseline samples, while there was partial separation of the albumin group from both the baseline and placebo samples in the first day. (Figure 2A). Data from the corresponding loading plot showed that the spectral region at 0.66 associated with the HDL fraction of plasma lipid contributed to the separation (data not shown).
Figure 2. PCA of 1H-NMR spectra of plasma samples from albumin- or placebo-treated acute lung injury patients.
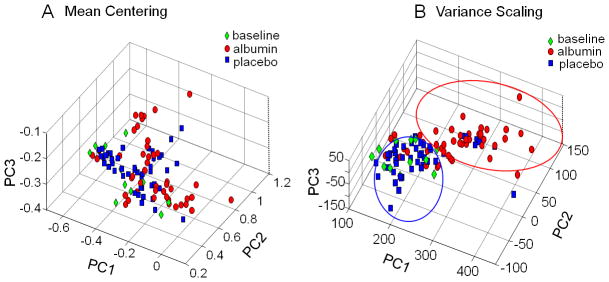
Samples were color-coded green for the baseline samples taken on Day 1 just prior to the first dose of albumin or placebo. Samples from patients after receiving albumin are color-coded red and those receiving placebo are color-coded blue. A. PCA of mean-centered data, where the first 3 Principal Components (PC) accounted for 90% of the variance, showed some separation according to albumin treatment. This analysis is biased toward high abundance features, and the corresponding loading plot showed that lipids, which have a relatively high abundance in the 1H-NMR spectrum. B. Better separation by PCA was obtained following variance scaling to reduce bias toward high-abundance signals. The corresponding loading plot showed that spectral regions associated with lipids and amino acids contributed to the separation.
To account for the high abundance lipid fractions in plasma analyzed by 1H-NMR spectroscopy with the data acquisition protocol and PCA of mean-centered data, PCA was also performed after adjusting variance for all of the spectral regions to enhance sensitivity for detecting contributions due to lower abundance metabolites. With variance-adjusted data, 97% of the variance was present in the first 3 PCs; placebo samples did not separate from baseline while albumin samples showed almost complete separation from both baseline and placebo samples (Figure 2B). Data from the loading plot showed that additional contribution to separation was present from spectral regions at 3.46 and 3.72 ppm, regions which are associated with amino acids. Consequently, the data show that 1H-NMR spectra of plasma from albumin-treated ICU patients are largely separated in the first day from baseline and placebo-treated patients and that variance scaling prior to analysis improves separation.
Time-dependent differences due to albumin treatment
Analysis of data for the 3 sample collections on the first day of treatment showed no separation by PCA analysis (Figure 3A). However, by Day 2, there was clear separation of samples with albumin from without albumin (Figure 3B) and this was maintained on Day 3 (Figure 3C). Data from corresponding loading plots are summarized in Table 2. A signal at 2.89 which has been associated with lysyl moiety of albumin contributed to separation on Days 2 and 3. This signal also contributed to separation when Day 2 and 3 data were analyzed by a supervised PLS-DA (partial least square-discriminant analysis; data not shown). As with PCA analysis, no separation was observed for Day 1. Together, the data show that the 3 doses/day of 25 g of 25% human serum albumin is only sufficient to produce detectable changes after at least one day of treatment.
Figure 3. PCA of samples according to day of treatment.
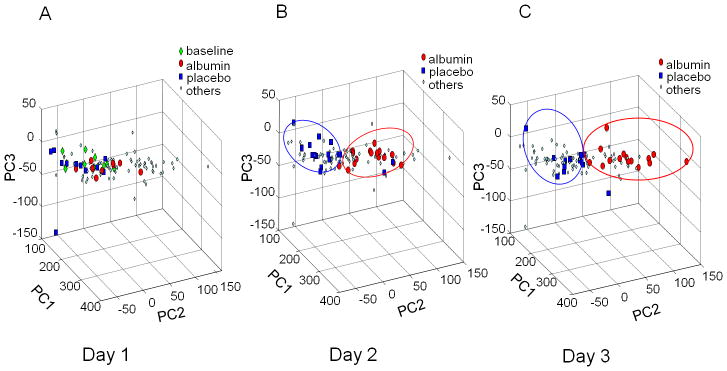
All samples were plotted in A–C. A. On Day 1, there was no separation of albumin-treated (red) or placebo-treated (blue) samples from the baseline samples (green) taken before initiation of treatment. The samples of other days were color-coded cyan. B. On Day 2, samples from albumin-treated patients were clearly separated from placebo-treated patients. C. On Day 3, samples from albumin-treated patients were separated from placebo-treated patients. Data were analyzed with variance scaling.
Table 2.
Discriminatory regions of 1H-NMR spectroscopy of plasma from albumin- and placebo-treated patients with acute lung injury as identified by the loading plots of PCA.
| PPM | Associated metabolites | Day 1 | Day 2 | Day 3 |
|---|---|---|---|---|
| 0.66 | HDL | − | + | + |
| 0.91,0.93 | Cholesterol lipid | − | + | + |
| 0.97,1.02 | Valine | − | + | + |
| 1.00 | Isoleucine | − | + | + |
| 1.25,1.29 | LDL, VLDL | − | − | + |
| 1.46 | Alanine | − | − | + |
| 2.08,2.09 | Glutamine, glutamate | − | − | − |
| 2.89 | Albumin (Lysyl) | − | + | + |
| 5.23 | Glucose | − | − | − |
| 7.77 | 1-Methylhistidine | − | − | − |
Loading plots associated with PCA shown in Figure 3 provided information with discriminatory regions of the spectra as identified by a plus(+) sign. Where no discrimination was observed, a minus (−) sign is indicated. There was no separation on Day 1. Days 2 and 3 showed separation by PCA. A contribution to separation was also observed for the spectral region 3.25 to 3.40 ppm containing signals from many amino acids and glucose. Consequently data were examined for contributions from glutamine, glutamate, glucose and 1-methylhistidine, but these did not appear to contribute to separation.
Analysis of corresponding loading plots (Table 2) showed that spectral regions associated with HDL (0.66 ppm) and cholesterol lipid (0.91, 0.93 ppm) contributed to separation on Days 2 and 3 while LDL+VLDL (1.25, 1.29 ppm) also contributed to separation on Day 3. Spectral regions at 0.97 and 1.02 ppm associated with valine, and at 1.00 ppm associated with isoleucine, also contributed to separation on Days 2 and 3. A region at 1.46 ppm associated with alanine contributed to separation on Day 2. Additional contribution to separation was apparent at 3.25–3.27, 3.29, 3.72, 3.74, 3.86 and 3.89–3.90 ppm; however, these regions have extensive overlap of signals from many amino acids and glucose. In examining this data, no evidence was present for contribution of the signal at 5.23 ppm, which is associated with glucose only, suggesting that glucose was not the feature to discriminating groups. Similarly, no evidence was present from the loading plots for contributions from signals at 2.08 and 2.09, associated with glutamine and glutamate. Thus, PCA shows that signals associated with lipids and amino acids contribute to separation of the metabolic profiles observed by 1H-NMR spectroscopy of plasma from albumin-treated ICU patients with ALI.
Spectral differences 3 d after last albumin treatment
To determine whether spectral changes remained after albumin treatment, spectra were compared for Day 7 and baseline (measurement on Day 1 prior to first albumin administration). Results from unsupervised PCA showed that spectra from albumin-treated patients separated from baseline while those from placebo-treated patients did not (Figure 4).
Figure 4. PCA of 1H-NMR spectral data for albumin-treated patients on Day 7 compared to baseline samples taken before the first albumin or placebo treatment.
Samples were color coded green for baseline, blue for placebo and black for albumin on Day 7. Results showed that 3 days after last albumin treatment, metabolic differences showed a trend in patients receiving albumin. Corresponding plot for patients receiving placebo showed no separation. Data were analyzed with mean centered.
Analysis of metabolic trajectory relative to archival spectra of healthy individuals
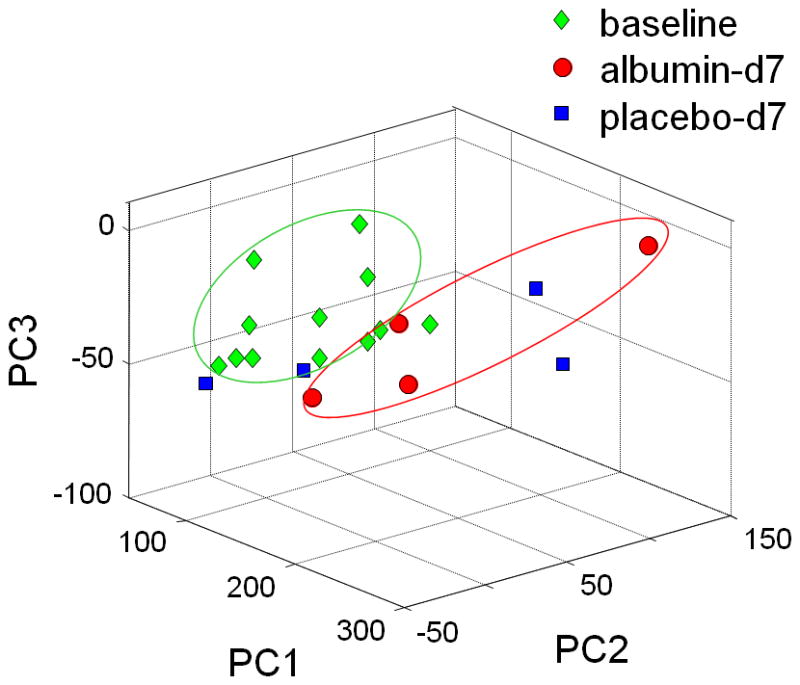
To examine whether albumin therapy improved the metabolic trajectory toward normal plasma 1H-NMR spectra, data were compared to spectra of 0830 time point from a previous study of 8 healthy individuals (10). Results of PCA showed that ICU patients before treatment were separated from the healthy individuals (Figure 5). Individuals treated with albumin had a time-dependent trajectory toward the healthy subjects while those receiving placebo did not (Figure 5).
Figure 5. 1H-NMR spectra of plasma from albumin-treated patients shows a trajectory toward spectra obtained from healthy individuals.
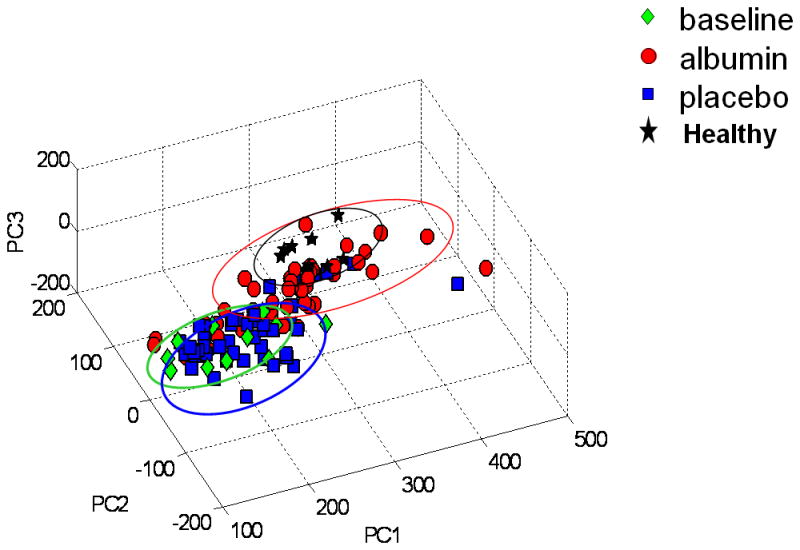
PCA of plasma obtained at baseline (green), in patients after receiving placebo (blue), and patients after receiving albumin (red) were combined with data obtained from fasting, healthy individuals after equilibration to a nutritionally adequate diet (black). Results show that albumin treatment resulted in a trajectory from the baseline conditions toward the healthy profiles. Data were analyzed with variance scaling.
Albumin-dependent variation in selected spectral regions
To more specifically examine selected spectral regions for possible use to monitor metabolic changes in the ICU, regions which were discriminatory in the above analyses and regions associated with common metabolites were further studied (Figure 6). Results showed that time-dependent effects were apparent in the 0.66 ppm region as measured by repeated measures ANOVA (Figure 6A). Albumin-dependent effects were not significant, and t-tests on individual time points showed significant difference at only 1 time point on Day 2. Similarly, analyses of the spectral regions associated with LDL and VLDL showed no significant effects associated with albumin treatment (Figure 6B). The region associated with lactate showed no significant effects with albumin (Figure 6C). Spectral regions associated with isoleucine, valine alanine and 1-methylhistidine showed significant differences with time and with albumin at some time points (Figure 6D–G). In contrast, spectral regions associated with glutamine and glutamate did not vary significantly with time or albumin treatment (Figure 6H). The glucose signal did not vary significantly by time (Figure 6I). The signal associated with the lysyl group of albumin differed significantly due to albumin treatment only at the last time point on Day 3 (Figure 6J).
Figure 6. Comparison of selected 1H-NMR spectral regions between albumin- and placebo-treated patients.

Analyses were performed on spectral regions which contributed to separation in PCA analyses and also some selected regions associated with plasma metabolites of interest. Spectral peaks were integrated and analyzed by repeated measures ANOVA. Open circle represented albumin treated group and close circle was placebo group. Results for albumin effects, time effects and albumin*time effects are given with panel descriptions. Because this was a pilot study and specific time-dependent differences were of interest, t-tests for specific sample times were performed and significance at p < 0.05 are identified in the panels by an asterisk (*). A. 0.66 ppm, HDL; albumin (p=0.46), time <0.05 and albumin*time (p=0.09). B. 1.25,1.29 ppm, LDL, VLDL; albumin (p=0.67), time (p=0.49) and albumin*time (p=0.49). C. 1.33 ppm, lactate; albumin (p=0.39), time (p=0.063) and albumin*time (p=0.26). D. 1.00 ppm, isoleucine; albumin (p=0.34), time <0.05 and albumin*time (p=0.50). E. 0.97,1.02 ppm, valine; (p=0.32), time <0.05 and albumin*time (p=0.46). F. 1.46 ppm, alanine; albumin (p=0.28), time <0.05 and albumin*time (p=0.36). G. 7.77 ppm, 1-methylhistidine (Me-His); albumin (p=0.057), time <0.05 and albumin*time (p=0.10). H. 2.08,2.09 ppm, glutamine, glutamate (Gln, Glu); albumin (p=0.45), time (p=0.23) and albumin*time (p=0.43). I. 5.23 ppm, glucose; albumin (p=0.35), time (p=0.43) and albumin*time (p=0.40). J. 2.89 ppm, albumin (lysyl) (Albumin-lys); albumin (p=0.30), time (p=0.11) and albumin*time (p=0.40).
Discussion
This work is to characterize metabolic patterns that are detectable with highly accurate 1H-NMR spectroscopy in critically ill patients and to associate these changes with a specific pharmacological intervention (20–23). In the previous work by Stringer et al. {Stringer, #355} showed that quantitative metabolomics was considered as a useful approach for the discovery of clinically relevant biomarkers in sepsis-induced ALI. This study from which the current samples were derived showed that blood albumin levels normalized and oxygenation improved with albumin treatment compared to saline-treated patients (7) consistent with the increase in albumin measured by 1H-NMR spectroscopy. Additional analyses from that study showed an increase in protein thiol (24), which is also consistent with the current study because albumin is the major thiol in human plasma.
Despite the reported beneficial effects of albumin treatment in hypoproteinemic ALI patients, the therapy is relatively costly and not uniformly beneficial. Thus, an individualized a priori assessment of potential benefit and the ability to monitor the biological response would improve medical care. The present study shows that with proper development, 1H-NMR spectroscopy may introduce to characterize systemic metabolic responses {Soininen, 2009 #340} (and identify patients unique response to pharmacologic therapy and thus to optimize benefit while reducing healthcare costs (25). These pilot data may be used to design trials that will develop algorithms using spectral patterns or selected spectral regions to optimize therapeutic efficacy by predicting the response to intervention. Moreover, the progressive trajectory of albumin-treated patients toward a normal healthy metabolic profile suggests that the method could be of utility in the general assessment of recovery from critical illness towards normal.
The most discriminatory regions by PCA consisted of parts of the spectra in which amino acids, glucose and other metabolites are present. While these cannot be resolved at present, the glucose signal can be corrected by measurement of glucose in other regions in order to enhance its predictive value. Spectral signals in other regions can be more reliably attributed to specific amino acids, such as regions associated with valine, isoleucine, alanine (possibly related to albumin catabolism to constituent amino acids) and 1-methylhistidine (a product of skeletal muscle protein breakdown). Interestingly, although the signal associated with glutamine and glutamate did not differ according to albumin treatment, the present study shows these constituents can be detected by 1H-NMR spectroscopy. Because glutamine is an anabolic amino acid and is beneficial in select critically ill patients (26), it is a high interest target for application of metabolomics analysis of the inevitable nutritional imbalance of critical illness.
Commercially available flow-through NMR spectrometers are available which could be used for applications informed by this pilot study. A method using this approach has been approved by the US Food and Drug Administration for measurement of blood lipids, and the present study suggests that lipid regions could be used in future studies as a means to monitor health status and progress in the ICU. Impediments to this development include proof that the metabolic profile reflects a biological response to treatment, and not simply indicating the treatment itself, and developing the early predictive potential for metabolomic profiling. Because of the limited size of this pilot study and the relatively large inter-individual variations, no clinical correlations were attempted in this analysis, although the results suggest that studies should be performed using 1H-NMR spectroscopy to test for metabolic markers of clinical outcome.
Conclusions
In summary, the present pilot study showed that 1H-NMR spectroscopy may be useful to evaluate the effects due to albumin therapy on plasma metabolites in critically ill patients with ALI. If effective, metabolomic profiling may permit more focused trials in ALI patients, particularly with a better assessment of therapeutic effects (27). This offers the more general benefit of is particularly important. The most sensitive signals appear to be linked to increases in amino acid concentrations, possibly due to albumin and endogenous protein catabolism. Increased signal associated with albumin itself was detected and changes in lipids were also present. In principle, algorithms could be developed for use with commercially available instrumentation to provide improved criteria to guide diagnostics and prognostics, a wide variety of medical treatments, and pharmacological dosing strategies in critically ill patients.
Acknowledgments
Sources of support: This research was supported by NIH grants P50 AA013757 (YP, DPJ, GSM), K23 HL067739 (GSM), K24 RR023356 (TRZ), R03 DK066008 (DPJ) and U54 RR024380 (TRZ, DPJ, GSM), as well as the Woodruff Foundation and the Emory-Georgia Tech Center for Health Discovery and Well-Being.
Footnotes
The work performed was at Clinical Biomarkers Laboratory, Division of Pulmonary, Allergy and Critical Care Medicine, Department of Medicine, Emory University School of Medicine, Atlanta, GA 30322
The authors have not disclosed any potential conflicts of interest.
References
- 1.Matthay MA, Idell S. Update on acute lung injury and critical care medicine 2009. Am J Respir Crit Care Med. 2010;181(10):1027–1032. doi: 10.1164/rccm.201001-0074UP. [DOI] [PMC free article] [PubMed] [Google Scholar]
- 2.Ware LB, Matthay MA. The acute respiratory distress syndrome. N Engl J Med. 2000;342(18):1334–1349. doi: 10.1056/NEJM200005043421806. [DOI] [PubMed] [Google Scholar]
- 3.Arif SK, Verheij J, Groeneveld AB, et al. Hypoproteinemia as a marker of acute respiratory distress syndrome in critically ill patients with pulmonary edema. Intensive Care Med. 2002;28(3):310–317. doi: 10.1007/s00134-002-1220-y. [DOI] [PubMed] [Google Scholar]
- 4.Mangialardi RJ, Martin GS, Bernard GR, et al. Hypoproteinemia predicts acute respiratory distress syndrome development, weight gain, and death in patients with sepsis. Ibuprofen in Sepsis Study Group. Crit Care Med. 2000;28(9):3137–3145. doi: 10.1097/00003246-200009000-00001. [DOI] [PubMed] [Google Scholar]
- 5.Wiedemann HP, Wheeler AP, Bernard GR, et al. Comparison of two fluid-management strategies in acute lung injury. N Engl J Med. 2006;354(24):2564–2575. doi: 10.1056/NEJMoa062200. [DOI] [PubMed] [Google Scholar]
- 6.Martin GS, Ely EW, Carroll FE, et al. Findings on the portable chest radiograph correlate with fluid balance in critically ill patients. Chest. 2002;122(6):2087–2095. doi: 10.1378/chest.122.6.2087. [DOI] [PubMed] [Google Scholar]
- 7.Martin GS, Moss M, Wheeler AP, et al. A randomized, controlled trial of furosemide with or without albumin in hypoproteinemic patients with acute lung injury. Crit Care Med. 2005;33(8):1681–1687. doi: 10.1097/01.ccm.0000171539.47006.02. [DOI] [PubMed] [Google Scholar]
- 8.Evidence-based colloid use in the critically ill: American Thoracic Society Consensus Statement. Am J Respir Crit Care Med. 2004;170(11):1247–1259. doi: 10.1164/rccm.200208-909ST. [DOI] [PubMed] [Google Scholar]
- 9.Saude EJ, Obiefuna IP, Somorjai RL, et al. Metabolomic biomarkers in a model of asthma exacerbation: urine nuclear magnetic resonance. Am J Respir Crit Care Med. 2009;179(1):25–34. doi: 10.1164/rccm.200711-1716OC. [DOI] [PubMed] [Google Scholar]
- 10.Park Y, Kim SB, Wang B, et al. Individual variation in macronutrient regulation measured by proton magnetic resonance spectroscopy of human plasma. Am J Physiol Regul Integr Comp Physiol. 2009;297(1):R202–209. doi: 10.1152/ajpregu.90757.2008. [DOI] [PMC free article] [PubMed] [Google Scholar]
- 11.Beckonert O, Keun HC, Ebbels TM, et al. Metabolic profiling, metabolomic and metabonomic procedures for NMR spectroscopy of urine, plasma, serum and tissue extracts. Nat Protoc. 2007;2(11):2692–2703. doi: 10.1038/nprot.2007.376. [DOI] [PubMed] [Google Scholar]
- 12.Bollard ME, Stanley EG, Lindon JC, et al. NMR-based metabonomic approaches for evaluating physiological influences on biofluid composition. NMR Biomed. 2005;18(3):143–162. doi: 10.1002/nbm.935. [DOI] [PubMed] [Google Scholar]
- 13.Cho HW, Kim SB, Jeong MK, et al. Discovery of metabolite features for the modelling and analysis of high-resolution NMR spectra. Int J Data Min Bioinform. 2008;2(2):176–192. doi: 10.1504/ijdmb.2008.019097. [DOI] [PMC free article] [PubMed] [Google Scholar]
- 14.Nicholson JK, Foxall PJ, Spraul M, et al. 750 MHz 1H and 1H-13C NMR spectroscopy of human blood plasma. Anal Chem. 1995;67(5):793–811. doi: 10.1021/ac00101a004. [DOI] [PubMed] [Google Scholar]
- 15.Slupsky CM, Rankin KN, Wagner J, et al. Investigations of the effects of gender, diurnal variation, and age in human urinary metabolomic profiles. Anal Chem. 2007;79(18):6995–7004. doi: 10.1021/ac0708588. [DOI] [PubMed] [Google Scholar]
- 16.Soininen P, Kangas AJ, Wurtz P, et al. High-throughput serum NMR metabonomics for cost-effective holistic studies on systemic metabolism. Analyst. 2009;134(9):1781–1785. doi: 10.1039/b910205a. [DOI] [PubMed] [Google Scholar]
- 17.Bernard GR, Artigas A, Brigham KL, et al. The American-European Consensus Conference on ARDS. Definitions, mechanisms, relevant outcomes, and clinical trial coordination. Am J Respir Crit Care Med. 1994;149(3 Pt 1):818–824. doi: 10.1164/ajrccm.149.3.7509706. [DOI] [PubMed] [Google Scholar]
- 18.van den Berg RA, Hoefsloot HC, Westerhuis JA, et al. Centering, scaling, and transformations: improving the biological information content of metabolomics data. BMC Genomics. 2006;7:142. doi: 10.1186/1471-2164-7-142. [DOI] [PMC free article] [PubMed] [Google Scholar]
- 19.Craig A, Cloarec O, Holmes E, et al. Scaling and normalization effects in NMR spectroscopic metabonomic data sets. Anal Chem. 2006;78(7):2262–2267. doi: 10.1021/ac0519312. [DOI] [PubMed] [Google Scholar]
- 20.Brindle JT, Antti H, Holmes E, et al. Rapid and noninvasive diagnosis of the presence and severity of coronary heart disease using 1H-NMR-based metabonomics. Nat Med. 2002;8(12):1439–1444. doi: 10.1038/nm1202-802. [DOI] [PubMed] [Google Scholar]
- 21.Coen M, Holmes E, Lindon JC, et al. NMR-Based Metabolic Profiling and Metabonomic Approaches to Problems in Molecular Toxicology. Chem Res Toxicol. 2008 doi: 10.1021/tx700335d. [DOI] [PubMed] [Google Scholar]
- 22.Davis CD, Milner JA. Biomarkers for diet and cancer prevention research: potentials and challenges. Acta Pharmacol Sin. 2007;28(9):1262–1273. doi: 10.1111/j.1745-7254.2007.00678.x. [DOI] [PubMed] [Google Scholar]
- 23.de Graaf RA, Behar KL. Quantitative 1H NMR spectroscopy of blood plasma metabolites. Anal Chem. 2003;75(9):2100–2104. doi: 10.1021/ac020782+. [DOI] [PubMed] [Google Scholar]
- 24.Quinlan GJ, Mumby S, Martin GS, et al. Albumin influences total plasma antioxidant capacity favorably in patients with acute lung injury. Crit Care Med. 2004;32(3):755–759. doi: 10.1097/01.ccm.0000114574.18641.5d. [DOI] [PubMed] [Google Scholar]
- 25.Pene F, Courtine E, Cariou A, et al. Toward theragnostics. Crit Care Med. 2009;37(1 Suppl):S50–58. doi: 10.1097/CCM.0b013e3181921349. [DOI] [PubMed] [Google Scholar]
- 26.Ziegler TR. Parenteral nutrition in the critically ill patient. N Engl J Med. 2009;361(11):1088–1097. doi: 10.1056/NEJMct0806956. [DOI] [PMC free article] [PubMed] [Google Scholar]
- 27.Spragg RG, Bernard GR, Checkley W, et al. Beyond mortality: future clinical research in acute lung injury. Am J Respir Crit Care Med. 2010;181(10):1121–1127. doi: 10.1164/rccm.201001-0024WS. [DOI] [PMC free article] [PubMed] [Google Scholar]