

Abstract
Neuroblastoma arises from sympathoadrenal progenitors of the neural crest and expression of the neurotrophin receptor TrkB and its ligand, brain-derived neurotrophic factor (BDNF) is correlated with poor prognosis. Although activated TrkB signaling promotes a more aggressive phenotype in established neuroblastoma cell lines, whether TrkB signaling is sufficient to transform neural crest derived cells has not been investigated. To address the role of TrkB signaling in malignant transformation, we removed two immunoglobulin-like domains from the extracellular domain of the full length rat TrkB receptor to create a ΔIgTrkB that is constitutively active. In the pheochromocytoma-derived cell line PC12, ΔIgTrkB promotes differentiation by stimulating process outgrowth; however, in the rat neural crest derived cell line NCM-1, ΔIgTrkB signaling produces a markedly transformed phenotype characterized by increased proliferation, anchorage-independent cell growth, anoikis resistance, and matrix invasion. Furthermore, expression of ΔIgTrkB leads to up-regulation of many transcripts encoding cancer-associated genes including cyclind1, twist1, and hgf, as well as down-regulation of tumor suppressors such as pten, and rb1. In addition, ΔIgTrkB NCM-1 cells show a 21-fold increase in mRNA for MYCN, the most common genetic marker for a poor prognosis in neuroblastoma. When injected into NOD SCID mice, control GFP NCM-1 cells fail to grow while ΔIgTrkB NCM-1 cells form rapidly growing and invasive tumors necessitating euthanasia of all mice by 15 days post injection. In summary, these results indicate that activated TrkB signaling is sufficient to promote the formation of a highly malignant phenotype in neural crest derived cells.
Keywords: Neuroblastoma, neural crest, transformation, TrkB, MYCN
Introduction
Neuroblastoma, a pediatric malignancy arising from sympathoadrenal precursors from the neural crest, is a cancer typified by its heterogeneity of disease. Disease course in neuroblastoma can range anywhere from patients presenting with metastatic disease that will spontaneously regress with support treatment alone (stage 4S), to localized favorable tumors, to cases of aggressive neuroblastoma, in which children will often relapse following treatment despite the most intensive chemo- and adjuvant therapy (1).
This heterogeneity in neuroblastoma tumor properties is correlated with a number of different factors including Trk receptor expression (2). Trk receptors are important in normal sympathetic development; for example, TrkA, the high affinity receptor for nerve growth factor (NGF), promotes target-dependent survival of sympathetic neurons by preventing programmed cell death (3, 4) and neuroblastoma tumors that express TrkA have a favorable prognosis (5). In contrast, many MYCN amplified, poor prognosis neuroblastomas express TrkB, resulting in tumors that are often highly aggressive and eventually fatal (6). Because TrkB promotes plasticity, differentiation and survival of primary neurons, the aggressive phenotype correlated with TrkB expression was puzzling; however, we discovered that TrkB is transiently expressed in sympathetic progenitors prior to the onset of TrkA expression, and when stimulated with BDNF, the TrkB expressing cells proliferate in cell culture (7, 8) and in vivo (Straub and Nishi, unpublished observations).
An important question is whether TrkB expression is a marker of poor prognosis, or whether active TrkB signaling is directly responsible for the aggressive nature of poor prognosis neuroblastoma. Supporting a causal role for TrkB signaling, concomitant expression of full length TrkB and BDNF leads to autocrine signaling enhancing tumor cell survival and invasiveness (9), while expression of a truncated TrkB isoform lacking the tyrosine kinase domain is commonly found in more benign and differentiated tumors such as ganglioneuroblastomas (10). Furthermore, treatment of TrkB-expressing SMS-KCN neuroblastoma cells with BDNF enhances cell survival in serum free media (11). Similarly BDNF treatment of SH-SY5Y cells either transfected with TrkB or induced to express TrkB by retinoic acid have enhanced survival in conditions of limited growth factors (9, 12), increased resistance to chemotherapeutics (13–15), increased production of angiogenic factors (16, 17), and enhanced invasion (9). Therefore, TrkB signaling contributes to the aggressiveness of poor prognosis neuroblastoma, but it is still unknown whether TrkB signaling alone can transform cells of the neural crest lineage.
In order to determine if constitutively active TrkB signaling is sufficient to transform cells, we created a mutant form of the TrkB receptor by removal of two immunoglobulin-like ligand binding domains in the extracellular portion of the receptor. This construct is constitutively active and, when stably transfected into a normal neural crest-derived cell line NCM-1, promotes a highly malignant phenotype in vitro and in vivo.
Results
Removal of two immunoglobulin-like domains renders TrkB constitutively active
Previous studies have shown the TrkA tyrosine kinase receptor can be rendered constitutively active by removal of the two immunoglobulin-like (Ig-like) domains in the extracellular region of the receptor (18). Therefore, we created a similar construct (ΔIgTrkB; Figure S1) and stably transfected HEK293 cells with ΔIgTrkB and full length wild type (WT) TrkB. Expression of both types of receptor were confirmed (Figure 1a). A marked increase of phosphorylated Erk 1/2 is observed when WT TrkB HEK293 cells are treated with BDNF and ΔIgTrkB HEK293 cells (Figure 1a) albeit at significantly lower levels when compared to the BDNF-stimulated WT TrkB (Figure 1b). Therefore, we tested whether this level of constitutive signaling by ΔIgTrkB was sufficient to promote downstream biological effects.
Figure 1.

ΔIgTrkB is expressed and is constitutively active. HEK293 cells were stably transfected with either a WT or ΔIgTrkB construct. Cells were then treated with or without BDNF (100 ng/mL) and protein was isolated. (a) Western blot for TrkB and phosphorylated Erk 1/2 demonstrates that ΔIgTrkB is expressed, and signals in the absence of the TrkB ligand BDNF. (b) Quantification of phosphorylated Erk 1/2 protein expression reveals a significant increase in phospho Erk 1/2 in ΔIgTrkB transfected cells treated with (black bars), or without (white bars) BDNF, compared to untreated WT TrkB transfected cells (p < 0.0001, ANOVA, n=3, error bars = SEM) or untransfected HEK293 cells. Constitutive ΔIgTrkB activity is two-fifths that of the WT TrkB receptor treated with BDNF.
ΔIgTrkB promotes neurite outgrowth in PC12 cells
PC12 cells are a well-known model of nerve growth factor (NGF) induced neuronal differentiation via TrkA (19, 20), and TrkB transfected PC12 cells differentiate in response to BDNF (21). PC12 cells were transiently transfected with ΔIgTrkB or GFP control construct, and two days later treated with or without 7sNGF (1μg/mL). After 6 days, cells were fixed and stained for either TrkB or GFP to identify transfected cells. Cells transfected with ΔIgTrkB show a 6-fold increase in the number of neurite bearing cells over GFP transfected cells in the absence of NGF (Figure 2a–c). The ΔIgTrkB-induced neurite outgrowth is equivalent to that of NGF through TrkA as there is no difference in the number of neurite bearing cells between Δ IgTrkB or GFP transfected cells in the presence of NGF (Figure 2d).
Figure 2.

ΔIgTrkB promotes process outgrowth in PC12 cells. Transfected cells were assessed for process outgrowth 6 days following transfection. (a) PC12 cells transfected with GFP have minimal neurite outgrowth, (b) while ΔIgTrkB transfection stimulates neurite outgrowth. (c) Quantification of process outgrowth in PC12 cells reveals a 6-fold increase in the number of cells bearing neurites when transfected with ΔIgTrkB as opposed to a GFP control plasmid (p < 0.0001, Student’s t-test, n=3, error bars = SEM). (d) In the presence of NGF the number of cells bearing neurites is equivalent in the two transfection conditions. Scale bar is equivalent to 25 μm and applies to both images.
ΔIgTrkB enhances proliferation in the neural crest derived cell line NCM-1
NCM-1 is an immortalized, but normal multipotent cell line with the ability to generate sympathoadrenal precursors (22). To determine if constitutive TrkB signaling promotes proliferation or differentiation in NCM-1 cells, we transfected cells with ΔIgTrkB using a PiggyBac transposase/transposon vector (pmGenie 3) that integrates the desired insert into the host chromosome followed by inactivation of the transposase (23). Stable ΔIgTrkB NCM-1 transfectants grow to confluency more rapidly than untransfect (CONT) NCM-1 cells. To quantify this apparent increase in proliferation, cells were counted after various times in cell culture by measuring uptake of the vital fluorescent dye calcein AM (24). We noted a 2.5-fold increase in cell number after 4 days in ΔIgTrkB NCM-1 cells compared to CONT NCM-1 cells (Figure 3a). While constitutively active TrkA is transforming, full length (WT) TrkA plus NGF promotes differentiation (25); therefore, we compared the growth rate of WT TrkB NCM-1 cells with or without BDNF. As seen in Figure 3b, the growth rate of WT TrkB NCM-1 cells is enhanced by the presence of BDNF. Thus, ligand induced activation of WT TrkB also enhances proliferation as does the ΔIgTrkB. Additionally, treatment with the pan-Trk kinase inhibitor K252a abolished ΔIgTrkB-mediated proliferation, resulting in calcein AM fluorescence equivalent to CONT NCM-1 cells (Figure 3c) suggesting that TrkB kinase activity is required for the observed enhanced proliferation. In order to confirm that the enhanced proliferation did not arise from an insertion of our construct into a tumor suppressor, five additional parent lines were established that all show a significant increase in cell number after 4 days in vitro (Figure S2). Further supporting the enhanced proliferation, western blot analysis for the proliferation markers, phosphorylated histone H3 and cyclin D1 kinase show significant increases in ΔIgTrkB NCM-1 compared to CONT NCM-1 cells (Figure S3). Therefore, constitutive signaling through ΔIgTrkB promotes an enhanced rate of growth in CONT NCM-1 cells.
Figure 3.

ΔIgTrkB and full length TrkB promote proliferation in the neural crest derived cell line NCM-1. Cultures in 96 well plates were seeded with the same number of cells on day 0, then grown for the indicated periods of time up to 4 days and the number of cells were quantified using Calcein AM uptake. (a) stably transfected ΔIgTrkB NCM-1 cells (closed triangles) grow faster than the parent CONT NCM-1 cell line (closed squares; p < 0.0001, ANOVA; n=16). (b) full length TrkB expressing cells exhibit an enhanced rate with BDNF (open circles) over the same cell line grown in the absence of BDNF (closed circles; p< 0.0001, ANOVA, n=8) (c) The pan-Trk inhibitor K252a (50 nM) abolishes increased proliferation (p < 0.0001, ANOVA, n=8, error bars = SEM) in ΔIgTrkB NCM-1 cells (open triangles) compared to DMSO treated ΔIgTrkB NCM-1 cells (closed triangles). ΔIgTrkB proliferation in the presence of K252a is similar to WT NCM-1 proliferation in the presence of either K252a (open squares) or DMSO (closed squares).
ΔIgTrkB transforms NCM-1 cells
Enhanced proliferation alone is not sufficient to consider a cell transformed. Another feature common to transformed cells is the loss of requirement for attachment to a surface to divide, a property known as anchorage independent cell growth (26). To determine if ΔIgTrkB expression confers anchorage independent cell growth to NCM-1 cells, cells were cultured suspended in soft agar (Figure 4). While CONT NCM-1 cells failed to grow colonies in soft agar regardless of the presence of BDNF (Figure a,b), ΔIgTrkB NCM-1 cells grow many colonies whether or not BDNF is present (Figure 4c,d,g). In contrast very few colonies are formed by WT TrkB cells in the absence of BDNF (Figure 4e,g) but many are formed when WT TrkB NCM-1 cells are stimulated by BDNF (Figure 4f,g). Interestingly the number of colonies formed mirrored the level of phospho-ERK activation (compare Figure 1b to 4g). Furthermore, although ΔIgTrkB NCM-1 cells formed fewer colonies, the colonies that formed appeared larger than those formed by WT TrkB in the presence of BDNF (compare Figure 4d to 4f).
Figure 4.

ΔIgTrkB promotes anchorage-independent cell growth and anoikis resistance in NCM-1 cells. (a, b) The CONT NCM-1 cells have little ability to grow in soft agar, even when BDNF is added (b). (c,d) ΔIgTrkB NCM-1 cells form numerous colonies even in the absence of BDNF (c). (e,f) NCM-1 cells stably transfected with WT TrkB form colonies only when BDNF is added (f). (g) Quantification of cultures shown in a–f (p < 0.001, Student’s t-test, n=6, error bars = SEM). (h) ΔIgTrkB NCM-1 cells are also resistant to detachment-induced apoptosis marked by a significant increase (p < 0.05, Student’s t-test, n=4, error bars = SEM) in the number of live cells in suspension as determined by trypan blue exclusion from media taken from confluent cultures.
Another feature related to anchorage independent growth is the ability of transformed cells to survive when detached from the cell surface (27). Normally, when cells grown in culture detach, they undergo anoikis, or detachment induced apoptosis. To determine if ΔIgTrkB allows NCM-1 cells to become anoikis resistant, the number of live cells in the medium collected from transfected and untransfected cells was quantified (Figure 4h). We observed a 4-fold increase in the number of live cells in the media from ΔIgTrkB NCM-1 cultures compared to CONT NCM-1 (p < 0.05, Figure 4d), indicating ΔIgTrkB promotes anoikis resistance in NCM-1 cells.
Another important characteristic of malignant transformation is the ability of cells to migrate to and invade surrounding tissues and blood vessels. To investigate whether ΔIgTrkB expression enhances migration and invasion we used a radial migration assay known as ‘the donut assay’ (28). In this assay, cells are limited to a restricted area by a silicone donut. Following donut removal, the number of cells migrating radially from the confined area are quantified. Neural crest cells are intrinsically migratory, as during development they must migrate from the neural tube to their final locations throughout the body. In light of this, we did not find any significant difference in the total number of migrating cells outside the originally confined area after 24 hours (Figure 5a–c, e–g, j). However, there is a significant increase in the area within which migrated cells could be found, indicating ΔIgTrkB NCM-1 cells migrate farther compared to WT NCM-1 cells (Figure 5d, h–i).
Figure 5.

ΔIgTrkB enhances migration and invasion of NCM-1 cells in donut migration assay. (a–d) Migration in CONT NCM-1 and (e–h) ΔIgTrkB NCM-1 cells. (i) Quantification of migration shows a significant increase in the area migrated (p < 0.0001, Student’s t-test, n=8, error bars = SEM) in ΔIgTrkB NCM-1 cells (h compared to d), (j) but no difference in the total number of cells migrated. For invasion assay, cells were overlayed with matrigel. (k–n) Matrigel invasion in CONT NCM-1 and (o–r) ΔIgTrkB NCM-1 cells. (s) ΔIgTrkB significantly enhances both area invaded (r compared to n), and (t) the total number of invading NCM-1 cells (p < 0.05, Student’s t-test, n=3, error bars = SEM). Scale bar is equivalent to 1mm and applies to all panels.
To investigate invasion, a layer of crude extracellular matrix (matrigel) was overlaid on the cells. Although addition of matrigel leads to a reduction in the number of cells traveling outside the originally confined area for both cell types (Figure 5j vs. 5t), ΔIgTrkB NCM-1 cells have an enhanced ability to invade the extracellular matrix marked by a 2.5-fold increase in the number of cells invading after 24 hours (Figure 5k–m, o–q, t). Furthermore, ΔIgTrkB NCM-1 cells invade farther into the matrigel indicated by a 2.5-fold increase in the total area invaded by ΔIgTrkB NCM-1 cells compared to CONT NCM-1 (Figure 5n, r, s).
ΔIgTrkB enhances cancer related gene expression in NCM-1 cells
To identify genes contributing to the transformed phenotype in ΔIgTrkB NCM-1 cells, we analyzed transcripts using a targeted qPCR array of cancer pathway genes (full table of genes analyzed is in the Supplemental Materials). This analysis revealed that ΔIgTrkB increases transcript levels for a number of tumor promoting genes (Table 1), as well as decreases in expression of tumor suppressors (Table 2). Consistent with the enhanced proliferation of ΔIgTrkB NCM-1 cells, we detected a 436-fold increase in transcripts levels as well as significantly enhanced protein levels (Figure S3) for the cell cycle regulatory gene cyclind1. Furthermore, upregulation of twist1 (39-fold) and hepatocyte growth factor (hgf, 29-fold), two genes known to play important roles in promoting invasion and metastasis (29, 30), is consistent with the enhanced invasive capacity of ΔIgTrkB NCM-1 cells. Moreover, expression of ΔIgTrkB in NCM-1 cells significantly downregulates expression of the tumor suppressors pten (-1.71-fold) and rb1 (−1.77-fold). Therefore, the RNA expression profile of ΔIgTrkB NCM-1 cells is consistent with the highly transformed phenotype of the cells.
Table 1.
Tumor promoters upregulated in ΔIgTrkB NCM-1 cells
| Symbol | Gene | Fold Regulation | P-value | Description |
|---|---|---|---|---|
| ccnd1 | Cyclin D1 | 436.1 | 0.000069 | Promotes cell cycle progression |
| twist1 | Twist homolog 1 (Drosophila) | 38.57 | 0.000015 | Promotes epithelial- mesenchymal transition (EMT), invasion, and metastasis |
| hgf | Hepatocyte growth factor | 28.86 | 0.008818 | Promotes mitogenesis, cell motility, and matrix invasion |
| ccnd2 | Cyclin D2 | 26.40 | 0.000137 | Promotes cell cycle progression |
| fgf2 | Fibroblast growth factor 2 | 19.88 | 0.001753 | Promotes angiogenesis |
| angpt1 | Angiopoietin 1 | 12.25 | 0.003952 | Promotes angiogenesis |
| abcg2 | ATP-binding cassette, subfamily G (WHITE), member 2 | 6.385 | 0.000792 | Mediates multidrug resistance |
| muc1 | Mucin 1, cell surface associated | 4.884 | 0.000030 | Inhibits p53-mediated apoptosis, and promotes EMT through β-catenin stabilization |
| vegfa | Vascular endothelial growth factor A | 4.816 | 0.000115 | Promotes angiogenesis |
| serpine1 | Serpin peptidase inhibitor, clade E (nexin, plasminogen activator inhibitor type 1), member 1 | 4.661 | 0.000027 | Promotes invasion and metastasis |
Table 2.
Tumor suppressors downregulated in ΔIgTrkB NCM-1 cells
| Symbol | Gene | Fold Regulation | P-value | Description |
|---|---|---|---|---|
| thbs1 | Thrombospondin 1 | −2.118 | 0.000563 | Promotes cell adhesion |
| pik3r1 | Phosphoinositide-3-kinase, regulatory subunit 1 (alpha) | −1.913 | 0.000261 | Inhibitor of PI3K signaling |
| rb1 | Retinoblastoma 1 | −1.771 | 0.000464 | Inhibits cell cycle progression |
| tgfbr1 | Transforming growth factor, beta receptor 1 | −1.755 | 0.001248 | Inhibits cell growth |
| pten | Phosphatase and tensin homolog | −1.710 | 0.000285 | Inhibits cell proliferation |
| bad | BCL2-associated agonist of cell death | −1.572 | 0.004340 | Promotes apoptosis |
| cdkn1a | Cyclin-dependent kinase inhibitor 1A | −1.514 | 0.000064 | Inhibits cell cycle progression |
An important marker of poor prognosis in human neuroblastoma tumors is the amplified expression of mycn. To determine if the transformation of NCM-1 cells by ΔIgTrkB influences mycn, we compared transcript levels in CONT and ΔIgTrkB NCM-1 cells by qPCR. We found a 21-fold increase in mycn levels in ΔIgTrkB NCM-1 cells compared to CONT NCM-1 cells (p < 0.01). In contrast, although NCM-1 cells were immortalized by the use of a retroviral vector carrying vmyc, the levels of myc observed with the qPCR array were very low and did not differ between CONT- and ΔIgTrkB NCM-1 cells (see supplemental material regarding the gene list and qPCR array signals observed for each gene).
ΔIgTrkB NCM-1 cells form rapidly growing and aggressive tumors in vivo
To determine if ΔIgTrkB expression would enhance the ability of NCM-1 cells to form tumors in vivo, NOD-SCID mice were injected subcutaneously with 106 ΔIgTrkB or GFP NCM-1 cells suspended in matrigel. One week following injection, tumors became palpable in mice injected with ΔIgTrkB NCM-1 cells (Figure 6a, p < 0.01), and all ΔIgTrkB NCM-1 injected mice were sacrificed by 15 days post-injection due to tumor burden (Figure 6b). GFP NCM-1 injected mice remained tumor free throughout the experiment (Figure 6). Monitoring tumor size daily, ΔIgTrkB NCM-1 tumors grew extremely rapidly, measuring an estimated 8 cm3 by 2 weeks after injection, while GFP NCM-1 cells failed to grow (Figure 6c). Upon removal, ΔIgTrkB NCM-1 cell tumors were extremely large and heavily vascularized with an average wet weight of 4.5 grams (Figure 6e–f). Not only do ΔIgTrkB tumors grow at a rapid pace, these tumors are also highly invasive, invading the vertebrae and compressing the spine resulting in bilateral hind limb paralysis in one mouse only 10 days following injection (Figure 6g–h). Tumor tissue contains many closely packed cells with scant cytoplasm and little extracellular stroma, reminiscent of aggressive, poor prognosis neuroblastoma (Figure 6d). Furthermore, a separate injection of only 100 cells formed tumors in 3/3 mice within 21 days, demonstrating ΔIgTrkB NCM-1 cells are highly tumorigenic. Therefore, constitutive TrkB signaling is sufficient to transform the neural crest derived cell line NCM-1 into highly aggressive tumor cells in vivo.
Figure 6.
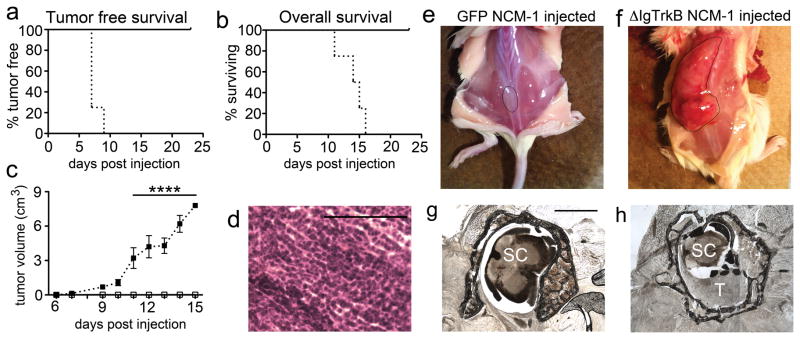
ΔIgTrkB NCM-1 cells form highly aggressive tumors in vivo. (a) Kaplan-Meier plot of tumor free survival in NOD-SCID mice subcutaneously injected with GFP NCM-1 cells (solid line), or ΔIgTrkB NCM-1 cells (dotted line). No mice injected with GFP NCM-1 cells formed tumors over the course of the experiment (p < 0.01, log-rank (Mantel-Cox) test, n=4). (b) Kaplan-Meier plot of overall survival. All ΔIgTrkB NCM-1 cell injected mice had to be sacrificed by 15 days after initial cell injection due to tumor burden (p < 0.01, log-rank (Mantel-Cox) test, n=4). (c) Estimated tumor volume over the course of the experiment. ΔIgTrkB NCM-1 cell injected mice formed rapidly growing tumors starting at 1 week following initial cell injection, with a significant difference in tumor volume versus matrigel plug volume by 11 days (p < 0.0001, ANOVA, n=4, error bars = SEM). Removed tumors had an average wet weight of 4.5 grams. (d) Hematoxylin and Eosin staining of tumor tissue reveals densely packed cells with scant cytoplasm and absent extracellular stroma reminiscent of poor prognosis neuroblastoma. (e) Example of mouse injected with GFP NCM-1 cells, and (f) ΔIgTrkB NCM-1 cells (matrigel (e) and tumor (f) are outlined in black). (g–h) In one mouse, the tumor invaded the spinal cord causing bilateral hind limb paralysis. (g) Normal thoracic spinal cord (labeled SC) surrounded by vertebrae, rostral to tumor invasion. (h) The lower thoracic spinal cord (labeled SC) is compressed in the vertebrae by invading tumor cells (labeled T). Scale bar in (g) is equivalent to 1mm and also applies to (h). Scale bar in (d) is equivalent to 100 μm.
Discussion
In this study we provide evidence that constitutive TrkB signaling is sufficient to transform a neural crest cell line into a carcinogenic phenotype marked by an enhancement of proliferation, anchorage independent cell growth, anoikis resistance, migration and invasion, and upregulation of tumor promoter genes. The enhanced rate of proliferation and anchorage independent cell growth was also observed when full length TrkB was stimulated with BDNF in the same cell line. The isolation of the ΔIgTrkB NCM-1 cell line allowed us to test the behavior of these cells in vivo, and they displayed highly aggressive, tumorigenic behavior when injected subcutaneously. Taken together, our data suggest that aberrant TrkB signaling in the developing sympathoadrenal lineage may be sufficient to promote neuroblastoma formation.
The involvement of Trk receptors in cancer is complex. The first Trk, for “tropomyosin-receptor kinase”, was isolated from a colon carcinoma, and resulted from the fusion of a truncated tropomyosin with the tyrosine kinase domain of a receptor that rendered the kinase constitutively active (31). This kinase domain was subsequently discovered to belong to TrkA, the high affinity receptor for nerve growth factor (NGF; (20). In neuroblastomas, activation of full length TrkA slows the rate of proliferation and promotes differentiation, and shorter forms of TrkA have been identified that are constitutively active and antagonize the signaling between NGF and the full length TrkA (25). In contrast, the TrkB receptor, the high affinity receptor for BDNF, enhances proliferation and anchorage-independent cell growth in many cell lines (32–34) and enhances invasion in a number of cancer derived lines including neuroblastoma (9, 29, 35), colon cancer (36), head and neck squamous cell carcinoma (37), and non-small cell lung cancer (38). TrkB also enhances in vivo tumor growth in neuroblastoma (39) and transitional cell carcinoma (40). However, none of these studies have determined whether TrkB signaling in normal neural crest-derived cells is sufficient to promote an aggressive, fully transformed phenotype.
Constitutively activated TrkB in NCM-1 cells highly upregulates many genes also seen in poor prognosis neuroblastoma. CYCLIND1 is selectively amplified in poor prognosis neuroblastoma tumors (41), as is TWIST1, which is expressed in 100% (7/7) of MYCN amplified tumors, but only 11% (2/18) of non-MYCN amplified tumors (42). In MYCN amplified neuroblastoma cell lines, TWIST1 expression ranged from 16–164 fold that of non-MYCN amplified lines, levels consistent with the 39-fold increase in twist1 expression we observe here in ΔIgTrkB NCM-1 cells. Suggesting a specific cooperation of TWIST1 and MYCN in neuroblastoma, TWIST1 inhibits expression of the tumor suppressor P53, which allows MYCN-amplified tumors, and in the case of our study, ΔIgTrkB NCM-1 cells, to escape P53-dependent apoptosis. In this study we also observed a 29-fold upregulation of hgf together with a 1.5-fold upregulation of the HGF receptor c-met in ΔIgTrkB NCM-1 cells. Increased c-Met signaling is a common occurrence in many types of cancer (43–47), and it has also been observed in neuroblastoma (29).
ΔIgTrkB NCM-1 cells display a greatly enhanced ability to form rapidly growing and invasive tumors compared to oncogenes expressed in other cell lines. NCM-1 cells were isolated from rat embryos and immortalized by transduction with a v-myc-containing replication-deficient retrovirus (22). Although v-myc expression itself can be transforming (48), this is not the case in NCM-1 cells because of their ability to differentiate (22), and because they do not grow in soft agar, or form tumors in vivo. This is confirmed by our qPCR array analysis, which showed very low, barely detectable levels of myc in CONT NCM-1 cells as well as in the ΔIgTrkB NCM-1 cells. ΔIgTrkB NCM-1 cells form large tumors prompting euthanasia of mice two weeks after a subcutaneous injection of 1 million cells; when only 100 cells are injected, 100% of the mice form tumors by 21 days. Similar in vivo tumor growth was seen in a v-myc immortalized rat fibroblast cell line expressing oncogenic BCR-ABL, however this study injected 50% more cells to initiate tumorigenesis (49). In another study, expression of the oncogene BCL2 in a rat L6 myoblast cell line expressing v-myc caused tumors formed only after 10 weeks (50). Recently, Schulte et. al. found JoMa1 neural crest progenitor cells (which are maintained in an undifferentiated state by inducible c-myc expression) can be transformed by an oncogenic variant of the ALKF1174L, and 2 out of 6 mice were able to form tumors in vivo that were lethal to the mouse by 48 days following injection of 20 million cells (51). Thus, ΔIgTrkB is considerably more oncogenic in vivo than ALKF1174L. Not only did ΔIgTrkB NCM-1 tumors grow at a rapid pace, but they are also highly invasive. In one mouse, tumor cell invasion of the spine, caused spinal cord compression, and bilateral paralysis. This spinal cord invasion mimics human neuroblastoma, where the cancer can extend into spinal foramina causing nerve root and spinal cord compression in patients with paraspinal tumors (52–54). In total, 5% of all neuroblastoma patients will present with signs related to cord impingement.
It is not clear whether the TrkB signaling is directly responsible for this transformed phenotype or if TrkB is acting through upregulation of mycn. Regardless, it is likely that these changes result in alterations of other genes that contribute to the aggressive phenotype of these tumors. MYCN amplification is the most consistent genetic alteration seen in poor prognosis neuroblastoma (55) and as evidence that MYCN is sufficient to drive neuroblastoma formation, the TH-MYCN transgenic mouse forms neuroblastoma-like tumors spontaneously (56). However, the TH-MYCN derived tumors are slower growing and more confined than the tumors we observed from ΔIgTrkB NCM-1 cells. In addition, TH-MYCN tumors highly express BDNF, but lack TrkB expression (DeWitt and Nishi, unpublished data). JoMa1 neural crest cells overexpressing MYCN also form highly variable, slow growing tumors with mice surviving anywhere from 43–123 days (51). Thus, the activation of TrkB signaling likely contributes to the aggressive behavior of some tumors. On the other hand, constitutive TrkB signaling in NCM-1 cells induces a 21- fold upregulation of mycn mRNA in ΔIgTrkB NCM-1 cells that is comparable to the 20- to 80-fold MYCN levels observed in neuroblastoma tumors and cell lines (57).
Our studies suggest that one plausible initiating event in forming aggressive neuroblastoma is the failure of TrkB expression to be down-regulated early in development. Our previous studies in showed that TrkB is transiently expressed during a developmental period when sympathoblasts are commencing differentiation and hence likely downregulating mycn. However, when BDNF is introduced, these TrkB positive progenitors are stimulated to divide again (7). Thus, aberrant activation of TrkB could trigger upregulation of MYCN together with the activation of additional pathways that contribute to a highly aggressive, carcinogenic phenotype. This underscores the importance of the development of therapies targeting TrkB signaling, such as lestaurtinib (CEP-701) (58).
Materials and methods
Constructs
Using a full-length rat trkb (WT trkb) construct generously provided by Dr. Moses Chao, New York University, NY, NY, we used site-directed mutagenesis to convert a single base at base pair 1814 into a pst1 site. Both Ig-like domains could then be removed by pst1 (New England Biolabs, Ipswich, MA) digestion due to another pst1 site at base pair 1233. For HEK293 experiments ΔIgtrkb and WT trkb were cloned into pcDNA3.1 (Invitrogen, San Diego, CA). For PC12 experiments ΔIgtrkb was cloned into an inducible vector (pTRE-tight, Clontech, Mountain View, CA) and transfected into an rTTa-expressing PC12 Tet-on cell line (Clontech). For NCM-1 experiments ΔIgtrkb was cloned into a piggyBAC transposon-transposase vector (pmhyGENIE-3) containing a DsRed tag and hygromycin selection gene (61). NCM-1 cells were transfected with a GFP-expressing control piggyBAC vector (pmGENIE-3) to establish a control cell line for in vivo experiments.
Cell Culture
Cells were grown at 37°C in 5% CO2. HEK293 and NCM-1 cells were maintained in 10% (v/v) fetal bovine serum, 20 U/mL penicillin, 20 mg/mL streptomycin, 2mM L-glutamine, and 6 mg/mL glucose in modified L15CO2 (62). Serum for PC12 cells was 5% fetal bovine serum and 5% heat inactivated horse serum.
Transfections
HEK293 and PC12 cells were transfected using JetPEI (Polyplus transfection, Illkirch, France). Stably transfected HEK293 cells were established by G418 (Sigma, St. Louis, MO) selection. NCM-1 cells were transfected using X-tremeGENE 9 (Roche, Indianapolis, IN) and stable cells were established by hygromycin (Sigma) selection.
Westerns
Cells were seeded at 250,000 per well in 6-well plates. For HEK293 experiments cells were serum starved for 24 hours, treated with, or without BDNF (100ng/mL, R&D Systems) for 1 hour and then collected for SDS PAGE by direct lysis into 100μL 1x SDS sample buffer+β–Mercaptoethanol (βMe). Samples were run on an 8% polyacrylamide gel, then transferred to a nitrocellulose membrane (Osmonics, Inc., Minnetonka, MN) overnight at 4°C at 30 volts (Hoefer Scientific Instruments, San Francisco, CA). Blots were incubated with primary antibodies overnight at 4°C followed by appropriate secondary antibodies for 1 hour at room temperature. Primary antibodies used were: goat anti-TrkB (1:1000, R&D Systems); rabbit anti-p-Erk1/2 (1:500, Cell Signaling, Boston, MA); goat anti-β actin (1:1000, Santa Cruz, Santa Cruz, CA); rabbit anti-Phospho-Histone H3 (1:500, Cell Signaling); and mouse anti-Cyclin D1 (1:1000; Cell Signaling). Secondary antibodies used were donkey anti-goat 700 (Rockland, Gilbertsville, PA); donkey anti-rabbit 800 (Rockland); and donkey anti-mouse 800 (Rockland) all at 1:10 000. Blots were analyzed using an Odyssey Infrared Imager (LI-COR Biosciences, Lincoln, NE).
PC12 neurite outgrowth
PC12 cells were plated on poly-D-lysine (0.5 mg/mL, Sigma) and laminin (0.02 mg/mL, purified in the Nishi lab from EHS tumors grown subcutaneously in C57Bl6 mice) coated coverslips at 50,000 cells per well. The day after plating, cells were transfected with either an inducible GFP or the inducible ΔIgtrkb construct and allowed to recover for 48 hrs prior to treatment with doxycline (1μg/mL, Sigma) and 7s NGF (1μg/mL, Alomone, Jerusalem, Israel). Coverslips were fixed 30 min in Zamboni’s fixative (4% (w/v) paraformaldehyde, 15% (v/v) picric acid in 0.1 M sodium phosphate buffer, pH 7.4) and processed for immunocytochemistry as previously described (63). Primary antibodies were: goat anti-TrkB (1:1000, R&D Systems); chicken anti-GFP (1:1000, Aves, Tigard, OR). Secondary antibodies were: donkey anti-goat alexa 488 (1:1000, Invitrogen) and goat anti-chicken alexa 488 (1:1000, Invitrogen). A Nikon Eclipse E800 microscope connected to a computer equipped with StereoInvestigator software (MBF Bioscience, Williston, VT) was used to count neurite positive PC12 cells (at least one process of a length at least twice the cell’s soma size).
Calcein AM
NCM-1 cells were plated on poly-D-lysine coated 96 well plates at 200 cells per well in 100μL of media and viability assessed using 2μM calcein AM (Molecular Probes, Eugene, OR) with a FLUOstar Galaxy (BMG, Cary, NC) fluorescent microplate reader. Each condition was replicated in a minimum of 8 wells on the same plate. For K252a (Merck, Darmstedt, Germany) and c-Met inhibitor (SU11274, Merck) experiments, inhibitors (50 nM and 1 μm, respectively) were added at the time of plating.
Soft agar assay
6-well plates were coated with 0.5% agar (Affymetrix, Santa Clara, CA) in growth medium. After this base layer had solidified, NCM-1 cells suspended in 0.35% agar were plated on top of the base layer at 1000 cells per well. Cells were fed by adding 0.5mL of media to the top of each well every 3 days. After 10 days, cultures were fixed overnight with 4% paraformaldehyde in PBS, then stained with 0.005% crystal violet.
Anoikis assay
To quantify anoikis, medium was collected 3 days after cultures achieved confluence and the number of live cells growing in the media was quantified by trypan blue (0.08%, Sigma) exclusion and a hemocytometer.
Migration and invasion
The ‘donut assay’ for migration and invasion was used as described (28). 10,000 cells were plated on poly-D-lysine and laminin coated coverslips in a 10μL volume. Initial images were acquired through a 2X PlanApo objective on a Nikon Eclipse TE-2000E inverted microscope. A second set of images acquired at 24 hours were compared and analyzed using the default settings of a custom written ImageJ macro. Area migrated/invaded was quantified by measuring the area between the outer bound of the farthest migrating/invading cells after 24 hours, and the bound of the cells directly after gasket removal.
RNA extraction and qPCR array
Cells were grown to confluence in 6-well plates, lysed directly into TRI Reagent (Molecular Research Center, Cincinnati, OH), and RNA was isolated using the manufacturer’s protocol. RNA quality and genomic DNA contamination were assessed using an Agilent 2100 Bioanalyzer (Agilent Technologies, Santa Clara, CA). Reverse transcription and Cancer Pathways qPCRarray plate (SABiosciences, Valencia, CA) analysis were performed at the UVM Vermont Cancer Center DNA Analysis Facility using RT2 First Strand kit (SABiosciences, Valencia, CA). Data shown in Tables 1 and 2 represent the mean of three independently isolated RNA samples from 3 different wells of a 6 well plate for each cell line. Mycn expression transcription levels were evaluated by reverse transcription of 1μg of RNA transcribed to cDNA using (Superscript III, Invitrogen) and subsequent Taqman-based qPCR (ABI).
In vivo
Mice were housed in an NIH and AALAC approved animal facility at UVM and treated following an approved IACUC protocol. Cells were injected subcutaneously into flanks of NOD-SCID mice at 106 cells per mouse in 200μL of matrigel (BD Biosciences). Four mice injected per cell line. When tumors became palpable, tumor growth was quantified every other day at first, and then daily when it became apparent TrkB tumors were fast growing. Tumor volume estimated from length and width measurements using the established formula (59). To examine the lower limits of the tumorigenic potential of ΔIgTrkB NCM-1 cells, 100 cells in 200 μL of matrigel were injected into 3 NOD-SCID mice, which were monitored for tumor formation.
Supplementary Material
Supplemental Figure 1: Construction of a constitutively active TrkB receptor by removal of the two immunoglobulin-like ligand binding domains. (a) The 193 amino acid sequence coding for the two immunoglobulin (Ig)-like ligand binding domains (shown in grey italics) of the 629 amino acid TrkB protein was removed by restriction digest. (b) The full length wild type TrkB protein consists of two cysteine-rich domains (CRD) surrounding a leucine-rich domain (LRD), two immunoglobulin-like domains (IGD), and the intracellular tyrosine kinase domain (TKD). In the ΔIgTrkB construct the two Ig-like domains have been removed. The three vectors used to express the ΔIgTrkB construct were: pcDNA3 (promoter = CMV with a neomycin selection cassette); pTRE Tight) tetracycline response element in front of the gene of interest); pmGenie3 (beta-actin promoter in a PiggyBac transposon, transposase vector that also expresses dsRed).
Supplemental Figure 2: Proliferation in NCM-1 cell lines. ΔIgTrkB and WT NCM-1 cells, plus 5 additional NCM-1 cell lines stably transfected with ΔIgTrkB were grown in culture. All ΔIgTrkB transfected cell lines have enhanced proliferation shown by enhanced Calcein AM fluorescence compared to wild type cells after 4 days in vitro (p < 0.01, ANOVA, n=8, error bars = SEM).
Supplemental Figure 3: Phospho-histone H3 and cyclin D1 protein are upregulated in ΔIgTrkB NCM-1 cells. These data confirm that markers for proliferation are upregulated in ΔIgTrkB NCM-1 cells in concert with the observed increases in the rate of proliferation measured by counting cells after fixed times (a) scanned image of western blot of phospho-histone H3 acquired with Odyssey Licor Infrared Laser Scanner. (b) quantification of the western blot using Licor software showing a two-fold increase in expression (p < 0.05, Student’s t-test, n=3, error bars = SEM). (c) Western blot of cyclin D1 protein in ΔIgTrkB NCM-1 cells and wild type NCM-1 cells. (d) Quantification of cyclin D1 protein expression reveals a significant 6-fold upregulation of cyclin D1 protein in ΔIgTrkB NCM-1 cells (p < 0.01, Student’s t-test, n=3, error bars = SEM).
Acknowledgments
The authors would like to thank Felix Eckenstein, Andy McKenzie, and Nourine Ahmed for technical assistance. We also thank Alan Howe for helpful comments on our manuscript and for assistance with the “donut” assay. Portions of this work were performed in the DNA Analysis Facility at the Vermont Cancer Center and the Neuroscience COBRE Molecular Cellular Core at the University of Vermont. This work was funded by Alex’s Lemonade Foundation (RN); R21NS25788 (RN); P30RR032135 (COBRE); P30GM103498 (COBRE); 5P20RR024206 (SM); and R01GM083158-01A1 (SM).
Footnotes
Conflict of interest
The authors declare no conflict of interest.
Supplementary information is available at the Oncogene website (http://www.nature.com/onc)
References
- 1.Maris JM, Hogarty MD, Bagatell R, Cohn SL. Neuroblastoma. Lancet. 2007 Jun 23;369(9579):2106–20. doi: 10.1016/S0140-6736(07)60983-0. [DOI] [PubMed] [Google Scholar]
- 2.Brodeur GM. Neuroblastoma: biological insights into a clinical enigma. Nat Rev Cancer. 2003 Mar;3(3):203–16. doi: 10.1038/nrc1014. [DOI] [PubMed] [Google Scholar]
- 3.Miller FD, Kaplan DR. Neurotrophin signalling pathways regulating neuronal apoptosis. Cell Mol Life Sci. 2001 Jul;58(8):1045–53. doi: 10.1007/PL00000919. [DOI] [PMC free article] [PubMed] [Google Scholar]
- 4.Reichardt LF. Neurotrophin-regulated signalling pathways. Philos Trans R Soc Lond B Biol Sci. 2006 Sep 29;361(1473):1545–64. doi: 10.1098/rstb.2006.1894. [DOI] [PMC free article] [PubMed] [Google Scholar]
- 5.Nakagawara A. Molecular basis of spontaneous regression of neuroblastoma: role of neurotrophic signals and genetic abnormalities. Hum Cell. 1998 Sep;11(3):115–24. [PubMed] [Google Scholar]
- 6.Schramm A, Schulte JH, Astrahantseff K, Apostolov O, Limpt V, Sieverts H, et al. Biological effects of TrkA and TrkB receptor signaling in neuroblastoma. Cancer Lett. 2005 Oct 18;228(1–2):143–53. doi: 10.1016/j.canlet.2005.02.051. [DOI] [PubMed] [Google Scholar]
- 7.Straub JA, Sholler GL, Nishi R. Embryonic sympathoblasts transiently express TrkB in vivo and proliferate in response to brain-derived neurotrophic factor in vitro. BMC Dev Biol. 2007;7:10. doi: 10.1186/1471-213X-7-10. [DOI] [PMC free article] [PubMed] [Google Scholar]
- 8.Reiff T, Tsarovina K, Majdazari A, Schmidt M, del Pino I, Rohrer H. Neuroblastoma phox2b variants stimulate proliferation and dedifferentiation of immature sympathetic neurons. J Neurosci. Jan 20;30(3):905–15. doi: 10.1523/JNEUROSCI.5368-09.2010. [DOI] [PMC free article] [PubMed] [Google Scholar]
- 9.Matsumoto K, Wada RK, Yamashiro JM, Kaplan DR, Thiele CJ. Expression of brain-derived neurotrophic factor and p145TrkB affects survival, differentiation, and invasiveness of human neuroblastoma cells. Cancer Res. 1995 Apr 15;55(8):1798–806. [PubMed] [Google Scholar]
- 10.Brodeur GM, Nakagawara A, Yamashiro DJ, Ikegaki N, Liu XG, Azar CG, et al. Expression of TrkA, TrkB and TrkC in human neuroblastomas. J Neurooncol. 1997 Jan;31(1–2):49–55. doi: 10.1023/a:1005729329526. [DOI] [PubMed] [Google Scholar]
- 11.Nakagawara A, Azar CG, Scavarda NJ, Brodeur GM. Expression and function of TRK-B and BDNF in human neuroblastomas. Mol Cell Biol. 1994 Jan;14(1):759–67. doi: 10.1128/mcb.14.1.759. [DOI] [PMC free article] [PubMed] [Google Scholar]
- 12.Kim CJ, Matsuo T, Lee KH, Thiele CJ. Up-regulation of insulin-like growth factor-II expression is a feature of TrkA but not TrkB activation in SH-SY5Y neuroblastoma cells. Am J Pathol. 1999 Nov;155(5):1661–70. doi: 10.1016/S0002-9440(10)65481-8. [DOI] [PMC free article] [PubMed] [Google Scholar]
- 13.Scala S, Wosikowski K, Giannakakou P, Valle P, Biedler JL, Spengler BA, et al. Brain-derived neurotrophic factor protects neuroblastoma cells from vinblastine toxicity. Cancer Res. 1996 Aug 15;56(16):3737–42. [PubMed] [Google Scholar]
- 14.Jaboin J, Kim CJ, Kaplan DR, Thiele CJ. Brain-derived neurotrophic factor activation of TrkB protects neuroblastoma cells from chemotherapy-induced apoptosis via phosphatidylinositol 3′-kinase pathway. Cancer Res. 2002 Nov 15;62(22):6756–63. [PubMed] [Google Scholar]
- 15.Ho R, Eggert A, Hishiki T, Minturn JE, Ikegaki N, Foster P, et al. Resistance to chemotherapy mediated by TrkB in neuroblastomas. Cancer Res. 2002 Nov 15;62(22):6462–6. [PubMed] [Google Scholar]
- 16.Eggert A, Grotzer MA, Ikegaki N, Liu XG, Evans AE, Brodeur GM. Expression of the neurotrophin receptor TrkA down-regulates expression and function of angiogenic stimulators in SH-SY5Y neuroblastoma cells. Cancer Res. 2002 Mar 15;62(6):1802–8. [PubMed] [Google Scholar]
- 17.Nakamura K, Martin KC, Jackson JK, Beppu K, Woo CW, Thiele CJ. Brain-derived neurotrophic factor activation of TrkB induces vascular endothelial growth factor expression via hypoxia-inducible factor-1alpha in neuroblastoma cells. Cancer Res. 2006 Apr 15;66(8):4249–55. doi: 10.1158/0008-5472.CAN-05-2789. [DOI] [PubMed] [Google Scholar]
- 18.Arevalo JC, Conde B, Hempstead BL, Chao MV, Martin-Zanca D, Perez P. TrkA immunoglobulin-like ligand binding domains inhibit spontaneous activation of the receptor. Mol Cell Biol. 2000 Aug;20(16):5908–16. doi: 10.1128/mcb.20.16.5908-5916.2000. [DOI] [PMC free article] [PubMed] [Google Scholar]
- 19.Greene LA, Tischler AS. Establishment of a noradrenergic clonal line of rat adrenal pheochromocytoma cells which respond to nerve growth factor. Proc Natl Acad Sci U S A. 1976 Jul;73(7):2424–8. doi: 10.1073/pnas.73.7.2424. [DOI] [PMC free article] [PubMed] [Google Scholar]
- 20.Kaplan DR, Martin-Zanca D, Parada LF. Tyrosine phosphorylation and tyrosine kinase activity of the trk proto-oncogene product induced by NGF. Nature. 1991 Mar 14;350(6314):158–60. doi: 10.1038/350158a0. [DOI] [PubMed] [Google Scholar]
- 21.Jian Z, Nonaka I, Hattori S, Nakamura S. Activation of Ras and protection from apoptotic cell death by BDNF in PC12 cells expressing TrkB. Cell Signal. 1996 Aug;8(5):365–70. doi: 10.1016/0898-6568(96)00069-1. [DOI] [PubMed] [Google Scholar]
- 22.Lo LC, Birren SJ, Anderson DJ. V-myc immortalization of early rat neural crest cells yields a clonal cell line which generates both glial and adrenergic progenitor cells. Dev Biol. 1991 May;145(1):139–53. doi: 10.1016/0012-1606(91)90220-w. [DOI] [PubMed] [Google Scholar]
- 23.Urschitz J, Kawasumi M, Owens J, Morozumi K, Yamashiro H, Stoytchev I, et al. Helper-independent piggyBac plasmids for gene delivery approaches: strategies for avoiding potential genotoxic effects. Proc Natl Acad Sci U S A. 2010 May 4;107(18):8117–22. doi: 10.1073/pnas.1003674107. [DOI] [PMC free article] [PubMed] [Google Scholar]
- 24.Singh RK, Lange TS, Kim K, Zou Y, Lieb C, Sholler GL, et al. Effect of indole ethyl isothiocyanates on proliferation, apoptosis, and MAPK signaling in neuroblastoma cell lines. Bioorg Med Chem Lett. 2007 Nov 1;17(21):5846–52. doi: 10.1016/j.bmcl.2007.08.032. [DOI] [PMC free article] [PubMed] [Google Scholar]
- 25.Tacconelli A, Farina AR, Cappabianca L, Desantis G, Tessitore A, Vetuschi A, et al. TrkA alternative splicing: a regulated tumor-promoting switch in human neuroblastoma. Cancer Cell. 2004 Oct;6(4):347–60. doi: 10.1016/j.ccr.2004.09.011. [DOI] [PubMed] [Google Scholar]
- 26.Thullberg M, Stromblad S. Anchorage-independent cytokinesis as part of oncogenic transformation? Cell Cycle. 2008 Apr 15;7(8):984–8. doi: 10.4161/cc.7.8.5674. [DOI] [PubMed] [Google Scholar]
- 27.Chiarugi P, Giannoni E. Anoikis: a necessary death program for anchorage-dependent cells. Biochem Pharmacol. 2008 Dec 1;76(11):1352–64. doi: 10.1016/j.bcp.2008.07.023. [DOI] [PubMed] [Google Scholar]
- 28.McKenzie AJ, Campbell SL, Howe AK. Protein kinase A activity and anchoring are required for ovarian cancer cell migration and invasion. PLoS One. 6(10):e26552. doi: 10.1371/journal.pone.0026552. [DOI] [PMC free article] [PubMed] [Google Scholar]
- 29.Hecht M, Schulte JH, Eggert A, Wilting J, Schweigerer L. The neurotrophin receptor TrkB cooperates with c-Met in enhancing neuroblastoma invasiveness. Carcinogenesis. 2005 Dec;26(12):2105–15. doi: 10.1093/carcin/bgi192. [DOI] [PubMed] [Google Scholar]
- 30.Li CW, Xia W, Huo L, Lim SO, Wu Y, Hsu JL, et al. Epithelial-Mesenchymal Transition Induced by TNF-alpha Requires NF-kappaB-Mediated Transcriptional Upregulation of Twist1. Cancer Res. 2012 Mar 1;72(5):1290–300. doi: 10.1158/0008-5472.CAN-11-3123. [DOI] [PMC free article] [PubMed] [Google Scholar]
- 31.Martin-Zanca D, Hughes SH, Barbacid M. A human oncogene formed by the fusion of truncated tropomyosin and protein tyrosine kinase sequences. Nature. 1986 Feb-Mar;319(6056):743–8. doi: 10.1038/319743a0. [DOI] [PubMed] [Google Scholar]
- 32.Douma S, Van Laar T, Zevenhoven J, Meuwissen R, Van Garderen E, Peeper DS. Suppression of anoikis and induction of metastasis by the neurotrophic receptor TrkB. Nature. 2004 Aug 26;430(7003):1034–9. doi: 10.1038/nature02765. [DOI] [PubMed] [Google Scholar]
- 33.Glass DJ, Nye SH, Hantzopoulos P, Macchi MJ, Squinto SP, Goldfarb M, et al. TrkB mediates BDNF/NT-3-dependent survival and proliferation in fibroblasts lacking the low affinity NGF receptor. Cell. 1991 Jul 26;66(2):405–13. doi: 10.1016/0092-8674(91)90629-d. [DOI] [PubMed] [Google Scholar]
- 34.Klein R, Nanduri V, Jing SA, Lamballe F, Tapley P, Bryant S, et al. The trkB tyrosine protein kinase is a receptor for brain-derived neurotrophic factor and neurotrophin-3. Cell. 1991 Jul 26;66(2):395–403. doi: 10.1016/0092-8674(91)90628-c. [DOI] [PMC free article] [PubMed] [Google Scholar]
- 35.Cimmino F, Schulte JH, Zollo M, Koster J, Versteeg R, Iolascon A, et al. Galectin-1 is a major effector of TrkB-mediated neuroblastoma aggressiveness. Oncogene. 2009 May 14;28(19):2015–23. doi: 10.1038/onc.2009.70. [DOI] [PubMed] [Google Scholar]
- 36.Yu Y, Zhang S, Wang X, Yang Z, Ou G. Overexpression of TrkB promotes the progression of colon cancer. APMIS. 2010 Mar;118(3):188–95. doi: 10.1111/j.1600-0463.2009.02577.x. [DOI] [PubMed] [Google Scholar]
- 37.Kupferman ME, Jiffar T, El-Naggar A, Yilmaz T, Zhou G, Xie T, et al. TrkB induces EMT and has a key role in invasion of head and neck squamous cell carcinoma. Oncogene. Apr 8;29(14):2047–59. doi: 10.1038/onc.2009.486. [DOI] [PMC free article] [PubMed] [Google Scholar]
- 38.Zhang S, Guo D, Luo W, Zhang Q, Zhang Y, Li C, et al. TrkB is highly expressed in NSCLC and mediates BDNF-induced the activation of Pyk2 signaling and the invasion of A549 cells. BMC Cancer. 2010;10:43. doi: 10.1186/1471-2407-10-43. [DOI] [PMC free article] [PubMed] [Google Scholar]
- 39.Brodeur GM, Minturn JE, Ho R, Simpson AM, Iyer R, Varela CR, et al. Trk receptor expression and inhibition in neuroblastomas. Clin Cancer Res. 2009 May 15;15(10):3244–50. doi: 10.1158/1078-0432.CCR-08-1815. [DOI] [PMC free article] [PubMed] [Google Scholar]
- 40.Huang YT, Lai PC, Wu CC, Hsu SH, Cheng CC, Lan YF, et al. BDNF mediated TrkB activation is a survival signal for transitional cell carcinoma cells. Int J Oncol. 2010 Jun;36(6):1469–76. doi: 10.3892/ijo_00000633. [DOI] [PubMed] [Google Scholar]
- 41.Molenaar JJ, Koster J, Ebus ME, van Sluis P, Westerhout EM, de Preter K, et al. Copy number defects of G1-cell cycle genes in neuroblastoma are frequent and correlate with high expression of E2F target genes and a poor prognosis. Genes Chromosomes Cancer. 2011 Jan;51(1):10–9. doi: 10.1002/gcc.20926. [DOI] [PubMed] [Google Scholar]
- 42.Valsesia-Wittmann S, Magdeleine M, Dupasquier S, Garin E, Jallas AC, Combaret V, et al. Oncogenic cooperation between H-Twist and N-Myc overrides failsafe programs in cancer cells. Cancer Cell. 2004 Dec;6(6):625–30. doi: 10.1016/j.ccr.2004.09.033. [DOI] [PubMed] [Google Scholar]
- 43.Liu C, Park M, Tsao MS. Overexpression of c-met proto-oncogene but not epidermal growth factor receptor or c-erbB-2 in primary human colorectal carcinomas. Oncogene. 1992 Jan;7(1):181–5. [PubMed] [Google Scholar]
- 44.Tokunou M, Niki T, Eguchi K, Iba S, Tsuda H, Yamada T, et al. c-MET expression in myofibroblasts: role in autocrine activation and prognostic significance in lung adenocarcinoma. Am J Pathol. 2001 Apr;158(4):1451–63. doi: 10.1016/S0002-9440(10)64096-5. [DOI] [PMC free article] [PubMed] [Google Scholar]
- 45.Lengyel E, Prechtel D, Resau JH, Gauger K, Welk A, Lindemann K, et al. C-Met overexpression in node-positive breast cancer identifies patients with poor clinical outcome independent of Her2/neu. Int J Cancer. 2005 Feb 10;113(4):678–82. doi: 10.1002/ijc.20598. [DOI] [PubMed] [Google Scholar]
- 46.Ramirez R, Hsu D, Patel A, Fenton C, Dinauer C, Tuttle RM, et al. Over-expression of hepatocyte growth factor/scatter factor (HGF/SF) and the HGF/SF receptor (cMET) are associated with a high risk of metastasis and recurrence for children and young adults with papillary thyroid carcinoma. Clin Endocrinol (Oxf) 2000 Nov;53(5):635–44. doi: 10.1046/j.1365-2265.2000.01124.x. [DOI] [PubMed] [Google Scholar]
- 47.Furukawa T, Duguid WP, Kobari M, Matsuno S, Tsao MS. Hepatocyte growth factor and Met receptor expression in human pancreatic carcinogenesis. Am J Pathol. 1995 Oct;147(4):889–95. [PMC free article] [PubMed] [Google Scholar]
- 48.Ramsay GM, Moscovici G, Moscovici C, Bishop JM. Neoplastic transformation and tumorigenesis by the human protooncogene MYC. Proc Natl Acad Sci U S A. 1990 Mar;87(6):2102–6. doi: 10.1073/pnas.87.6.2102. [DOI] [PMC free article] [PubMed] [Google Scholar]
- 49.Lugo TG, Witte ON. The BCR-ABL oncogene transforms Rat-1 cells and cooperates with v-myc. Mol Cell Biol. 1989 Mar;9(3):1263–70. doi: 10.1128/mcb.9.3.1263. [DOI] [PMC free article] [PubMed] [Google Scholar]
- 50.Screaton RA, Penn LZ, Stanners CP. Carcinoembryonic antigen, a human tumor marker, cooperates with Myc and Bcl-2 in cellular transformation. J Cell Biol. 1997 May 19;137(4):939–52. doi: 10.1083/jcb.137.4.939. [DOI] [PMC free article] [PubMed] [Google Scholar]
- 51.Schulte JH, Lindner S, Bohrer A, Maurer J, De Preter K, Lefever S, et al. MYCN and ALKF1174L are sufficient to drive neuroblastoma development from neural crest progenitor cells. Oncogene. 2012 Apr 9; doi: 10.1038/onc.2012.106. [DOI] [PubMed] [Google Scholar]
- 52.De Bernardi B, Pianca C, Pistamiglio P, Veneselli E, Viscardi E, Pession A, et al. Neuroblastoma with symptomatic spinal cord compression at diagnosis: treatment and results with 76 cases. J Clin Oncol. 2001 Jan 1;19(1):183–90. doi: 10.1200/JCO.2001.19.1.183. [DOI] [PubMed] [Google Scholar]
- 53.De Bernardi B, Balwierz W, Bejent J, Cohn SL, Garre ML, Iehara T, et al. Epidural compression in neuroblastoma: Diagnostic and therapeutic aspects. Cancer Lett. 2005 Oct 18;228(1–2):283–99. doi: 10.1016/j.canlet.2005.01.053. [DOI] [PubMed] [Google Scholar]
- 54.Plantaz D, Rubie H, Michon J, Mechinaud F, Coze C, Chastagner P, et al. The treatment of neuroblastoma with intraspinal extension with chemotherapy followed by surgical removal of residual disease. A prospective study of 42 patients--results of the NBL 90 Study of the French Society of Pediatric Oncology. Cancer. 1996 Jul 15;78(2):311–9. doi: 10.1002/(SICI)1097-0142(19960715)78:2<311::AID-CNCR19>3.0.CO;2-Z. [DOI] [PubMed] [Google Scholar]
- 55.Seeger RC, Brodeur GM, Sather H, Dalton A, Siegel SE, Wong KY, et al. Association of multiple copies of the N-myc oncogene with rapid progression of neuroblastomas. N Engl J Med. 1985 Oct 31;313(18):1111–6. doi: 10.1056/NEJM198510313131802. [DOI] [PubMed] [Google Scholar]
- 56.Weiss WA, Aldape K, Mohapatra G, Feuerstein BG, Bishop JM. Targeted expression of MYCN causes neuroblastoma in transgenic mice. EMBO J. 1997 Jun 2;16(11):2985–95. doi: 10.1093/emboj/16.11.2985. [DOI] [PMC free article] [PubMed] [Google Scholar]
- 57.Schwab M, Ellison J, Busch M, Rosenau W, Varmus HE, Bishop JM. Enhanced expression of the human gene N-myc consequent to amplification of DNA may contribute to malignant progression of neuroblastoma. Proc Natl Acad Sci U S A. 1984 Aug;81(15):4940–4. doi: 10.1073/pnas.81.15.4940. [DOI] [PMC free article] [PubMed] [Google Scholar]
- 58.Minturn JE, Evans AE, Villablanca JG, Yanik GA, Park JR, Shusterman S, et al. Phase I trial of lestaurtinib for children with refractory neuroblastoma: a new approaches to neuroblastoma therapy consortium study. Cancer Chemother Pharmacol. 2011 Oct;68(4):1057–65. doi: 10.1007/s00280-011-1581-4. [DOI] [PMC free article] [PubMed] [Google Scholar]
- 59.Feldman JP, Goldwasser R, Mark S, Schwartz J, Orion I. A mathematical model for tumor volume evaluation using two dimensions. Journal of Applied Quantitative Methods. 2009;4(4):455–62. [Google Scholar]
Associated Data
This section collects any data citations, data availability statements, or supplementary materials included in this article.
Supplementary Materials
Supplemental Figure 1: Construction of a constitutively active TrkB receptor by removal of the two immunoglobulin-like ligand binding domains. (a) The 193 amino acid sequence coding for the two immunoglobulin (Ig)-like ligand binding domains (shown in grey italics) of the 629 amino acid TrkB protein was removed by restriction digest. (b) The full length wild type TrkB protein consists of two cysteine-rich domains (CRD) surrounding a leucine-rich domain (LRD), two immunoglobulin-like domains (IGD), and the intracellular tyrosine kinase domain (TKD). In the ΔIgTrkB construct the two Ig-like domains have been removed. The three vectors used to express the ΔIgTrkB construct were: pcDNA3 (promoter = CMV with a neomycin selection cassette); pTRE Tight) tetracycline response element in front of the gene of interest); pmGenie3 (beta-actin promoter in a PiggyBac transposon, transposase vector that also expresses dsRed).
Supplemental Figure 2: Proliferation in NCM-1 cell lines. ΔIgTrkB and WT NCM-1 cells, plus 5 additional NCM-1 cell lines stably transfected with ΔIgTrkB were grown in culture. All ΔIgTrkB transfected cell lines have enhanced proliferation shown by enhanced Calcein AM fluorescence compared to wild type cells after 4 days in vitro (p < 0.01, ANOVA, n=8, error bars = SEM).
Supplemental Figure 3: Phospho-histone H3 and cyclin D1 protein are upregulated in ΔIgTrkB NCM-1 cells. These data confirm that markers for proliferation are upregulated in ΔIgTrkB NCM-1 cells in concert with the observed increases in the rate of proliferation measured by counting cells after fixed times (a) scanned image of western blot of phospho-histone H3 acquired with Odyssey Licor Infrared Laser Scanner. (b) quantification of the western blot using Licor software showing a two-fold increase in expression (p < 0.05, Student’s t-test, n=3, error bars = SEM). (c) Western blot of cyclin D1 protein in ΔIgTrkB NCM-1 cells and wild type NCM-1 cells. (d) Quantification of cyclin D1 protein expression reveals a significant 6-fold upregulation of cyclin D1 protein in ΔIgTrkB NCM-1 cells (p < 0.01, Student’s t-test, n=3, error bars = SEM).