

Background: Lipodystrophic Agpat2−/− mice are severely diabetic and insulin resistant.
Results: Livers of Agpat2−/− mice have elevated levels of phosphatidic acids (PAs), which enhance gluconeogenesis.
Conclusion: PA enhanced hepatic gluconeogenesis contributes to the hyperglycemia present in Agpat2−/− mice.
Significance: PA enhanced hepatic gluconeogenesis might have wider implications in understanding the development of hyperglycemia in type 2 diabetes.
Keywords: Gluconeogenesis, Insulin Resistance, Lipids, Lipodystrophy, Phosphatidic Acid
Abstract
In this study we examined the role of phosphatidic acid (PA) in hepatic glucose production (HGP) and development of hepatic insulin resistance in mice that lack 1-acylglycerol-3-phosphate O-acyltransferase 2 (AGPAT2). Liver lysophosphatidic acid and PA levels were increased ∼2- and ∼5-fold, respectively, in male Agpat2−/− mice compared with wild type mice. In the absence of AGPAT2, the liver can synthesize PAs by activating diacylglycerol kinase or phospholipase D, both of which were elevated in the livers of Agpat2−/− mice. We found that PAs C16:0/18:1 and C18:1/20:4 enhanced HGP in primary WT hepatocytes, an effect that was further enhanced in primary hepatocytes from Agpat2−/− mice. Lysophosphatidic acids C16:0 and C18:1 failed to increase HGP in primary hepatocytes. The activation of HGP was accompanied by an up-regulation of the key gluconeogenic enzymes glucose-6-phosphatase and phosphoenolpyruvate carboxykinase. This activation was suppressed by insulin in the WT primary hepatocytes but not in the Agpat2−/− primary hepatocytes. Thus, the lack of normal insulin signaling in Agpat2−/− livers allows unrestricted PA-induced gluconeogenesis significantly contributing to the development of hyperglycemia in these mice.
Introduction
White adipose tissue is a key organ involved in glucose and lipid homeostasis. White adipose tissue stores excess fatty acids as triacylglycerol and releases free fatty acids via lipolysis. The 1-acylglycerol-3-phosphate O-acyltransferase (AGPAT)2 enzymes convert 1-acylglycerol-3-phosphate (lysophosphatidic acid, LPA) to 1, 2-diacylglycerol-3-phosphate (phosphatidic acid, PA) and play a critical role in the biosynthesis of triacylglycerols and glycerophospholipids (1, 2).
There are at least 11 known isoforms of AGPAT, each encoded by a different gene (3). We have previously reported that AGPAT2 mutations result in autosomal recessive congenital generalized lipodystrophy type 1 (CGL1) (4). Patients with CGL1 are born without any detectable white adipose tissue but still develop severe insulin resistance (IR) and type 2 diabetes in their first decade of life and, in some, the IR is so severe that it manifests as acanthosis nigricans, hypertriglyceridemia, hepatic steatosis, and type 2 diabetes (5, 6).
To further understand the physiological role of AGPAT2 in the pathogenesis of lipodystrophy associated metabolic complications, we developed and phenotyped an Agpat2 knock-out mouse (7). These mice lack both brown adipose and white adipose tissue and recapitulate all of the features manifest in human CGL1. The livers of Agpat2−/− mice have ∼10% residual AGPAT activity compared with wild type (WT) mice. The marked reduction in AGPAT activity would predict significantly lower hepatic PA levels. Surprisingly, total glycerophospholipid levels in the livers of Agpat2−/− mice were not very different from those of WT mice (7). Similar observations were reported in cultured OP9 cells, a cultured cell model for adipogenesis (8). Inhibiting Agpat2 expression in these cells using siRNA indicated that additional pathway(s) might exist to generate PA (8).
Here, we used Agpat2−/− mice to determine whether PAs contribute to the development of IR in liver. PA can bind to the FK506-binding protein (FKBP12)-rapamycin-binding (FRB) domain of mammalian target of rapamycin (mTOR) and thus regulate its activity (9–11). We hypothesized that there may be different molecular species of PA that modulate mTORC1 or mTORC2 activities, thereby regulating insulin signaling and hepatic gluconeogenesis. In this study, we determined the molecular species of endogenous LPA and PA in livers of Agpat2−/− mice and tested the effects of these PAs on glucose and lipid metabolism in primary hepatocytes. When the primary hepatocytes were incubated with PAs, we observed increased glucose output, an effect that was inhibited by insulin in WT but not in primary hepatocytes obtained from Agpat2−/− mice. Thus, our study shows for the first time that PAs alter hepatic gluconeogenesis.
EXPERIMENTAL PROCEDURES
Animals
All animal studies were approved by the Institutional Use and Care of Animals and BioSafety Committee at the University of Texas Southwestern Medical Center.
Isolation, Separation, and Quantification of Total LPA and PA by High Performance Liquid Chromatography (HPLC) from Mouse Livers
The extraction of LPA and PA was performed as described previously (12). Approximately 250 mg of liver from 4-month-old WT or Agpat2−/− mice from C57BL/6 and 129Sv mixed background was homogenized in 100 mm Tris-HCl, pH 7.5, containing 10 mm NaCl. Cellular debris was removed by centrifugation at 3000 × g for 5 min at 4 °C and an aliquot was used to extract DNA. DNA was extracted with Easy-DNA kit (Invitrogen) following the manufacturer's protocol. A known volume of the homogenate was used to extract total LPA and total PA using 1-butanol, 1 n HCl as reported elsewhere (13). The upper aqueous phase was removed and the extraction was repeated twice with water-saturated butanol (4:1) and the upper aqueous phase was combined with the previous extract and dried under vacuum. The dried phospholipid extracts were resuspended in a known volume of chloroform. LPA and PA standards were resolved using a gradient solvent system: Buffer A, chloroform/methanol/water/ammonium hydroxide (80:19.5:0:0.5, v/v) and Buffer B, chloroform/methanol/water/ammonium hydroxide (60:34:5:0.5, v/v) (14) on a Supelcosil LC-Diol column (5 μm; 25 cm × 4.6 mm, Sigma) connected to a Waters 1525 HPLC (Waters corporation, Milford, MA) equipped with an evaporative light scattering detector (Waters 2420). Standard curves were generated for LPA and PA and used to determine the concentration of liver LPA and PA using Breeze software (version 3.30 SPA). Standard phospholipids 1-oleoyl-2-hydroxy-sn-glycero-3-phosphate (LPA) and 1,2-dioleoyl-sn-glycero-3-phosphate (PA) were from Avanti Polar Lipids (Alabaster, AL). The concentrations of LPA and PA were normalized to DNA.
Digestion of Total PA with Phospholipase A2 (PLA2) and Methylation of Free Fatty Acids
The total PA (200 μg) extracted from the livers of WT and Agpat2−/− mice was vacuum dried and resuspended in 50 μl of PLA2 assay buffer (50 mm Tris-HCl, 100 mm NaCl, 1 mm CaCl2, pH 8.9) and digested with 1.6 units of PLA2 from snake venom (Worthington) for 20 min at 25 °C. The digested samples were spotted on Silica Gel 60 Å thin layer chromatography (TLC) glass plates. The LPA, PA, and fatty acids were resolved using the solvent system chloroform/methanol/acetic acid/water (25:10:3:1, v/v) and visualized in iodine vapors. The released free fatty acids were transmethylated as described previously with slight modifications (15). The spots corresponding to free fatty acids were scraped and suspended in 2 ml of methanol/hexane (4:1, v/v) containing 200 μl of acetyl chloride, and the mixture was heated at 100 °C for 1 h. The samples were cooled to room temperature (RT) and 6% potassium carbonate was added. The methyl esters of fatty acids were extracted in hexane. The hexane extracts were analyzed on an Agilent 6890 gas chromatographic (GC) system equipped with a flame ionization detector under the following conditions: a DB-23 (HP-5ms, 30 m, 0.25 mm, 0.25 μm, Agilent) capillary column was used with hydrogen (2 ml/min) as carrier gas. Helium was used as the makeup gas. The temperature of the oven was maintained at 225 °C for 3 min, and then raised to 265 °C for 20 min. An Agilent gas chromatography fitted with a split/splitless injection system was used with the split ratio set to 50:1. The flame ionization detector was maintained at 300 °C. The concentration of various fatty acids was determined by the peak area of the fatty acid methyl esters with Agilent G1701DA GC/MSD ChemStation software (version D.00.00.38). The percent recovery of each fatty acid was normalized to C19:0 used as an internal standard (Avanti Polar Lipids).
Phospholipid Analysis by Mass Spectrometry
An automated electrospray ionization-tandem mass spectrometry was used, and data acquisition and analysis were carried out as described previously (16) with few modifications. The dried fractions of LPA (10 μg) and PA (10 μg) were resuspended in chloroform. C13:0/LPA (0.4 nmol), C14:0/LPA, and C17:1/PA (0.3 nmol) (Avanti Polar Lipids) were added as internal standards. This was combined with solvents such that the ratio of chloroform, methanol, 300 mm ammonium acetate in water was 300:665:35. LPA and PA fractions were introduced by continuous infusion into the ESI source on a triple quadrupole MS/MS (4000QTrap, Applied Biosystems, Foster City, CA). Samples were introduced using an autosampler (LC Mini PAL, CTC Analytics AG, Zwingen, Switzerland) fitted with the required injection loop for the acquisition time and presented to the ESI needle at 30 μl/min.
Sequential precursor and neutral loss scans of the LPA and PA fractions, respectively, produced a series of spectra with each spectrum revealing different molecular species of LPA and PA. LPA species were detected in negative mode [M − H]− with precursor 152.9; PA was detected in positive ion mode [M + NH4]+ with neutral loss 115.0. The scan speed was 100 units/s. The collision gas pressure was set at 2 (arbitrary units). The collision energies, with nitrogen in the collision cell, were +25 V for PA and −51 V for LPA. Declustering potentials were +100 V for PA and −100 V for LPA. Entrance potentials were +14 V for PA and −10 V for LPA. Exit potentials were +14 V for PA and −14 V for LPA. The mass analyzers were adjusted to a resolution of 0.7 unit of full width at half-height. For each spectrum, 200 to 400 continuum scans were averaged in multiple channel analyzer mode. The source temperature (heated nebulizer) was 100 °C, the interface heater was on, +5.5 kV or −4.5 kV were applied to the electrospray capillary, the curtain gas was set at 20 (arbitrary units), and the two ion source gases were set at 45 (arbitrary units). The background of each spectrum was subtracted, the data were smoothed, and peak areas were integrated using a custom script and Applied Biosystems Analyst software. After isotopic deconvolution, the various molecular species of LPA and PA were quantified in comparison to the internal standards of that class (17). To correct for chemical or instrumental noise in the samples, the molar amount of each phospholipid detected in the “internal standards only” spectra was subtracted from the molar amount of each metabolite calculated in each set of sample spectra. The data were also corrected for the fraction of the sample analyzed from the HPLC. Based on this data, the total amount of individual LPA and PA species was calculated and normalized to DNA.
Saturation Curves for Phospholipase D (Pld) and Diacylglycerol Kinase (Dagk) Enzymes
PLD assay was performed using different concentrations of the substrate C18:1/18:1 PC from 0.0038 to 1.272 μm. DAGK assay was performed using different concentrations of the substrate C18:1/18:1 DAG from 0.0048 to 0.61 μm.
Phospholipase D (PLD) Activity in Liver Homogenates
The PLD assay was carried out as described previously (18). The assay reaction (200 μl) contained 50 mm Hepes-KOH, pH 7.5, 250 mm sucrose, 80 mm potassium chloride, 4.5 mm magnesium chloride, 3 mm calcium chloride, 3 mm EGTA, 1 mm dithiothreitol, protease inhibitors, and 100 μm GTP. Enzymatic reaction was started by adding 100 μg of whole cell lysate. The substrate was provided as mixed micelles of 0.012 μm 1,2-dioleoyl-sn-glycero-3-phosphocholine (C18:1/18:1 phosphatidylcholine) and [3H]1,2-distearoyl-sn-glycero-3-phosphocholine (C18:0/18:0 phosphatidylcholine) (American Radiolabeled Chemicals. Inc., St. Louis, MO) prepared by evaporating the chloroform and resuspending in the assay buffer. The reactions were incubated at 37 °C for 30 min. Enzymatic reactions were stopped by addition of 1 ml of chloroform/methanol/concentrated HCl (50:50:0.3) and 0.35 ml of 1 m HCl, 5 mm EDTA, followed by vigorous mixing. After centrifugation at 1000 × g for 10 min at 4 °C, the lower organic phase was recovered and the above extraction was repeated twice. The lower phases were combined and dried under a stream of N2 gas. Dried lipid films were resuspended in chloroform and spotted onto Silica Gel G-60 plates along with C18:1/18:1 PA standard (Avanti Polar Lipids). Plates were run using a solvent system of chloroform/methanol/acetic acid/water (25:10:3:1, v/v) and developed with iodine vapors. The bands corresponding to PA were scraped and the radioactivity was determined by liquid scintillation.
Diacylglycerol Kinase (Dagk) Activity in Liver Homogenates
DAGK assay was carried out as described previously with slight modifications (19). The enzymatic reaction was assembled in 150 μl containing 50 mm Tris acetate, pH 7.4, 10 mm magnesium acetate, 80 mm KCl, 2 mm EGTA, 0.016 μm 1,2-dioleoyl-sn-glycerol (DAG), and 20 μm ATP. The stock solution of DAG in chloroform was dried under a nitrogen stream; resuspended in a small volume of 50 mm Tris acetate, pH 7.4, 10 mm magnesium acetate, 80 mm KCl, and 2 mm EGTA; and sonicated in a water bath for 15 min before being added to the reaction mixture. The enzymatic reaction was started by adding 1 μCi of [γ-32P]ATP (PerkinElmer Life Sciences) and 50 μg of total protein. Standard assays were performed for 30 min at RT. PA was extracted by the addition of 500 μl of 1-butanol, 1 n HCl. After centrifugation at 1000 × g, the aqueous layer was recovered, dried under a stream of nitrogen, dissolved in a known volume of chloroform/methanol (2:1), and applied to Silica Gel G-60 plates along with the C18:1/18:1 PA standard. Plates were developed with a solvent system of chloroform/methanol/acetic acid/water (25:10:3:1) and visualized in iodine vapors. Lipids were identified by iodine staining, labeled PA spots were scraped off, and the radioactivity was determined by liquid scintillation.
Isolation of Mouse Primary Hepatocytes
Primary hepatocytes were isolated from 1-month-old non-fasted mice of both genders by a two-step collagenase perfusion method as described earlier (20, 21). Briefly, mice were anesthetized with isoflurane and a catheter (24 × 3/4 inch safelet catheter, Fisher Scientific) was inserted in the portal vein. The liver was perfused with the liver perfusion medium (Life Technologies) maintained at 37 °C using a peristaltic pump at a rate of 3 ml/min until the liver blanched. The liver was then perfused with the liver digest medium (Life Technologies) at a rate of 3 ml/min for 20 min, excised from the animal, and placed in a Petri dish containing the liver digest media at 37 °C. Hepatocytes were released by removing the hepatic capsule and then passed through a 100-μm cell strainer. The cells were washed three times in low glucose DMEM containing 100 mm Hepes by centrifuging at 25 × g for 2 min at 4 °C. The cell pellet was resuspended in low glucose DMEM containing 10% FBS and 1% antibiotics. Approximately 1 × 10⁶ cells were seeded into each well of a collagen-coated 6-well plate (Fisher Scientific) and allowed to attach overnight. The following day cells were prepared for various experiments as described.
Preparation of Liposomes with PA and Transfection of Primary Mouse Hepatocytes
Liposomes were prepared fresh for each experiment. 100 μm C16:0/18:1, C16:0/18:2, or C18:1/20:4 PA and 0.1 μCi of [3H]oleoyl-LPA (PerkinElmer Life Sciences) were dried and resuspended in PBS. The mixture was sonicated for 15 min and the liposomes were used in cell culture experiments.
Immunoblot Analysis
The hepatocytes were lysed in lysis buffer (150 mm NaCl, 50 mm Tris, pH 8.0) containing protease and phosphatase inhibitors (Roche Diagnostics). Cells were sonicated for 15 s with an interval of 1 min and centrifuged at 16,000 × g for 15 min at 4 °C. The whole cell lysate proteins (75 μg) from the hepatocytes were resolved on a precast 7.5 or 10% SDS-PAGE (Bio-Rad) followed by transfer onto PVDF membranes (Millipore, Billerica, MA). The membranes were blocked with 5% nonfat dry milk containing 0.2% Tween 20 and then incubated with the primary antibody. Immunoblot analysis was carried out by following the procedures recommended by antibody suppliers.
The antibodies to total mTOR, mTORC1 (Ser-2481), mTORC2 (Ser-2448), total S6K, pS6K (Thr-389), and pAkt (Thr-308) were from Cell Signaling Technology and used at a dilution of 1:1000 at 4 °C overnight; total Akt and pAkt (Ser-473) were from Santa Cruz Biotechnology and used at a dilution of 1:200 at RT for 1 h. All blots were incubated with secondary antibody to IgG (goat anti-rabbit IgY conjugated to horseradish peroxidase (HRP)) at a 1:5000 dilution for 1 h at RT (Santa Cruz Biotechnology) and detected with Immobilon Western chemiluminescent HRP substrate (Millipore, Billerica, MA) and exposed onto x-ray films. The same blot was stripped using Restore Western blot stripping buffer (Pierce), according to the manufacturer's protocol, and re-probed with GAPDH antibody at 1:5000 dilution (mouse monoclonal, Ambion, Austin, TX). Each blot was stripped and reprobed with GAPDH considering that the protein concentration may vary from blot to blot. Films were scanned and band densities were determined with ImageJ 1.45s and normalized to GAPDH.
Quantitative Real-time PCR in Livers of WT and Agpat2−/− Mice
All Q-PCR were carried out in a 20-μl reaction volume in 96-well plates using the ABI PRISM 7700 sequence detection system (Applied Biosystems) as reported previously (7). Q-PCR was performed in duplicate and the transcript levels were normalized to cyclophilin. Primers used are listed in Table 1.
TABLE 1.
Primers used in this study
| Target mRNA | Forward primer | Reverse primer |
|---|---|---|
| Acc1 | TGGACAGACTGATCGCAGAGAAAG | TGGAGAGCCCCACACACA |
| Fas | GCTGCGGAAACTTCAGGAAAT | AGAGACGTGTCACTCCTGGACTT |
| G6pase | TGGGCAAAATGGCAAGGA | TCTGCCCCAGGAATCAAAAAT |
| Pepck | CCACAGCTGCTGCAGAACA | GAAGGGTCGCATGGCAAA |
| Pld1 | TTCGAGGGAGACATTTCCAC | TTCCAGCTCTGCATGTGTTC |
| Pld2 | TGTTGGAGTGGTTGTACACG | CATGAAGGGGAGATTGTTTG |
| Pld3 | GTAGCAGCCAACGTCTGATT | TTCATTCAAGGGCAGTTCTC |
| Pld4 | AACCACAGCAAGTTCATGGT | GCTCGGGACTTGTCTGTCTA |
| Pld5 | TGTGCAACGAAAGAACAAAA | TGCTCCTGTTGTCTCTCACA |
| Pld6 | CTCTCCTGGGCATCACTAGA | CAAGTCCACAGTCTGGCTCT |
| Dagk1 | GGCTGAGAAGACCAAGTCAA | TCTAGATATTCGGCCACTCG |
| Dagk2 | GCCACCTACCACAATCTGTC | AACTAGAAGCGGATGTGTGC |
| Dagk3 | GAATGTTCTCTGTGCCTGCT | CCTAAGCAGGAGGACTTTCC |
| Dagk4 | AGCGAAAAGTGTGACTTTGG | TCAAACACCTGGACTGGATT |
| Dagk5 | AGTGTTGCATGGTGAGGAAT | CTCATCTTTCAGCCGAGTGT |
| Dagk6 | GTCTTGGGAAGACAAGCAGA | GCTGCGTCACAAATCCTAGT |
| Dagk7 | GAAAGACTTCAGCCACTCCA | TCCGTGGTCAAGGATGTACT |
| Dagk8 | GGGACCTTGATTGGCTTTAT | TGAGGACTGGTGTTCCATTT |
| Dagk9 | GTCCAAAAATGAGCTGCCTA | ACACACAGGAGAAGGCTCTG |
| Dagk10 | AGAAGCCAACCCAGAGAAGT | CTGAATCTTGGGGGTTAGGT |
| G6pase | CGACGCGTCATGAACAAGGGCATGACTG | CCGCTCGAGTCGGGATGGTTCTTACCACT |
| Pepck | CGACGCGTGGGCAAGAAATCACCAAAGA | CCGCTCGAGGGGACTCACCAGTTGTCATATTT |
Glucose Output Assay
Hepatocytes isolated from the livers of 1-month-old WT or Agpat2−/− mice were plated on collagen-coated 6-well plates and allowed to attach overnight. Cells were starved for 1 h by incubating in phenol red-free, glucose-free DMEM (Sigma). Cells were incubated in media containing sodium pyruvate and sodium lactate for 6 h. Before the end of 6 h, the cells were incubated with 100 μm PA (C16:0/18:1; C16:0/18:2, and/or C18:1/20:4 PA) or LPA (16:0 LPA and/or 18:1 LPA) for 30 min and 100 nm insulin for 10 min. Culture media was collected and glucose was measured using a colorimetric assay kit from Cayman Chemical (Ann Arbor, MI). The glucose output rate was normalized by cellular protein content.
Reporter Gene Constructs
The 5′-flanking region of the glucose 6-phosphatase (G6pase) gene from nucleotide −1974 up to +246 and the phosphoenolpyruvate carboxykinase (Pepck) gene from nucleotide −2296 up to +233 was amplified from mouse genomic DNA. The PCR products were gel purified and ligated into pDrive. The insert was released from the recombinant clones by digesting them with MluI and ligated into MluI-digested pGL3 basic vector. Recombinant clones, pGL3-G6pase and pGL3-Pepck, were amplified and isolated by extraction kit from Qiagen (Valencia, CA). Primers used are listed in Table 1.
Transient Transfection of Primary Mouse Hepatocytes
Primary hepatocytes isolated from 1-month-old WT and Agpat2−/− mice were co-transfected with 2 μg/well of pGL3-G6pase or pGL3-Pepck along with 0.1 μg/well of pRL-Luc using Lipofectamine 2000 following the manufacturer's protocol (Life Technologies). Cells were starved in phenol red-free, glucose-free DMEM for 1 h and incubated in DMEM containing sodium pyruvate and sodium lactate for 6 h. Before the end of the 6-h incubation, cells were supplemented with 16:0/18:1, 18:1/20:4, or 16:0/18:2 PA for 30 min and insulin for 10 min. Cell lysates were collected and a dual luciferase assay was performed. The relative luciferase activity was normalized to protein.
Statistical Analyses
Statistical significance was calculated either by Student's t test or two-way analysis of variance using GraphPad Prism version 5.00 for Windows. A p value less than 0.05 is considered statistically significant.
RESULTS
LPA and PA Levels Are Elevated in Livers of Agpat2−/− Mice
Agpat2−/− mice have only ∼10% residual AGPAT activity in liver (7), whereas their total LPA and total PA remain elevated. Because AGPAT converts LPA to PA, we predicted LPA levels would be higher and PA levels would be reduced. As expected, LPA levels increased ∼2-fold in the livers of male mice (Fig. 1A) and female mice showed a trend toward an increase (Fig. 1C). However, instead of decreasing, PA levels were also increased ∼5- and ∼2-fold in the livers of male and female Agpat2−/− mice, respectively (Fig. 1, B and D), indicating alternative pathway(s) exist for the synthesis of PA in the absence of Agpat2. In addition, we have previously reported that the levels of phosphatidylethanolamine, phosphatidylcholine, and phosphatidylserine were elevated in the livers of male Agpat2−/− mice but not in the livers of female Agpat2−/− mice (7).
FIGURE 1.
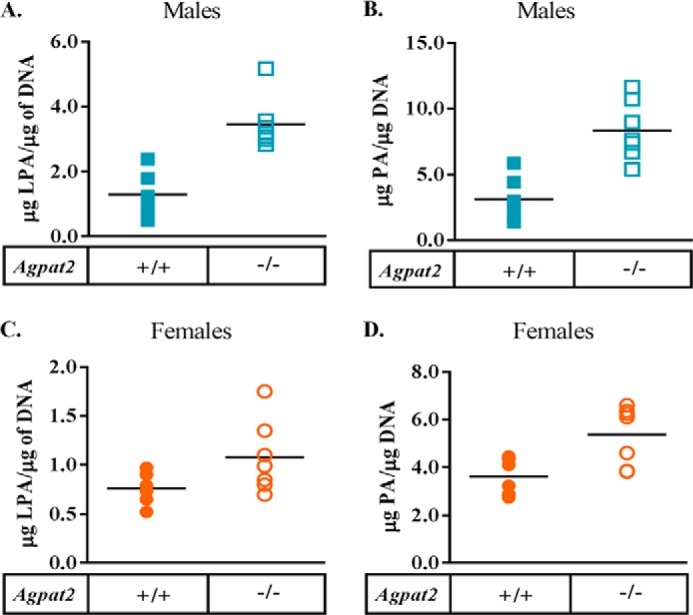
Quantification of LPA and PA in the livers of wild type (WT) and Agpat2−/− mice. LPA and PA were extracted from the livers of 4-month-old WT and Agpat2−/− male and female livers. A and B, LPA and PA levels in WT and Agpat2−/− male livers normalized to DNA. Shown are individual LPA and PA values, n = 6. The p value for LPA and PA was <0.01. C and D, LPA and PA levels in WT and Agpat2−/− female livers normalized to DNA. Shown are individual LPA and PA values, n = 6. p value for PA = 0.01.
Synthesis of PA by Alternate Pathways
In the absence of AGPAT activity, mouse livers can employ alternate pathways to synthesize PA. Two families of enzymes might contribute to the synthesis of PA: phospholipase D (PLD) and diacylglycerol kinase (DAGK) (Fig. 2A). To determine the optimal substrate concentration for measurement of the enzymatic activity for PLD, a saturation curve was generated (Fig. 2B). The Vmax and apparent Km for PLD were 2.77 ± 0.35 nmol/μg of protein and 0.11 ± 0.05 μm, respectively. This allowed us to use the optimal substrate concentration for determining the enzymatic activity.
FIGURE 2.

Increased levels of PA in the livers of male and female Agpat2−/− mice may be due to alternate pathways. A, schematic representation of the various pathways resulting in the synthesis of PA. PA can be generated by enzymes 1-acylglycerol-3-phosphate-O-acyltransferase (AGPAT), phospholipase D (PLD), and diacylglycerol kinase (DAGK). B, saturation curve for PLD enzyme. The apparent rate constants (Vmax) and the apparent affinity constant (Michaelis-Menten, Km) for PLD were determined from three individual livers and performed in triplicates (n = 3). Vmax was expressed as nanomole/μg of protein and Km was expressed as micromolar. C, saturation curve for DAGK enzyme. Vmax and Km for DAGK enzyme were determined from three individual livers and performed in triplicates (n = 3). Vmax was expressed as nanomole/μg of protein and Km was expressed as micromolar. D, PLD enzyme activity determined by the conversion of [3H]phosphatidylcholine to [3H]PA and expressed as nanomole of PA/μg of protein from liver lysates. Assays were performed with individual livers in duplicates (n = 4). The data indicate a statistically significant increase in PLD activity in the livers of Agpat2−/− mice compared with the WT of both genders with a p value of 0.012 in males and 0.023 in females. E, DAGK enzyme activity was determined by the conversion of 1,2-dioleoylglycerol to [32P]PA in the presence of [γ-32P] ATP and expressed as nanomole of PA/μg of protein from liver lysates. Assays were performed with individual livers in duplicates (n = 4). The data indicate a statistically significant increase in DAGK activity in the livers of Agpat2−/− mice compared with the WT of both genders with a p value of 0.03 in males and 0.024 in females. F and G, Q-PCR of various isoforms of Pld and Dagk analyzed in pooled samples (n = 6) from the livers of both genders of Agpat2−/− mice normalized to cyclophilin and expressed as a fold-change relative to WT mice. Pld3 was up-regulated in females, whereas Pld4 was up-regulated in males. Dagk3 was significantly up-regulated in the livers of both the genders. ND, not detected.
As shown in Fig. 2D, livers of Agpat2−/− mice had significantly higher PLD enzymatic activities. This increase in PLD enzymatic activity may be due to the ∼2-fold increase in Pld3 mRNA levels in livers of female Agpat2−/− mice and the ∼4-fold increase in Pld4 mRNA levels found in male Agpat2−/− mice (Fig. 2F).
Similarly, to determine the optimal substrate concentration for measurement of DAGK enzymatic activity, a saturation curve was generated (Fig. 2C). DAGK had a Vmax of 2.54 ± 0.24 nmol/μg of protein and apparent Km of 0.15 ± 0.04 μm. DAGK enzymatic activities in livers of Agpat2−/− mice of both genders were significantly increased compared with WT mice (Fig. 2E). We amplified all 10 Dagk isoforms by Q-PCR and found only Dagk3 was significantly increased in livers of Agpat2−/− mice (Fig. 2G). The substrate specificities for each of these enzymatic isoforms are unclear; therefore, isoform-specific substrate(s) might alter the reported activities of these enzymes in this study. However, the absolute contribution of these two pathways towards the increase of PA in the livers of Agpat2−/− mice remains unclear.
Molecular Species of LPA and PA in the Livers of Agpat2−/− Mice
Next, we determined whether there were any unique molecular species of LPA and PA generated in the livers of Agpat2−/− mice. The total LPA and PA samples purified by HPLC were analyzed using ESI/MS. Interestingly, we did not find any novel LPA or PA species in the livers of Agpat2−/− mice, although some specific LPA and PA species were elevated. The increase in m/z 409.2, 435.3, and 437.2 LPA in males (Fig. 3A) and m/z 409.2 and 437.2 LPA in females (Fig. 3C) was statistically significant. Similarly, only a few PA species were elevated compared with those of WT mice (Fig. 3, B and D). The most abundant PA species were m/z 692.5, 718.5, and 720.5 in males and m/z 692.5 and 720.5 in females, although m/z 720.5 was also elevated but not statistically significant in either gender.
FIGURE 3.

Determination of molecular species of LPA and PA in the livers of wild type and Agpat2−/− mice. A–D, charge-to-mass ratio (m/z) of various LPAs and PAs obtained from mass spectrometry (MS/MS) analysis. LPA and PA fractionated by HPLC were used for MS/MS analysis. LPA and PA levels are expressed as picomole/μg of DNA normalized to C13:0-LPA and C14:0, 17:1-PA (mean ± S.E.; n = 4 in each group). Although no distinct molecular species of PA were detected in the livers of Agpat2−/− mice, PA species 34:2, 34:2, 36:4, 36:3, 36:2, and 38:3 were found to be significantly increased in the livers compared with WT. E and F, levels of various fatty acids released upon digestion of extracted PA with PLA2. The released fatty acids were extracted with methanol/hexane (1:2, v/v). The dried lipid extract was resolved on TLC and the released fatty acid was methylated and resolved using gas chromatography. Fatty acids are expressed as picomole of free fatty acid/μg of DNA. All fatty acids were normalized to C19:0 fatty acid as the internal control (mean ± S.E.; n = 4 in each group). Based on m/z and sn-2 fatty acids four PAs, C16:0/18:2 PA, C16:0/18:1 PA, C18:0/20:3 PA, and C18:1/20:4 PA, were statistically significant. *, p value ≤ 0.05.
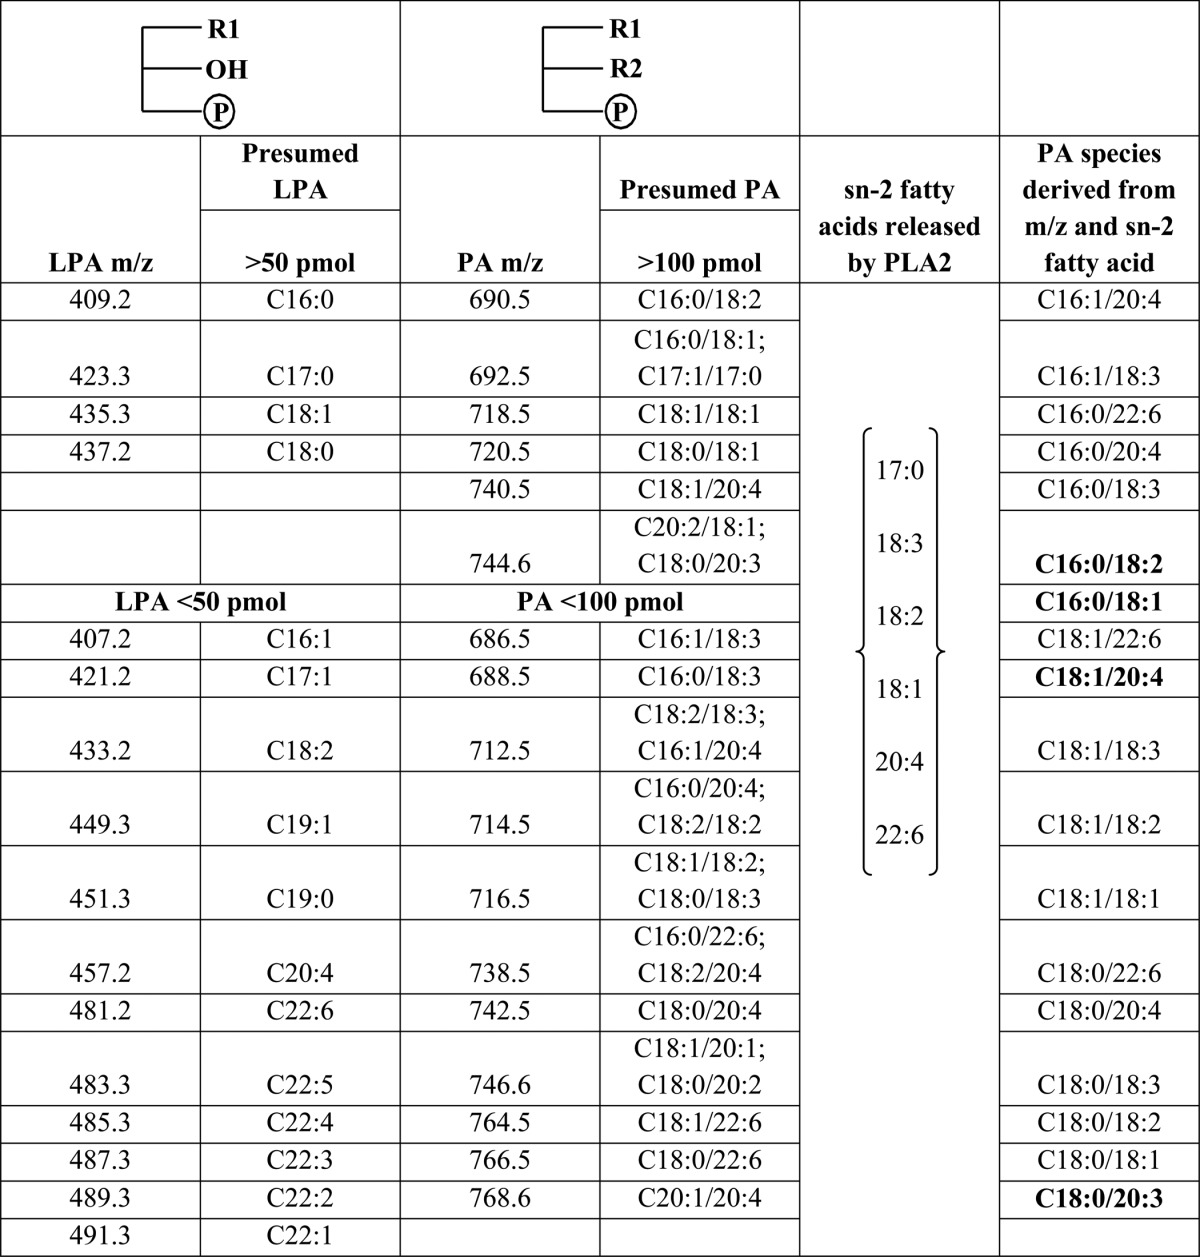
Because the molecular mass obtained by ESI/MS determines both the fatty acids at the sn-1 and sn-2 positions of PA but not the specific fatty acid at either carbon position, we used PLA2, which specifically cleaves the sn-2 fatty acids from phospholipids, to ascertain the sn-2 fatty acids of PAs. When the isolated total PA was digested with PLA2 and analyzed by GC we detected an increase in several fatty acids (Fig. 3E). The largest increase was in C22:6 followed by C20:4, C18:3, C18:1, and C17:0 in male livers. In female livers we observed a statistically significant increase in C17:0, C20:4, and C22:6 fatty acids (Fig. 3F). Based on the m/z of the molecular species of LPA and the released fatty acid by PLA2, we deduced the probable PA species (Table 2). Among the presumed PA species, the increase in m/z 690.5 (34:2 = C16:0/18:2), m/z 692.5 (34:1 = C16:0/18:1), m/z 744.5 (38:3 = C18:0/20:3), and m/z 740.5 (38:5 = C18:1/20:4) were statistically significant.
TABLE 2.
The predicted species of LPA and PA in Agpat2−/− male and female livers
The table displays all the LPA and PA molecular species predicted by mass spectrometry. Also listed are the sn-2 fatty acids obtained by cleaving PA with the PLA2 enzyme. Based on the predicted LPA and PA species from mass spectrometry and the fatty acids from PLA2 digestion, the expected PA species have been derived. The PA species that were statistically significant are shown in bold.
Effect of Various PA Species on Gluconeogenesis in Primary Mouse Hepatocytes
To determine whether the changes measured in LPA and PA in Agpat2−/− mice may affect HGP, we first added a mixture of C16:0 and C18:1 LPAs in the ratio of 1:2, as found in the livers of Agpat2−/− mice, to primary hepatocytes from WT mice and found no increase in HGP (Fig. 4B). These LPAs were tested individually and none altered HGP (data not shown), suggesting that LPA may not play any role in gluconeogenesis.
FIGURE 4.

Enhanced gluconeogenesis in primary mouse hepatocytes in the presence of PA. A, schematic representation of the gluconeogenesis pathway. B, glucose output was measured in the culture medium from the WT primary mouse hepatocytes when tested with two LPAs: C16:0-LPA and 18:1-LPA in the ratio of 1:2. C, glucose output was measured in culture medium from the WT primary mouse hepatocytes when tested with two PAs: C16:0/18:1 PA and C18:1/20:4 PA, or three PAs: C16:0/18:1 PA, C18:1/20:4 PA, and C16:0/18:2 PA, in molar ratios of 1:0.5:0.5. D, glucose output was measured in culture medium from the WT primary mouse hepatocytes when transfected with C16:0/18:1 PA, C18:1/20:4 PA, and C16:0/18:2 PA individually and expressed as milligrams/dl/μg of protein. Shown are the mean ± S.E. from six independent experiments performed in duplicate. E and F, expression of mRNA for G6pase and Pepck analyzed by Q-PCR and normalized to cyclophilin. Shown is the fold-change compared with untransfected WT primary mouse hepatocytes (expressed as mean ± S.E., n = 4). The expression of both G6pase and Pepck increased in the presence of C16:0/18:1 PA and C18:1/20:4 PA but this effect was nullified by insulin. G and H, change in the promoter activities of G6pase and Pepck as measured by a dual luciferase assay and expressed as fold-changes compared with pGL3 basic in primary mouse hepatocytes (expressed as mean ± S.E.). Only the PAs that activated mRNA expression of G6pase and Pepck also activated their respective promoters (G6pase; n = 6 and Pepck; n = 5). The p values are shown above the bars: *, <0.001; **, <0.01; †, <0.05.
We next tested a mixture of PAs, which were significantly elevated in the livers of Agpat2−/− mice. C16:0/18:1 PA and C18:1/20:4 PA or C16:0/18:1 PA, C18:1/20:4 PA, and C16:0/18:2 PA in a molar ratio of 1:0.5:0.5 (as found in the livers of Agpat2−/− mice) were incubated with primary hepatocytes from WT mice. These PA mixtures increased HGP ∼1.5-fold, an effect that was suppressed in the presence of insulin (Fig. 4C). A similar response was observed when Agpat2−/− mouse hepatocytes were tested with the same PA mixtures (data not shown). Although C18:0/20:3 PA was also significantly increased we could not test this PA as it is not commercially available and accounted for only ∼1% of the total liver PA extracted from Agpat2−/− mice.
To determine whether the increase in HGP was specific to PA, we tested another phospholipid PC for its effect on HGP. Interestingly, C18:1/18:1 PC significantly decreased (∼25%) HGP in WT primary hepatocytes, suggesting that PC is not the cause for increased HGP by PA (data not shown).
The PA species (C16:0/18:2, C16:0/18:1, and C18:1/20:4), which were significantly increased in the livers of Agpat2−/− mice (Table 2 and Fig. 3, B and D), were supplemented to the hepatocytes. When each individual PA species was incubated with primary hepatocytes, we measured a 2–2.5-fold increase in glucose output in the presence of C16:0/18:1 PA and C18:1/20:4 PA (Fig. 4D). The increase in HGP in the presence of C16:0/18:2 PA was not statistically significant. The increase in glucose production induced by C16:0/18:1 PA and C18:1/20:4 PA was suppressed by insulin.
The increase in glucose production induced by a specific PA species was associated with increased expression of key genes involved in glucose metabolism, G6pase and Pepck (Fig. 4, E and F). The mRNA expression of G6pase was increased ∼2.8- and ∼3.4-fold and Pepck increased ∼2.0- and ∼2.2-fold in the presence of C16:0/18:1 PA and C18:1/20:4 PA, respectively (Fig. 4, E and F).
We next determined if the increase in gene expression was transcriptionally regulated by PA. For these experiments we expressed the proximal promoter regions of G6pase and Pepck fused to a luciferase reporter gene in primary hepatocytes in the presence of PA and insulin. The relative luciferase units for G6pase increased ∼9.5- and ∼10.7-fold and Pepck increased ∼2.3- and ∼2.6-fold in the presence of C16:0/18:1 PA and C18:1/20:4 PA, respectively (Fig. 4, G and H).
Insulin-resistant Agpat2−/− Mouse Livers Show a Decrease in Phosphorylation of Akt at Thr-308
We next sought to determine how insulin signaling is altered in livers of Agpat2−/− mice. Akt, a key component of the insulin signaling cascade, is phosphorylated by at least two kinases, 3-phosphoinositide-dependent protein kinase 1 (PDK1) at amino acid Thr-308 (22) and mTORC2 at amino acid Ser-473 (23). Surprisingly, in the livers of both genders of Agpat2−/− mice, the phosphorylation of Akt at Thr-308 was significantly decreased, whereas total Akt remained unchanged (Fig. 5, A and B). This suggests that PDK1 (most likely) was not recruited by phosphatidylinositol 3,4,5-triphosphate (PIP3) and thus failed to phosphorylate Akt at Thr-308. However, the phosphorylation of Ser-473 by mTORC2, which is not required to be recruited to the plasma membrane, was enhanced in livers from both genders. Despite the fact that Agpat2−/− mice are highly insulin resistant, their livers still have higher PA levels, which may partially explain why the phosphorylation of mTOR and its target proteins show a slight increase in the livers of Agpat2−/− mice (data not shown).
FIGURE 5.

Decreased phosphorylation of Akt at Thr-308 in the livers of Agpat2−/− mice suggests that PA may have a specific effect on the different phosphorylated forms of Akt. A and B, immunoblotting of Akt and its phosphorylated forms, Akt-Thr-308 and Akt-Ser-473, in the livers of male and female WT and Agpat2−/− mice. Shown are representative immunoblots for total Akt, Akt-Thr-308, and Akt-Ser-473. The protein bands were normalized to GAPDH (n = 6). Phosphorylation of Akt at Thr-308 by PDK1 was significantly decreased in Agpat2−/− mice livers compared with those of WT livers. Interestingly, phosphorylation of Akt at Ser-473 by mTORC2 was increased in the livers of Agpat2−/− mice compared with WT mice. C, schematic representation of the PI3K-Akt pathway. PI3K catalyzes the conversion of membrane-bound PIP2 (phosphatidylinositol 4,5-biphosphate) to PIP3 (phosphatidylinositol 3,4,5-triphosphate). PIP3 binds to the pleckstrin homology domain of Akt, which results in activation through dimerization and exposure of its catalytic site. PIP3 also activates PDK1, which in turn phosphorylates Akt at Thr-308. D, immunoblot analysis of total Akt, pAkt-Thr-308, and pAkt-Ser-473, in the WT primary mouse hepatocytes transfected with C16:0/18:2 PA, C16:0/18:1 PA, and C18:1/20:4 PA. Total Akt remained unchanged in the presence of all three PAs. pAKT-Ser-473, a downstream target for mTORC2 remained unchanged in the presence of all three PAs but increased in the presence of insulin. Although pAkt-Thr-308 decreased in the presence of all three PAs, the phosphorylation was increased by insulin. As a loading control GAPDH was determined for each blot. Shown are representative immunoblots for total Akt, Akt-Thr-308, and Akt-Ser-473 from three independent experiments.
Molecular Target(s) of PA in Primary Mouse Hepatocytes That Regulate Insulin Signaling
Because mTOR was unaffected in the livers of Agpat2−/− mice, we next explored the effect of PA on Akt (Fig. 5C). Total Akt levels remained unchanged when WT hepatocytes were incubated with C16:0/18:1, C18:1/20:4, or C16:0/18:2 PA either alone or in the presence of insulin (Fig. 5D). pAkt-Thr-308 levels were decreased in the presence of all three PAs but increased by insulin. The second phosphorylation site of Akt at Ser-473 remained unchanged in the presence of all three PAs and was stimulated in the presence of insulin (Fig. 5D).
Primary Hepatocytes Isolated from Agpat2−/− Mice Remain Insulin Resistant under Culture Conditions
Next, we measured LPA and PA levels in hepatocytes isolated from Agpat2−/− male mice and compared them to WT male mice. Because hepatocytes may behave differently in culture compared with whole animal livers under steady state conditions, it was imperative to determine the LPA and PA levels in the hepatocytes. The LPA levels showed a modest increase in hepatocytes isolated from the livers of Agpat2−/− mice (Fig. 6A), whereas the PA levels were significantly increased (Fig. 6B). Similar to whole livers, the phosphorylation of Akt at Thr-308 in Agpat2−/− hepatocytes was reduced compared with WT hepatocytes (Fig. 6C). PDK1, which seemed to be inhibited in Agpat2−/− livers, was also inactive in primary hepatocytes. The phosphorylation of Akt at Ser-473 in the presence of insulin in Agpat2−/− hepatocytes was markedly reduced when compared with WT hepatocytes. This suggests that the hepatocytes isolated and cultured from the livers of Agpat2−/− mice still remained insulin resistant.
FIGURE 6.

Primary mouse hepatocytes from Agpat2−/− male mice are insulin resistant. A and B, quantification of LPA and PA in primary mouse hepatocytes isolated from WT and Agpat2−/− male mice. The LPA remained unchanged in Agpat2−/− primary mouse hepatocytes when compared with WT hepatocytes. The PA levels showed a significant increase. Shown are means for LPA and PA. p value for PA levels = 0.03, n = 6. C, immunoblotting of Akt and its phosphorylated forms, Akt-Thr-308 and Akt-Ser-473, in primary mouse hepatocytes. Shown are representative immunoblots of total Akt and pAkt-Thr-308 and pAkt-Ser-473 from three independent mice. D, glucose output in primary hepatocytes from Agpat2−/− male mice. Shown are the mean ± S.E. (n = 6) performed in duplicate. C18:1/20:4 PA increased the glucose output in primary hepatocytes from Agpat2−/− male mice, and insulin was unable to suppress gluconeogenesis. E and F, fold-change (expressed as mean ± S.E., n = 4) of G6pase and Pepck normalized to cyclophilin. The expression of both gluconeogenic genes was increased in the presence of C18:1/20:4 PA. Insulin failed to suppress gluconeogenesis. G and H, change in promoter activity of G6pase and Pepck as measured by dual luciferase assay and expressed as fold-change compared with pGL3 basic in primary mouse hepatocytes from Agpat2−/− male mice (expressed as mean ± S.E., n = 4). The p values are shown above the bars (*, <0.001; **, <0.01; †, <0.05).
We next measured glucose output in the presence of C18:1/20:4 PA. The glucose output from Agpat2−/− hepatocytes was higher than WT hepatocytes and C18:1/20:4 PA further increased gluconeogenesis in Agpat2−/− hepatocytes (Fig. 6D). In contrast to WT primary hepatocytes, C18:1/20:4 PA-induced HGP was not suppressed by insulin in hepatocytes from Agpat2−/− mice. The increased HGP was accompanied by increased mRNA expression of G6pase and Pepck (Fig. 6, E and F).
We also determined if the increase in G6pase and Pepck gene expression was transcriptionally regulated by PA. For these experiments, we expressed the proximal promoter regions of G6pase and Pepck fused to a luciferase reporter gene in primary hepatocytes in the presence of PA and insulin. The promoter activity for G6pase and Pepck was increased in the presence of C18:1/20:4 PA in hepatocytes isolated from Agpat2−/− male mice compared with those from WT male (Fig. 6, G and H).
In female mice, the LPA and PA levels in primary hepatocytes were only modestly increased compared with WT mice (Fig. 7, A and B). The phosphorylation of Akt at Thr-308 in the isolated primary hepatocytes was also reduced compared with WT hepatocytes (Fig. 7C) suggesting that these hepatocytes also remained insulin resistant. Gluconeogenesis increased in the presence of C18:1/20:4 PA in Agpat2−/− primary mouse hepatocytes but remained unchanged upon addition of insulin (Fig. 7D). Similar to the hepatocytes isolated from Agpat2−/− male mice, the hepatocytes from Agpat2−/− female mice also showed increased mRNA expression of G6pase and Pepck (Fig. 7, E and F) as well as increased promoter activity (Fig. 7, G and H) in the presence of C18:1/20:4 PA compared with the WT primary hepatocytes.
FIGURE 7.

Primary hepatocytes from Agpat2−/− female mice are insulin resistant. A and B, quantification of LPA and PA in primary hepatocytes isolated from WT and Agpat2−/− female mice. The LPA and PA levels remained unchanged in Agpat2−/− hepatocytes when compared with WT hepatocytes, n = 4. C, immunoblot analysis of total Akt and its phosphorylated forms, pAkt-Thr-308 and pAkt-Ser-473. D, glucose output in primary hepatocytes isolated from Agpat2−/− female mice. C18:1/20:4 PA increased glucose output in primary hepatocytes and insulin was unable to suppress the gluconeogenesis, n = 4. E and F, expression of G6pase and Pepck was analyzed by Q-PCR and normalized to cyclophilin. The expression of both gluconeogenic genes was increased in the presence of PA. Insulin failed to suppress gluconeogenesis (n = 4). G and H, change in promoter activity of G6pase and Pepck as measured by the dual luciferase assay and expressed as fold-change compared with pGL3 basic in primary hepatocytes from Agpat2−/− female mice (expressed as mean ± S.E., n = 4). The p values are shown above the bars (*, <0.001; **, <0.01; †, <0.05).
Hepatic Lipogenesis Is Independent of PA Induction
Previously, we have shown that hepatic mRNA levels of lipogenic genes acetyl-CoA carboxylase (Acc1) and fatty acid synthase (Fas) were increased in the livers of Agpat2−/− mice (7). To test whether lipogenesis is also induced by PA, hepatocytes isolated from the livers of both genders of WT and Agpat2−/− mice were incubated with C18:1/20:4 PA and the mRNA expression for key lipogenesis enzymes Acc1 and Fas were measured (Fig. 8). We observed that in the presence of C18:1/20:4 PA, the mRNA levels of Acc1 and Fas remained unchanged in the hepatocytes from male (Fig. 8, A and C) and female (Fig. 8, B and D) WT and Agpat2−/− mice.
FIGURE 8.

Hepatic lipogenesis is independent of PA induction. A and B, expression of mRNA for Acc1 and Fas in primary hepatocytes from wild type (WT) and Agpat2−/− male mice. Acc1 and Fas were analyzed by Q-PCR and normalized to cyclophilin. Shown are the fold-changes compared with untransfected WT primary mouse hepatocytes (expressed as mean ± S.E., n = 4). The expression of both Acc1 and Fas remained unchanged in the presence of C18:1/20:4 PA. C and D, expression of mRNA for Acc1 and Fas in hepatocytes isolated from WT and Agpat2−/− female mice. Acc1 and Fas were analyzed similar to the male mice. The expression of both Acc1 and Fas remained unchanged in the presence of C18:1/20:4 PA. The p values are shown above the bars (*, <0.05).
DISCUSSION
In this study we find that four PAs, C16:0/18:2, C16:0/18:1, C18:0/20:3, and C18:1/20:4, were significantly increased in the livers of Agpat2−/− mice. Among these only two PAs: C16:0/18:1 and C18:1/20:4 increased HGP in the mouse primary hepatocytes. The increase in HGP was accompanied by increased mRNA levels of the key gluconeogenic enzymes G6pase and Pepck. Luciferase reporter assays confirmed these PAs induced the transcription of the G6pase and Pepck genes. In Agpat2−/− hepatocytes, glucose production was also increased by PA, which was accompanied by increased mRNA expression of G6pase and Pepck and their respective luciferase reporter constructs. HGP was suppressed by insulin in WT but not Agpat2−/− hepatocytes.
Despite the near negligible AGPAT activity in the livers of Agpat2−/− mice, the levels of both the substrate (LPA) and the product (PA) remained elevated in mice of both genders. The high levels of PA may be due to additional source(s) like Pld and Dagk. It is unclear which pathway is important for the generation of PA in Agpat2−/− mice livers. Although the Pld expression was increased in these livers (Pld3 was increased ∼2.2-fold in male livers and Pld4 was increased ∼4-fold in female livers), we believe that the increased PA is most likely due to increased expression of Dagk3 (increased ∼4- to ∼9-fold) in livers of both genders of Agpat2−/− mice. Furthermore, when AGPAT2 was overexpressed in livers of Agpat2−/− mice, it did not result in any improvement in hepatic steatosis or IR (12) suggesting that the elevated PAs are not products of the AGPAT2 enzyme. Further studies are required to determine which of these pathways is employed for the generation of PA.
How does PA affect IR in the livers of Agpat2−/− mice? In this study, we did not observe any novel PA species in the livers of Agpat2−/− mice. However, the levels of several PA species were increased. Based on the m/z ratio for LPA and PA and specific determination of the sn-2 fatty acid released using PLA2, we could determine the most probable PA species: C16:0/18:2, C16:0/18:1, and C18:1/20:4 PA. The most interesting observation of this study was that the addition of certain molecular species of PA increased gluconeogenesis in primary mouse hepatocytes and this increase was suppressed by insulin. We found that PA containing unsaturated fatty acids at both sn-1 and sn-2 positions (C18:1/20:4 PA) was very effective in increasing gluconeogenesis, whereas C16:0/18:2 PA was ineffective. Furthermore, C16:0/18:1 PA was as efficient as C18:1/20:4 PA in increasing gluconeogenesis. Previous studies have shown the preferred acyl-CoA for AGPAT2 in decreasing order as follows: C18:2 > C18:1 > C16:0 > C14:0 > C20:4-CoAs (12, 24). Thus C18:1/20:4 PA is less likely to be produced by AGPAT2 and more likely by the alternative pathways mentioned above.
The PA-induced glucose production appears to be due to the induction of key gluconeogenic genes G6pase and Pepck. Although a few proteins such as mTOR, phosphatidylinositol 4-phosphate 5-kinase (PI4P5K), protein phosphatase (PP1Cγ), and protein kinase (PKCϵ) have been shown to interact with PA (25–27); the molecular and cellular mechanisms by which PA exerts its effects are still unknown. Recent experiments show that PA could also bind to the FK506-binding protein (FKBP12)-rapamycin-binding domain (11) and, in fact, some studies show that PA enhances mTOR activity (10). However, when primary mouse hepatocytes were incubated with specific PA species (C16:0/18:2, C16:0/18:1 and C18:1/20:4 PA), mTOR and its molecular targets remained unchanged. Identifying proteins that interact with PA could provide clues to the activation of G6pase and Pepck.
To examine the defective insulin signaling, we explored the PI3K-Akt pathway in whole livers of Agpat2−/− mice. Full activation of Akt requires phosphorylation at Thr-308 (28) by PDK1 and at Ser-473 in the C-terminal hydrophobic motif by mTORC2 (23). A recent study in obese type 2 diabetic db/db mice showed that knockdown of NADPH oxidase 4 resulted in sustained phosphorylation at Thr-308 but not at Ser-473, suggesting that the Thr-308 phosphorylation site is more insulin sensitive (29). We found that C16:0/18:1 PA and C18:1/20:4 PA decreased the phosphorylation of Akt at Thr-308, but not at Ser-473, which we interpret as inhibition of mTOR activity. Thus, this observation suggests that phosphorylation of Akt (pAkt-Thr-308) is PA specific. Overall, these in vitro studies in primary mouse hepatocytes revealed that specific PA species could inhibit Akt phosphorylation at Thr-308 but failed to affect the phosphorylation at Ser-473.
The phosphorylation of Akt at Thr-308 by PDK1 was also significantly decreased in livers of Agpat2−/− mice. Normally PIP3, the second messenger of PI3K, recruits Akt and PDK1 to the plasma membrane via their PH domains. The current study suggests that Akt or PDK1 or both fail to be recruited onto the plasma membrane and thus Akt is inefficiently phosphorylated (30). Prior studies have shown that when a mutation was created in the PH domain of PDK1 at serine 241 to alanine, it resulted in a 50-fold decrease in the phosphorylation and activation of Akt (31). It is also possible that PDK1 exists in its inactive state in livers of Agpat2−/− mice. The study reported by Seong et al. (32) showed that the apoptosis signal-regulating kinase 1 inhibits PDK1 function by phosphorylating PDK1 at Ser-394 and Ser-398. Furthermore, the same group reported that murine protein serine/threonine kinase 38 (MPK38) also interacts with PDK1 both in vitro and in vivo and inactivates it by phosphorylating at Thr-354 (33). This suggests that PDK1 activity may be inhibited by apoptosis signal-regulating kinase 1 or MPK38 resulting in decreased phosphorylation of Akt at Thr-308 in Agpat2−/− mice livers. Whether this pathway is altered by PA in AGPAT2 knock-out livers will require further studies.
Two previous reports have attempted to demonstrate a role of PA in insulin signaling (34, 35). Zhang et al. (35) observed an increase in total LPA, PA, and DAG levels and also a modest increase in glucose output in primary mouse hepatocytes from WT mice overexpressing GPAT1. However, it is unclear if this is specifically due to PA, LPA, or DAG or a combination of these lipids (Fig. 1E in Ref. 35). These authors do show that only C16:0/16:0 PA was biologically active in inhibiting mTORC2 (Fig. 6B in Ref. 35). However, evidence supporting the role of C16:0/16:0 PA in glucose output was not provided. Of note, we did not detect the C16:0/16:0 PA species in our Agpat2−/− mouse model and although Gpat1−/− hepatocytes are protected from IR our Agpat2−/− hepatocytes are insulin resistant. A second important enzyme critical in PA metabolism is lipin, which dephosphorylates PA to DAG. All three lipin isoforms, lipin 1, lipin 2, and lipin 3, are known to be expressed in the liver (36). Ryu et al. (34) showed that overexpression of lipin 1 in WT hepatocytes leads to an increase in DAG levels (34). This did not regulate the phosphorylation of Akt, a key molecule for insulin signaling. However, the decrease in phosphorylation of Akt was only noted when the hepatocytes were incubated with PA, resulting in increased mRNA levels for Pepck, suggesting that PA could increase gluconeogenesis (Fig. 3D in Ref. 34). These two studies focused on the role of PA and its effect on Akt and mTOR pathways and insulin resistance. Our study now directly demonstrates the role of specific molecular species of PA in gluconeogenesis. However, the detailed molecular mechanism involved in PA-induced gluconeogenesis remains to be studied.
The current study provides an explanation for increased hepatic gluconeogenesis and IR present in livers of Agpat2−/− mice. As shown in insulin-sensitive WT hepatocytes, insulin suppresses gluconeogenesis despite the provision of exogenous PA to the hepatocytes. In contrast, in insulin-resistant Agpat2−/− hepatocytes where Akt could not be phosphorylated by PDK1, PA continues to stimulate glucose production. Further studies are required to determine how and why PDK1 fails to activate Akt in these mice. Because PA is the substrate for the biosynthesis of phosphatidylinositol it could possibly generate a different molecular species of phosphatidylinositol whose configuration is such that it fails to recruit Akt and PDK1 to the plasma membrane. PA is also a signaling molecule and as shown in Fig. 9 is involved in several signaling pathways at all subcellular levels. This study now provides another layer of specificity for PA transduction as these pathway(s) might require specific molecular species of PAs.
FIGURE 9.

Schematic of the various pathways, both known and speculative, leading to synthesis of PA and its function in liver. PA can be formed in four different ways: 1) glycerol-3-phosphate (G3P) is acylated by glycerol-3-phosphate acyltransferase (Gpat) to form LPA with further acylation of LPA to PA by 1-acylglycerol-3-phosphate-O-acyltransferase (Agpats); 2) hydrolysis of phosphatidylcholine (PC) to PA by phospholipase D (PLD); 3) phosphorylation of DAG to PA by diacylglycerol kinase (Dagk); and 4) by the PI cycle. In PI cycle, PA is converted to cytidine diphosphate-diacylglycerol (CDP-DAG) an intermediate for the synthesis of PI in the presence of cytidine diphosphate-diacylglycerol synthase (CDS). CDP-DAG is converted to PI by PI synthase (PIS). The conversion of PI to PI-4,5-bisphosphate (PIP2) is carried out by PI 4-phosphate 5-kinase (PIP5K). DAG can be formed by hydrolysis of PIP2 by phospholipase C (Plc). This is a speculative PA synthesis cycle that awaits experimental confirmation. In certain pathological conditions as in the Agpat2−/− lipodystrophic mouse, DAG can be synthesized by acylation of monacylglycerol (MAG) by monoacylglycerol acyltransferase (MGAT1) (7) or by de-phosphorylation of PA by lipin. Mgat1 is not expressed in the livers of adult wild type mouse. PA is a lipid signaling molecule and modulates multiple pathways occurring at various subcellular sites in the cell. The role of PA at the membrane level is shown in red arrows, in the cytoplasm in blue arrows, and at the lysosomal level in green arrows. The most important and novel finding of our study is regulation of gluconeogenesis by PA, which is shown in black arrows. The role of PAs as a cellular pH sensor is shown in pink. These various pathways shown are compiled from the published literature. Raf-1, rapidly accelerated fibrosarcoma proto-oncogene serine/threonine-protein kinase (39); ERK, extracellular signal-regulated kinase; PKC, protein kinase C (40); mTORC1, mammalian target of rapamycin complex 1 (9); S6K, ribosomal protein S6 kinase; mTORC2, mammalian target of rapamycin complex 2 (35); Akt, protein kinase B; G6pase, glucose-6-phosphatase; Pepck, phosphoenolpyruvate carboxykinase (this study); TRIAP1, tumor protein p53 regulated inhibitor of apoptosis 1 (41); pH biosensor (42); sphingosine kinase (43); PIP5K, phosphatidylinositol 4-phosphate 5-kinase (44); Plc, phospholipase C (45); and Pp1, protein phosphatase 1 (26).
This study might also have implications in understanding gluconeogenesis in cancer cells. Studies have implicated increased expression of AGPAT2 in the development of ovarian cancer (37), which should increase cellular PA levels. These observations would indicate that increased PA levels might increase gluconeogenesis more so in the insulin resistant state found in obesity and provide a role for PA as part of a pathway to supply energy to cancer cells (38).
Acknowledgments
We thank Katie Tunison M.S. from the University of Texas Southwestern Medical Center for technical assistance and copyediting, Anh Nguyen for assistance with gas chromatography, and Baris Akinci for help with immunoblotting. The mass spectrometry analysis described in this work was performed at the Kansas Lipidomics Research Center Analytical Laboratory. The method of development and instrument acquisition at the Kansas Lipidomics Research Center were supported by National Science Foundation Grants EPS 0236913, MCB 0455318, 0920663 and DBI 0521587, Kansas Technology Enterprise Corporation, K-IDeA Networks of Biomedical Research Excellence (INBRE) by National Institute of Health Grant P20RR16475, and the Kansas State University.
This work was supported, in whole or in part, by National Institutes of Health Grant R01-DK54387, HL020948, and the Southwestern Medical Foundation and Center for Human Nutrition at the University of Texas Southwestern Medical Center.
- AGPAT
- 1-acylglycerol-3-phosphate O-acyltransferase
- LPA
- lysophosphatidic acid
- PA
- phosphatidic acid
- PLA2
- phospholipase A2
- mTOR
- mammalian target of rapamycin
- PLD
- phospholipase D
- DAG
- 1,2-dioleoyl-sn-glycerol
- Q-PCR
- quantitative PCR
- PIP3
- phosphatidylinositol 3,4,5-triphosphate
- Acc1
- acetyl-CoA carboxylase
- Fas
- fatty acid synthase
- PDK1
- phospholipid-dependent kinase-1
- DAGK
- diacylglycerol kinase
- HGP
- hepatic glucose production
- PEPCK
- phosphoenolpyruvate carboxykinase
- CGL1
- congenital generalized lipodystrophy type 1
- PI
- phosphatidylinositol
- IR
- insulin resistance.
REFERENCES
- 1. Agarwal A. K., Garg A. (2003) Congenital generalized lipodystrophy. Significance of triglyceride biosynthetic pathways. Trends Endocrinol. Metab. 14, 214–221 [DOI] [PubMed] [Google Scholar]
- 2. Coleman R. A., Lee D. P. (2004) Enzymes of triacylglycerol synthesis and their regulation. Prog Lipid Res. 43, 134–176 [DOI] [PubMed] [Google Scholar]
- 3. Agarwal A. K. (2012) Lysophospholipid acyltransferases. 1-Acylglycerol-3-phosphate O-acyltransferases. From discovery to disease. Curr. Opin Lipidol. 23, 290–302 [DOI] [PubMed] [Google Scholar]
- 4. Agarwal A. K., Arioglu E., De Almeida S., Akkoc N., Taylor S. I., Bowcock A. M., Barnes R. I., Garg A. (2002) AGPAT2 is mutated in congenital generalized lipodystrophy linked to chromosome 9q34. Nat. Genet. 31, 21–23 [DOI] [PubMed] [Google Scholar]
- 5. Vantyghem M. C., Balavoine A. S., Douillard C., Defrance F., Dieudonne L., Mouton F., Lemaire C., Bertrand-Escouflaire N., Bourdelle-Hego M. F., Devemy F., Evrard A., Gheerbrand D., Girardot C., Gumuche S., Hober C., Topolinski H., Lamblin B., Mycinski B., Ryndak A., Karrouz W., Duvivier E., Merlen E., Cortet C., Weill J., Lacroix D., Wemeau J. L. (2012) How to diagnose a lipodystrophy syndrome. Ann. Endocrinol. 73, 170–189 [DOI] [PubMed] [Google Scholar]
- 6. Garg A. (2011) Clinical review. Lipodystrophies. Genetic and acquired body fat disorders. J. Clin. Endocrinol. Metab. 96, 3313–3325 [DOI] [PMC free article] [PubMed] [Google Scholar]
- 7. Cortés V. A., Curtis D. E., Sukumaran S., Shao X., Parameswara V., Rashid S., Smith A. R., Ren J., Esser V., Hammer R. E., Agarwal A. K., Horton J. D., Garg A. (2009) Molecular mechanisms of hepatic steatosis and insulin resistance in the AGPAT2-deficient mouse model of congenital generalized lipodystrophy. Cell Metab. 9, 165–176 [DOI] [PMC free article] [PubMed] [Google Scholar]
- 8. Gale S. E., Frolov A., Han X., Bickel P. E., Cao L., Bowcock A., Schaffer J. E., Ory D. S. (2006) A regulatory role for 1-acylglycerol-3-phosphate-O-acyltransferase 2 in adipocyte differentiation. J. Biol. Chem. 281, 11082–11089 [DOI] [PubMed] [Google Scholar]
- 9. Toschi A., Lee E., Xu L., Garcia A., Gadir N., Foster D. A. (2009) Regulation of mTORC1 and mTORC2 complex assembly by phosphatidic acid. Competition with rapamycin. Mol. Cell. Biol. 29, 1411–1420 [DOI] [PMC free article] [PubMed] [Google Scholar]
- 10. Yoon M. S., Sun Y., Arauz E., Jiang Y., Chen J. (2011) Phosphatidic acid activates mammalian target of rapamycin complex 1 (mTORC1) kinase by displacing FK506-binding protein 38 (FKBP38) and exerting an allosteric effect. J. Biol. Chem. 286, 29568–29574 [DOI] [PMC free article] [PubMed] [Google Scholar]
- 11. Rodriguez Camargo D. C., Link N. M., Dames S. A. (2012) The FKBP-rapamycin binding domain of human TOR undergoes strong conformational changes in the presence of membrane mimetics with and without the regulator phosphatidic acid. Biochemistry 51, 4909–4921 [DOI] [PubMed] [Google Scholar]
- 12. Agarwal A. K., Sukumaran S., Cortés V. A., Tunison K., Mizrachi D., Sankella S., Gerard R. D., Horton J. D., Garg A. (2011) Human 1-acylglycerol-3-phosphate O-acyltransferase isoforms 1 and 2. Biochemical characterization and inability to rescue hepatic steatosis in Agpat2−/− gene lipodystrophic mice. J. Biol. Chem. 286, 37676–37691 [DOI] [PMC free article] [PubMed] [Google Scholar]
- 13. Baker D. L., Desiderio D. M., Miller D. D., Tolley B., Tigyi G. J. (2001) Direct quantitative analysis of lysophosphatidic acid molecular species by stable isotope dilution electrospray ionization liquid chromatography-mass spectrometry. Anal. Biochem. 292, 287–295 [DOI] [PubMed] [Google Scholar]
- 14. Becart J. C., Biesse J.P. (1990) Quantitative analysis of phospholipids by HPLC with a light scattering evaporating detector. Application to raw materials for cosmetic use. J. High Resolution Chromatogr. 13, 126–129 [Google Scholar]
- 15. Lepage G., Roy C. C. (1986) Direct transesterification of all classes of lipids in a one-step reaction. J. Lipid Res. 27, 114–120 [PubMed] [Google Scholar]
- 16. Devaiah S. P., Roth M. R., Baughman E., Li M., Tamura P., Jeannotte R., Welti R., Wang X. (2006) Quantitative profiling of polar glycerolipid species from organs of wild-type Arabidopsis and a phospholipase Dα1 knockout mutant. Phytochemistry 67, 1907–1924 [DOI] [PubMed] [Google Scholar]
- 17. Welti R., Li W., Li M., Sang Y., Biesiada H., Zhou H. E., Rajashekar C. B., Williams T. D., Wang X. (2002) Profiling membrane lipids in plant stress responses. Role of phospholipase Dα in freezing-induced lipid changes in Arabidopsis. J. Biol. Chem. 277, 31994–32002 [DOI] [PubMed] [Google Scholar]
- 18. Arneson L. S., Kunz J., Anderson R. A., Traub L. M. (1999) Coupled inositide phosphorylation and phospholipase D activation initiates clathrin-coat assembly on lysosomes. J. Biol. Chem. 274, 17794–17805 [DOI] [PubMed] [Google Scholar]
- 19. Martelli A. M., Tabellini G., Bortul R., Manzoli L., Bareggi R., Baldini G., Grill V., Zweyer M., Narducci P., Cocco L. (2000) Enhanced nuclear diacylglycerol kinase activity in response to a mitogenic stimulation of quiescent Swiss 3T3 cells with insulin-like growth factor I. Cancer Res. 60, 815–821 [PubMed] [Google Scholar]
- 20. Shimomura I., Bashmakov Y., Ikemoto S., Horton J. D., Brown M. S., Goldstein J. L. (1999) Insulin selectively increases SREBP-1c mRNA in the livers of rats with streptozotocin-induced diabetes. Proc. Natl. Acad. Sci. U.S.A. 96, 13656–13661 [DOI] [PMC free article] [PubMed] [Google Scholar]
- 21. Matsuda M., Korn B. S., Hammer R. E., Moon Y. A., Komuro R., Horton J. D., Goldstein J. L., Brown M. S., Shimomura I. (2001) SREBP cleavage-activating protein (SCAP) is required for increased lipid synthesis in liver induced by cholesterol deprivation and insulin elevation. Genes Dev. 15, 1206–1216 [DOI] [PMC free article] [PubMed] [Google Scholar]
- 22. Alessi D. R., Deak M., Casamayor A., Caudwell F. B., Morrice N., Norman D. G., Gaffney P., Reese C. B., MacDougall C. N., Harbison D., Ashworth A., Bownes M. (1997) 3-Phosphoinositide-dependent protein kinase-1 (PDK1). Structural and functional homology with the Drosophila DSTPK61 kinase. Curr. Biol. 7, 776–789 [DOI] [PubMed] [Google Scholar]
- 23. Sarbassov D. D., Guertin D. A., Ali S. M., Sabatini D. M. (2005) Phosphorylation and regulation of Akt/PKB by the rictor-mTOR complex. Science 307, 1098–1101 [DOI] [PubMed] [Google Scholar]
- 24. Hollenback D., Bonham L., Law L., Rossnagle E., Romero L., Carew H., Tompkins C. K., Leung D. W., Singer J. W., White T. (2006) Substrate specificity of lysophosphatidic acid acyltransferase β. Evidence from membrane and whole cell assays. J. Lipid Res. 47, 593–604 [DOI] [PubMed] [Google Scholar]
- 25. Fang Y., Vilella-Bach M., Bachmann R., Flanigan A., Chen J. (2001) Phosphatidic acid-mediated mitogenic activation of mTOR signaling. Science 294, 1942–1945 [DOI] [PubMed] [Google Scholar]
- 26. Jones J. A., Rawles R., Hannun Y. A. (2005) Identification of a novel phosphatidic acid binding domain in protein phosphatase-1. Biochemistry 44, 13235–13245 [DOI] [PubMed] [Google Scholar]
- 27. Stace C. L., Ktistakis N. T. (2006) Phosphatidic acid- and phosphatidylserine-binding proteins. Biochim. Biophys. Acta 1761, 913–926 [DOI] [PubMed] [Google Scholar]
- 28. Alessi D. R. (2001) Discovery of PDK1, one of the missing links in insulin signal transduction. Colworth Medal Lecture. Biochem. Soc. Trans. 29, 1–14 [DOI] [PubMed] [Google Scholar]
- 29. Wu X., Williams K. J. (2012) NOX4 pathway as a source of selective insulin resistance and responsiveness. Arterioscler. Thromb. Vasc. Biol. 32, 1236–1245 [DOI] [PMC free article] [PubMed] [Google Scholar]
- 30. Bayascas J. R., Wullschleger S., Sakamoto K., García-Martínez J. M., Clacher C., Komander D., van Aalten D. M., Boini K. M., Lang F., Lipina C., Logie L., Sutherland C., Chudek J. A., van Diepen J. A., Voshol P. J., Lucocq J. M., Alessi D. R. (2008) Mutation of the PDK1 PH domain inhibits protein kinase B/Akt, leading to small size and insulin resistance. Mol. Cell. Biol. 28, 3258–3272 [DOI] [PMC free article] [PubMed] [Google Scholar]
- 31. Casamayor A., Morrice N. A., Alessi D. R. (1999) Phosphorylation of Ser-241 is essential for the activity of 3-phosphoinositide-dependent protein kinase-1. Identification of five sites of phosphorylation in vivo. Biochem. J. 342, 287–292 [PMC free article] [PubMed] [Google Scholar]
- 32. Seong H. A., Jung H., Ichijo H., Ha H. (2010) Reciprocal negative regulation of PDK1 and ASK1 signaling by direct interaction and phosphorylation. J. Biol. Chem. 285, 2397–2414 [DOI] [PMC free article] [PubMed] [Google Scholar]
- 33. Seong H. A., Jung H., Manoharan R., Ha H. (2012) PDK1 protein phosphorylation at Thr-354 by murine protein serine-threonine kinase 38 contributes to negative regulation of PDK1 protein activity. J. Biol. Chem. 287, 20811–20822 [DOI] [PMC free article] [PubMed] [Google Scholar]
- 34. Ryu D., Oh K. J., Jo H. Y., Hedrick S., Kim Y. N., Hwang Y. J., Park T. S., Han J. S., Choi C. S., Montminy M., Koo S. H. (2009) TORC2 regulates hepatic insulin signaling via a mammalian phosphatidic acid phosphatase, LIPIN1. Cell Metab. 9, 240–251 [DOI] [PubMed] [Google Scholar]
- 35. Zhang C., Wendel A. A., Keogh M. R., Harris T. E., Chen J., Coleman R. A. (2012) Glycerolipid signals alter mTOR complex 2 (mTORC2) to diminish insulin signaling. Proc. Natl. Acad. Sci. U.S.A. 109, 1667–1672 [DOI] [PMC free article] [PubMed] [Google Scholar]
- 36. Donkor J., Sariahmetoglu M., Dewald J., Brindley D. N., Reue K. (2007) Three mammalian lipins act as phosphatidate phosphatases with distinct tissue expression patterns. J. Biol. Chem. 282, 3450–3457 [DOI] [PubMed] [Google Scholar]
- 37. Springett G. M., Bonham L., Hummer A., Linkov I., Misra D., Ma C., Pezzoni G., Di Giovine S., Singer J., Kawasaki H., Spriggs D., Soslow R., Dupont J. (2005) Lysophosphatidic acid acyltransferase-β is a prognostic marker and therapeutic target in gynecologic malignancies. Cancer Res. 65, 9415–9425 [DOI] [PubMed] [Google Scholar]
- 38. Finley L. W., Zhang J., Ye J., Ward P. S., Thompson C. B. (2013) SnapShot. Cancer metabolism pathways. Cell Metab. 17, 466–466.e2 [DOI] [PubMed] [Google Scholar]
- 39. Rizzo M. A., Shome K., Watkins S. C., Romero G. (2000) The recruitment of Raf-1 to membranes is mediated by direct interaction with phosphatidic acid and is independent of association with Ras. J. Biol. Chem. 275, 23911–23918 [DOI] [PubMed] [Google Scholar]
- 40. Limatola C., Schaap D., Moolenaar W. H., van Blitterswijk W. J. (1994) Phosphatidic acid activation of protein kinase C-ζ overexpressed in COS cells. Comparison with other protein kinase C isotypes and other acidic lipids. Biochem. J. 304, 1001–1008 [DOI] [PMC free article] [PubMed] [Google Scholar]
- 41. Potting C., Tatsuta T., König T., Haag M., Wai T., Aaltonen M. J., Langer T. (2013) TRIAP1/PRELI complexes prevent apoptosis by mediating intramitochondrial transport of phosphatidic acid. Cell Metab. 18, 287–295 [DOI] [PubMed] [Google Scholar]
- 42. Shin J. J., Loewen C. J. (2011) Putting the pH into phosphatidic acid signaling. BMC Biol. 9, 85. [DOI] [PMC free article] [PubMed] [Google Scholar]
- 43. Delon C., Manifava M., Wood E., Thompson D., Krugmann S., Pyne S., Ktistakis N. T. (2004) Sphingosine kinase 1 is an intracellular effector of phosphatidic acid. J. Biol. Chem. 279, 44763–44774 [DOI] [PubMed] [Google Scholar]
- 44. Moritz A., De Graan P. N., Gispen W. H., Wirtz K. W. (1992) Phosphatidic acid is a specific activator of phosphatidylinositol-4-phosphate kinase. J. Biol. Chem. 267, 7207–7210 [PubMed] [Google Scholar]
- 45. Henry R. A., Boyce S. Y., Kurz T., Wolf R. A. (1995) Stimulation and binding of myocardial phospholipase C by phosphatidic acid. Am. J. Physiol. 269, C349–358 [DOI] [PubMed] [Google Scholar]