Background: Similar to its role in other organs, calcineurin is involved in kidney hypertrophy. However, downstream targets are not known.
Results: The β isoform of calcineurin (CnAβ) is required for hypertrophy and regulates Nox2 and Nox4 expression and function through NFAT.
Conclusion: CnAβ and not CnAα mediates hypertrophy in renal cells and is required for chronic ROS generation.
Significance: Interaction of calcineurin and Nox signaling is essential for renal hypertrophy.
Keywords: Calcineurin, Kidney, NADPH Oxidase, NFAT Transcription Factor, Oxidative Stress, Reactive Oxygen Species (ROS), High Glucose, Renal Hypertrophy
Abstract
Hypertrophy is an adaptive response that enables organs to appropriately meet increased functional demands. Previously, we reported that calcineurin (Cn) is required for glomerular and whole kidney hypertrophy in diabetic rodents (Gooch, J. L., Barnes, J. L., Garcia, S., and Abboud, H. E. (2003). Calcineurin is activated in diabetes and is required for glomerular hypertrophy and ECM accumulation. Am. J. Physiol. Renal Physiol. 284, F144–F154; Reddy, R. N., Knotts, T. L., Roberts, B. R., Molkentin, J. D., Price, S. R., and Gooch, J. L. (2011). Calcineurin Aβ is required for hypertrophy but not matrix expansion in the diabetic kidney. J. Cell Mol. Med. 15, 414–422). Because studies have also implicated the reactive oxygen species-generating enzymes NADPH oxidases (Nox) in diabetic kidney responses, we tested the hypothesis that Nox and Cn cooperate in a common signaling pathway. First, we examined the role of the two main isoforms of Cn in hypertrophic signaling. Using primary kidney cells lacking a catalytic subunit of Cn (CnAα−/− or CnAβ−/−), we found that high glucose selectively activates CnAβ, whereas CnAα is constitutively active. Furthermore, CnAβ but not CnAα mediates hypertrophy. Next, we found that chronic reactive oxygen species generation in response to high glucose is attenuated in CnAβ−/− cells, suggesting that Cn is upstream of Nox. Consistent with this, loss of CnAβ reduces basal expression and blocks high glucose induction of Nox2 and Nox4. Inhibition of nuclear factor of activated T cells (NFAT), a CnAβ-regulated transcription factor, decreases Nox2 and Nox4 expression, whereas NFAT overexpression increases Nox2 and Nox4, indicating that the CnAβ/NFAT pathway modulates Nox. These data reveal that the CnAβ/NFAT pathway regulates Nox and plays an important role in high glucose-mediated hypertrophic responses in the kidney.
Introduction
In the diabetic kidney, one of the earliest responses to hyperglycemia is hypertrophy. Although initially adaptive, prolonged hypertrophy has been shown to predict proteinuria and later loss of kidney function in humans and animal models of diabetes (3). Signaling pathways that regulate renal hypertrophy are complex and not fully understood. Calcineurin (Cn)2 is a calcium- and calmodulin-dependent phosphatase that functions downstream of growth factors and peptides that induce hypertrophy in the diabetic kidney (1, 2, 4–7). In vitro, Cn is activated by insulin-like growth factor-I and transforming growth factor (TGF)-β and contributes to hypertrophy and matrix regulation in renal mesangial cells. In vivo, inhibition of Cn with cyclosporin or tacrolimus blocks both glomerular and whole kidney hypertrophy in diabetic rats (1, 8). Recently, we found that diabetic whole kidney and glomerular hypertrophy are mediated by CnAβ (2). We have demonstrated that CnAβ regulates the nuclear factor of activated T cells (NFAT) (9), a member of the Rel family of nuclear transcription factors (10). However, downstream targets of CnAβ/NFAT that regulate hypertrophy in the kidney are unknown.
In the diabetic kidney, up-regulation of NADPH oxidase (Nox) leads to elevated generation of reactive oxygen species (ROS) and subsequent kidney damage (11, 12). Nox1, Nox2, and Nox4 are expressed in the kidney (13), but Nox4 plays a key role in the renal response to hyperglycemia (14–17). In this study, we tested the hypothesis that CnAβ and Nox function in a common signaling pathway to regulate hypertrophy in response to high glucose.
EXPERIMENTAL PROCEDURES
Cell Culture
Fibroblast cell lines were generated from the renal cortices of WT, CnAα−/−, and CnAβ−/− mice as described previously (9) and have been maintained in the Gooch laboratory. Cultured cells were grown at 37 °C in 5% CO2 in DMEM and F10 Hams growth medium supplemented with 10% fetal bovine serum and penicillin/streptomycin. At 85% confluence, the culture medium was changed to serum-free medium. Cells were then exposed to medium containing normal glucose concentration (5.5 mmol/liter), high glucose concentration (12.5–25 mmol/liter), TGF-β, or angiotensin II for 10 min to 48 h. Experimental groups received fresh medium every 24 h. Select monolayers were treated with 1 μmol/liter diphenyleneiodonium (DPI), 1 μmol/liter fulvene-5 (kind gift of Jack Arbiser, Emory University), 60 nmol/liter tacrolimus, 1–100 nm VIVIT peptide, or 0.01% vehicle (DMSO). In separate experiments, select monolayers were transfected overnight using Lipofectamine 2000 (Invitrogen) with small interfering RNA (siRNA) oligonucleotides against CnAβ (100 nmol/liter) or scrambled oligonucleotides (Ambion, Austin, TX), Nox2 or Nox4 cDNA (kind gifts of K. Griendling, Emory University), dominant negative NFAT, NFAT cDNA, or vector before 48 h of glucose exposure. Alternatively, cells were transfected overnight with an NFAT-luciferase reporter construct and then treated with serum-free or standard medium for 24 h.
Measurement of Calcineurin Activity
Calcineurin phosphatase activity was determined as described (18). Briefly, the calcineurin substrate peptide RII was synthesized with a phosphoserine at residue 15 and an amino terminus TAMRA fluorescent tag. In a 96-well plate, the labeled substrate was mixed in equal parts with reaction buffer and sample and allowed to incubate at 30 °C for 10 min. Supernatant from each well was then transferred to a 96-well plate coated with titanium oxide (TiO2) (Glygen, Baltimore, MD) followed by gentle shaking to allow binding of phosphorylated substrate. Finally, supernatants containing unbound peptide were then moved transferred to a new 96-well plate, and the amount of dephosphorylated peptide was determined by fluorimetry at 540-nm excitation and 575-nm emission. Calcineurin activity was then determined by extrapolating the fluorescence of experimental samples from a standard curve of purified calcineurin (Sigma-Aldrich).
Calmodulin Pull-down Assay
Cells were lysed with TNESV lysis buffer (50 mm Tris-HCl, pH 7.4, 2 mm EDTA, 1% Nonidet P-40, 100 mm NaCl, 100 mm sodium orthovanadate, 100 μg/ml leupeptin, 20 μg/ml aprotonin, and 10−7 m phenylmethylsulfonyl (PMSF)), and 50 μg of protein was incubated overnight at 4 °C with calmodulin-conjugated agarose beads (Sigma-Aldrich). Beads were pelleted by centrifugation and resuspended in SDS-polyacrylamide gel loading buffer, and proteins were resolved by electrophoresis. Calcineurin isoforms were detected by Western blotting using antibodies that recognize the CnAα and CnAβ isoforms (Millipore, Billerica, MA).
Determination of Cellular Hypertrophy
After a 48-h treatment, cells were incubated with 1 μm Hoechst in Krebs-Ringer phosphate buffer (KRPG; 145 mm NaCl, 5.7 mm KH2PO4, 4.86 mm KCl, 0.54 mm CaCl2, 1.22 mm MgSO4, and 5.5 mm glucose, pH 7.35) for 30 min at 37 °C to detect DNA content. Cells were washed with 1× phosphate-buffered saline (PBS), and fluorescence was measured at 350-nm excitation/460-nm emission. Finally, cells were lysed with TNESV buffer and the protein content was quantified using a bicinchoninic acid (BCA) assay (Pierce). Protein concentrations for each sample were normalized by respective Hoechst fluorescence intensity.
Analysis of CnAα, CnAβ, and Nox Expression
Quantitative RT-PCR (qRT-PCR)
Total RNA was isolated from cells with TRIzol according to the manufacturer's protocol (Invitrogen). cDNA was generated and amplified using One-Step SYBR Green (Bio-Rad). All data were normalized to the GAPDH content of the same sample, and mRNA expression was calculated using the ΔΔCt method (19).
Western Blot
Cells were harvested with trypsin-EDTA, pelleted, washed with 1× PBS, and lysed using TNESV buffer. In addition, snap-frozen whole kidney sections were homogenized with a Dounce Homogenizer in ice-cold TNESV buffer. 25 μg of protein was separated by 10% SDS-PAGE, and proteins were transferred to a PVDF membrane. The membrane was incubated in 1% bovine serum albumin-TBS (20 mm Tris-HCl, pH 7.6, 137 mm NaCl) and then immunoblotted with appropriate dilutions of primary antibodies specific for Nox1 (Santa Cruz Biotechnology, Inc.), Nox2, Nox4 (Abcam, Cambridge, MA), or actin (Santa Cruz Biotechnology, Inc.). After washing, membranes were incubated with fluorescence-conjugated secondary antibody (LI-COR Biosciences, Lincoln, NE). Fluorescence detection was performed using an Odyssey imager (LI-COR Biosciences). Densitometry analyses were performed on 3–4 independent experiments using LI-COR Biosciences software.
Measurement of Reactive Oxygen Species
H2O2 was measured by horseradish peroxidase-catalyzed oxidation of the nonfluorescent molecule N-acetyl-3,7-dihydroxyphenoxazine into the highly fluorescent molecule resorufin (Amplex Red Assay, Invitrogen). Fibroblasts or snap-frozen whole kidney sections were incubated in KRPG buffer containing 100 μl/ml Amplex Red and 0.2 units/ml horseradish peroxidase for 1 h at 37 °C. Resorufin fluorescence was measured at excitation and emission wavelengths of 540 and 590 nm, respectively. Sample fluorescence was compared with that generated by a H2O2 standard curve to calculate the concentrations of H2O2 released. H2O2 concentrations were normalized to cell number determined by measuring Hoechst fluorescence or tissue weight.
Measurement of NFAT Activity
Cells were transfected with 1 μg of NFAT-luciferase promoter construct described previously (20) as well as 100 ng of a Renilla promoter control plasmid. After treatment, cells were lysed using passive lysis buffer and centrifuged to pellet the debris, and then luciferase assay reagent (100 μl) was added to 20 μl of supernatant, and luminescence was measured for 10 s using an OptoComp Luminometer (MGM Instruments, Hamden, CT).
Statistical Analysis
For all experiments, graphing and statistical analyses were performed using GraphPad software (Prism, San Diego, CA). Unless otherwise noted, statistical tests were two-way analysis of variance with Bonferroni's post-test to detect differences between experimental groups. A value of p < 0.05 was considered statistically significant.
RESULTS
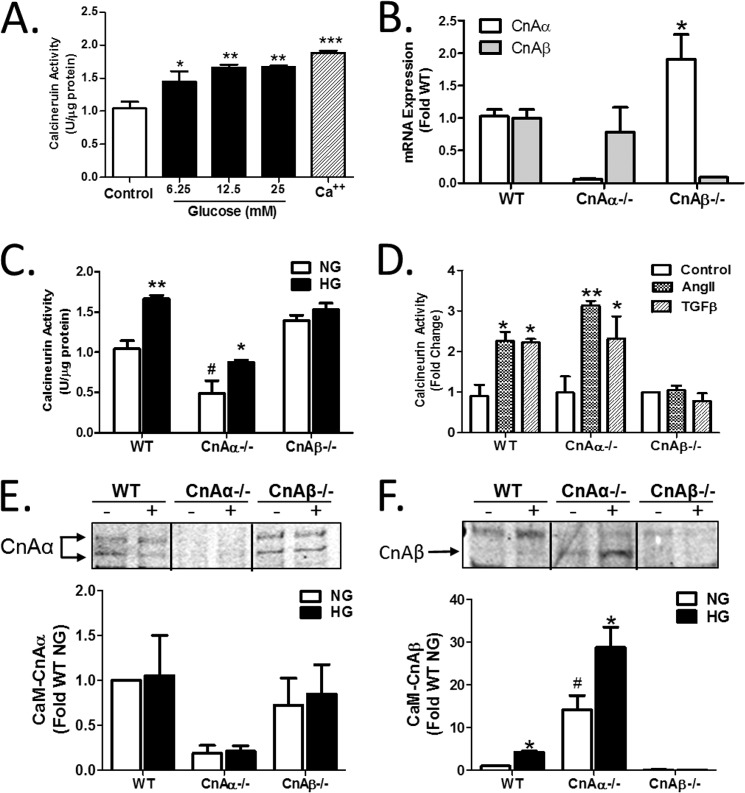
High glucose (HG) is an effective mechanism to induce hypertrophy in cultured renal cells. However, a direct effect of HG on Cn has not previously been examined. Renal fibroblasts were treated with increasing concentrations of HG for 10 min, and then Cn activity was examined using an in vitro enzyme assay. Fig. 1A shows that Cn was activated by HG in a dose-responsive fashion. 12.5 mm glucose was chosen for all subsequent experiments. Next, the effect of HG was examined on the two main isoforms of the catalytic subunit of Cn, CnAα and CnAβ, using renal fibroblast cell lines generated from WT, CnAα−/−, or CnAβ−/− kidney cortices (described previously (9)). Loss of each isoform was verified by qRT-PCR (Fig. 1B). Next, each cell line was treated with 12.5 mm glucose, and Cn enzyme activity was examined. Fig. 1C shows that, although basal activity was lower compared with WT cells, HG increased activity in CnAα−/− cells. In contrast, basal activity was not different from WT in CnAβ−/− cells, and there was no change with HG. Similarly, induction was observed when WT or CnAα−/− cells were treated with angiotensin II or TGF-β, but no response was observed in CnAβ−/− cells (Fig. 1D). These data demonstrate that CnAβ and not CnAα was induced by hypertrophic signaling mechanisms. Activation of Cn requires that the catalytic subunit binds a regulatory, calcium-binding subunit (B) and calmodulin. To confirm a selective role for CnAβ in hypertrophic signaling, relative amounts of active CnAα or CnAβ were determined by pulling down calmodulin from control or HG-treated cells and then immunoblotting for each isoform. In WT fibroblasts, CnAα was the predominant isoform associated with calmodulin under basal conditions and did not change with HG treatment (Fig. 1E). CnAα association with calmodulin in CnAβ−/− cells was comparable with WT but was absent in CnAα−/− cells, as expected. In contrast, although there were very low levels of CnAβ bound to calmodulin under basal conditions, HG increased CnAβ binding (Fig. 1F). CnAβ binding to calmodulin was enhanced in CnAα−/− cells and absent in CnAβ−/−, as expected. Taken together, these data indicate that CnAβ is selectively induced by HG, whereas CnAα is constitutively active.
FIGURE 1.
The β isoform of calcineurin (CnAβ) is selectively activated by high glucose. A, Cn enzyme activity in WT kidney fibroblasts exposed to increasing amounts of glucose or calcium (Ca2+) for 10 min was determined by an in vitro Cn assay. Data shown are the mean ± S.E. (error bars) of triplicate reactions. *, p < 0.05; **, p < 0.01; **, p < 0.001 compared with control. B, CnAα and CnAβ mRNA expression in WT, CnAα−/−, and CnAβ−/− kidney fibroblasts was examined by qRT-PCR. Data shown are the mean ± S.E. of 4–9 replicates/group. *, p < 0.05 compared with WT. C, Cn enzyme activity in WT, CnAα−/−, and CnAβ−/− kidney fibroblasts exposed to normal glucose (NG) or HG for 48 h was determined by an in vitro Cn assay. Data shown are the mean ± S.E. of 8 replicates/group. *, p < 0.05; **, p < 0.01 compared with NG; #, p < 0.05 compared with WT NG. D, Cn enzyme activity in WT, CnAα−/−, and CnAβ−/− kidney fibroblasts exposed to angiotensin II or TGF-β for 10 min was determined by in vitro Cn assay. Data shown are the mean ± S.E. of triplicate reactions. *, p < 0.05; **, p < 0.01 compared with control. E and F, association of catalytic isoforms of Cn with calmodulin (CaM) was determined in WT, CnAα−/−, and CnAβ−/− kidney fibroblasts after 48 h of NG or HG exposure by a CaM pull-down assay. Relative amounts of CnAα and CnAβ bound to CaM were semiquantitated by densitometry. Data were normalized relative to WT NG and graphed. Data shown are the mean ± S.E. of four independent experiments. *, p < 0.05 compared with NG. #, p < 0.05 compared with WT NG.
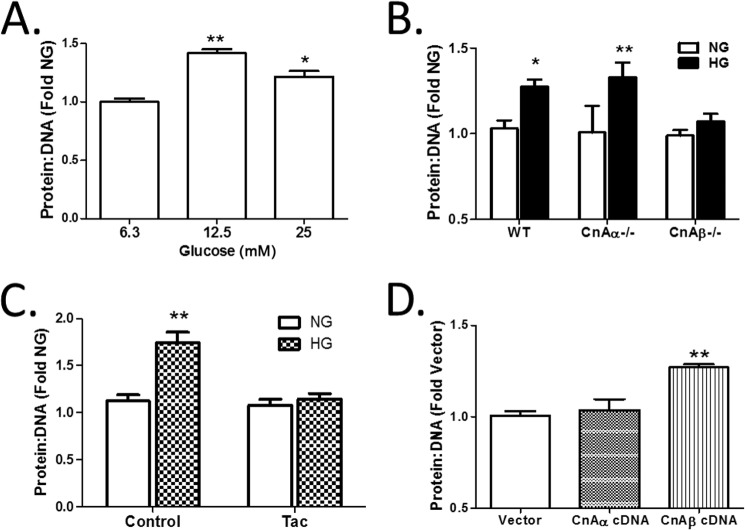
Next, the role of each Cn isoform in the induction of hypertrophy was examined. First, WT cells were treated with increasing concentrations of HG for 48 h, and the protein/DNA ratio was determined as a measure of hypertrophy. Fig. 2A shows that 12.5 mm HG was sufficient to induce hypertrophy, an amount comparable with maximal Cn activity induced by HG in Fig. 1A. Next, WT, CnAα−/−, and CnAβ−/− cells were treated with HG, and the effect on the protein/DNA ratio was determined. Fig. 2B shows that HG induced hypertrophy in WT and CnAα−/− fibroblasts, whereas CnAβ−/− cells failed to respond. Interestingly, when CnAα−/− cells were pretreated with the calcineurin inhibitor tacrolimus (Tac), HG-stimulated hypertrophy was abolished (Fig. 2C). These data demonstrate that CnAβ mediates HG-mediated hypertrophy. To confirm a specific role for CnAβ in hypertrophy, WT cells were transfected with empty vector, CnAα, or CnAβ cDNA under normal culture conditions, and then protein/DNA ratios were assessed after 72 h. Overexpression of CnAβ but not CnAα was sufficient to increase protein/DNA ratios (Fig. 2D).
FIGURE 2.
CnAβ mediates cellular hypertrophy. A, hypertrophy was examined in WT kidney fibroblasts exposed to increasing amounts of glucose for 48 h by assessing the protein/DNA ratio. Data shown are the mean ± S.E. (error bars) of three independent experiments. *, p < 0.05; **, p < 0.01 compared with low glucose. B, hypertrophy was examined in WT, CnAα−/−, or CnAβ−/− kidney fibroblasts treated with NG or HG for 48 h by assessing the protein/DNA ratio. Data shown are the mean ± S.E. of three independent experiments relative to WT NG. *, p < 0.05; **, p < 0.01. C, hypertrophy was assessed in tacrolimus-treated (Tac) CnAα−/− kidney fibroblasts exposed to NG or HG for 48 h. Data shown are the mean ± S.E. of 8 replicates/group relative to control NG. **, p < 0.01. D, hypertrophy was assessed in vector, CnAα, or CnAβ cDNA-transfected WT kidney fibroblasts after 72 h of expression. Data shown are the mean ± S.E. of three independent experiments relative to vector. **, p < 0.01.
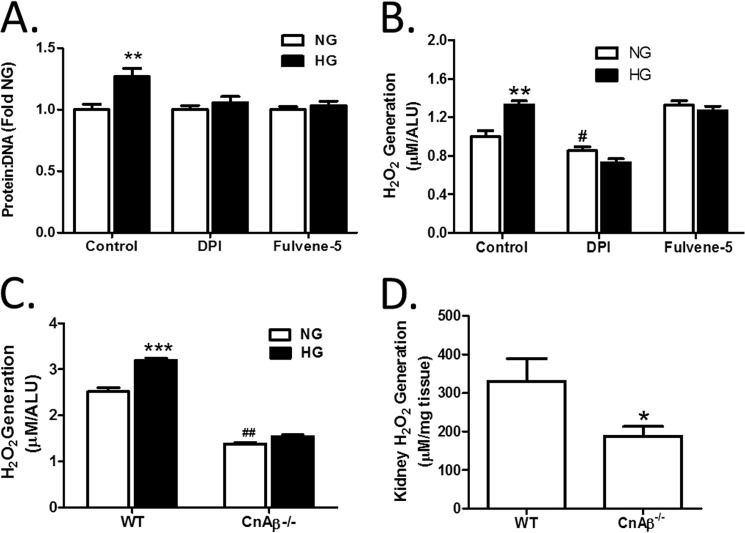
Pharmacological inhibition of Cn has been shown to block hypertrophy in vitro (4, 6) and in vivo (1, 8). Similarly, blockade of chronic oxidative stress attributable to Nox inhibited hypertrophy in vitro (4, 17) and in vivo (14, 17). In particular, the Nox4 isoform has been implicated in diabetic kidney changes (12, 15, 21, 22). In Fig. 3A, the role of NADPH oxidases in the response to HG in renal fibroblasts was confirmed using a general inhibitor of NADPH oxidase activity, DPI, and a specific inhibitor of Nox2 and Nox4, Fulvene-5 (23). The data show that pretreatment with DPI or Fulvene-5 blocked HG-mediated hypertrophy in WT renal fibroblasts, confirming a central role for NADPH oxidase in the HG response. Next, generation of ROS was evaluated after 48 h of HG treatment. Fig. 3B shows that HG induced a significant increase in cellular ROS that is inhibited by DPI. Moreover, targeting of Nox2 and Nox4 with Fulvene-5 also attenuated ROS generation, indicating that Nox2/Nox4 induction is sufficient for HG-mediated oxidative stress. Therefore, we examined if CnAβ and Nox cooperate in a common signaling pathway. First, ROS generation in response to 48 h of HG treatment was compared in WT and CnAβ−/− cells. Fig. 3C shows that loss of CnAβ reduced basal cellular ROS and blocked HG-mediated ROS generation. Consistent with these in vitro findings, basal ROS was reduced in mouse kidneys (Fig. 3D). These results suggest that CnAβ is also upstream of Nox in vivo.
FIGURE 3.
Cn and NADPH oxidases are involved in cellular hypertrophy and ROS generation. A, hypertrophy was measured in WT kidney fibroblasts pretreated with DMSO (control), DPI, or fulvene-5 for 30 min prior to the addition of NG or HG for 48 h by assessing the protein/DNA ratio. Data shown are the mean ± S.E. (error bars) of 8 replicates/group relative to control NG. **, p < 0.01. B, ROS generation in WT kidney fibroblasts pretreated with DMSO (control), DPI, and fulvene-5 for 30 min prior to the addition of NG or HG for 48 h was examined by an Amplex Red assay. Data shown are the mean ± S.E. of 8 replicates/group relative to control NG. **, p < 0.01; #, p < 0.05 compared with control NG. C, ROS generation in WT and CnAβ−/− kidney fibroblasts exposed to NG or HG for 48 h was examined by Amplex Red. Data shown are the mean ± S.E. of 12 replicates/group. ***, p < 0.001 compared with NG. ##, p < 0.01 compared with NG WT. D, ROS generation was detected in WT (n = 4) and CnAβ−/− (n = 8) kidney tissue by an Amplex Red assay. Data shown are the mean ± S.E. normalized to mg of tissue. *, p < 0.05 compared with WT. ALU, arbitrary light units.
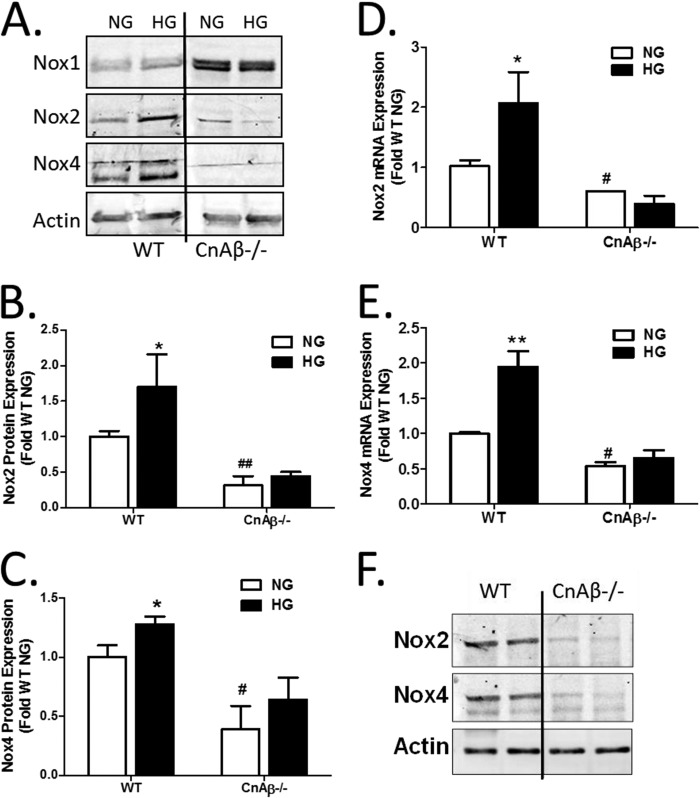
Expression of Nox isoforms was thus investigated in WT and CnAβ−/− cells. In WT cells, HG increased Nox2 and Nox4 but not Nox1 expression (Fig. 4A), consistent with previous publications (12, 24). Interestingly, basal Nox1 was up-regulated in CnAβ−/− cells, whereas Nox2 and Nox4 were significantly reduced. Moreover, there was no increase in Nox2 or Nox4 in response to HG (Fig. 4, B and C). A similar change was observed in Nox2 and Nox4 mRNA; HG stimulated Nox2 and Nox4 mRNA in WT fibroblasts, but basal and HG-stimulated Nox2 and Nox4 expression were reduced in CnAβ−/− (Fig. 4, D and E). Consistently, Nox2 and Nox4 protein expression were reduced in kidneys of CnAβ−/− mice (Fig. 4F). These data indicate that CnAβ regulates Nox2 and Nox4 expression and activity in vitro and in vivo.
FIGURE 4.
CnAβ regulates expression of Nox isoforms. A, Nox1, Nox2, and Nox4 protein expression was examined in WT and CnAβ−/− kidney fibroblasts by Western blot following 48 h of NG or HG treatment. Data shown are representative of four independent experiments. Nox2 (B) and Nox4 (C) protein expression was quantitated by densitometry, normalized to WT NG, and graphed. Data are ± S.E. (error bars) normalized to WT NG. *, p < 0.05; #, p < 0.05; ##, p < 0.01 compared with WT NG. Nox2 (D) and Nox4 (E) mRNA expression was examined in WT and CnAβ−/− fibroblasts exposed to NG or HG for 48 h by qRT-PCR. Data shown are the mean ± S.E. of 3–6 replicates/group normalized to WT NG. *, p < 0.05; **, p < 0.01 compared with NG; #, p < 0.05 compared with NG WT. F, Nox2 and Nox4 protein expression was examined in whole kidney lysates from WT and CnAβ−/− mice by Western blot analysis. Data shown are representative of four independent experiments.
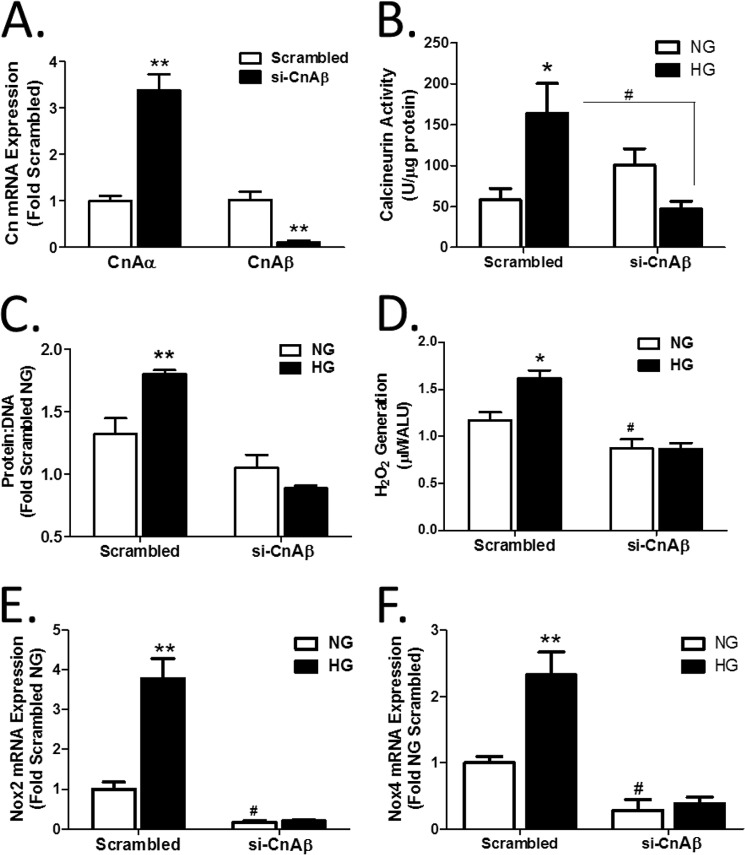
To confirm a role for CnAβ upstream of Nox2 and Nox4, CnAβ was selectively knocked down in WT cells with siRNA. Fig. 5A shows that si-CnAβ effectively reduced CnAβ mRNA and, interestingly, also elevated CnAα, similar to the data in Fig. 1 with knock-out cell lines. Likewise, si-CnAβ blocked HG-mediated activation of Cn activity in WT cells (Fig. 5B). WT cells treated with scrambled si-RNA or si-CnAβ were exposed to HG for 48 h, and then the protein/DNA ratio was determined. Fig. 5, C and D, shows that knockdown of CnAβ attenuated HG-mediated cell hypertrophy and ROS generation. Finally, si-CnAβ significantly reduced Nox2 and Nox4 mRNA in WT fibroblasts (Fig. 5, E and F). These data confirm that CnAβ regulates Nox2 and Nox4 expression in renal fibroblasts.
FIGURE 5.
CnAβ regulates ROS generation. A, relative expression of CnAα and CnAβ mRNA was determined in WT kidney fibroblasts transfected with scrambled or CnAβ-targeting (si-CnAβ) oligonucleotides by qRT-PCR. Data shown are the mean ± S.E. (error bars) of triplicate samples. **, p < 0.01 compared with scrambled. B, Cn enzyme activity in si-CnAβ- or scrambled-transfected WT kidney fibroblasts exposed to NG or HG for 48 h was determined by an in vitro Cn assay. Data shown are the mean ± S.E. of 8 replicates/group. *, p < 0.05 compared with scrambled NG; #, p < 0.05 compared with scrambled HG. C, hypertrophy was measured in scrambled and si-CnAβ-transfected WT kidney fibroblasts by assessing the protein/DNA ratio. Data shown are the mean ± S.E. of 8 replicates/group normalized to scrambled NG. **, p < 0.01 compared with NG. D, ROS generation in scrambled or si-CnAβ-transfected WT kidney fibroblasts exposed to NG or HG for 48 h was examined by Amplex Red. Data shown are the mean ± S.E. of 8 replicates/group normalized to scrambled NG. *, p < 0.05 compared with NG. #, p < 0.05 compared with NG WT. Nox2 (E) and Nox4 (F) mRNA expression in scrambled or si-CnAβ-transfected WT fibroblasts were examined by qRT-PCR. Data shown are the mean ± S.E. of triplicate samples/group normalized to scrambled NG. **, p < 0.01; #, p < 0.05 compared with scrambled NG. ALU, arbitrary light units.
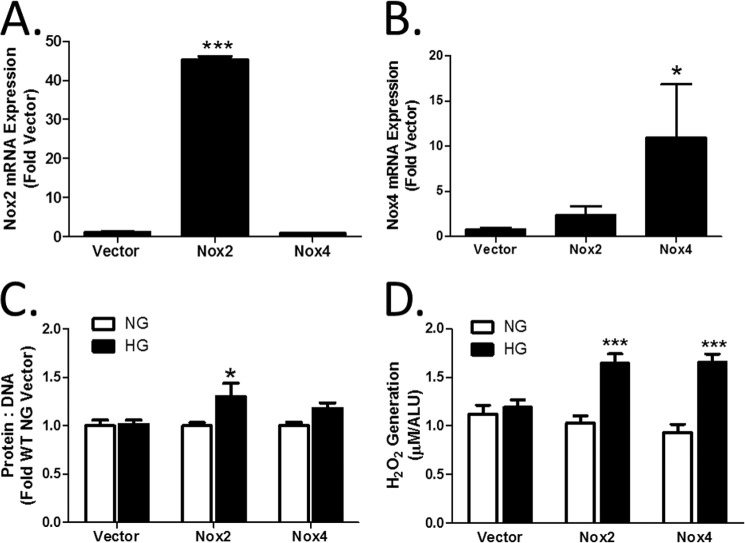
CnAβ−/− cells demonstrated an impaired response to HG and attenuated expression of Nox2 and Nox4. To determine if Nox2/Nox4 are required for CnAβ-mediated actions downstream of HG, both proteins were re-expressed in CnAβ−/− cells. Fig. 6, A and B, shows that Lipofectamine-mediated transfection of Nox2 or Nox4 cDNA increased basal mRNA expression in CnAβ−/− cells. Next, HG-mediated hypertrophy and ROS generation were examined. Fig. 6, C and D, shows that re-expression of Nox2 or Nox4 restored HG-mediated hypertrophy and ROS generation.
FIGURE 6.
Nox2 and Nox4 mediate cellular hypertrophy. Relative expression of Nox2 (A) and Nox4 mRNA (B) was determined in CnAα−/− kidney fibroblasts transfected with Nox2 or Nox4 cDNA. Data shown are the mean ± S.E. (error bars) of three independent experiments. *, p < 0.05; ***, p < 0.001 compared with vector. C, hypertrophy was measured in Nox2- or Nox4-transfected CnAβ−/− kidney fibroblasts by assessing the protein/DNA ratio. Data shown are the mean ± S.E. of three independent experiments normalized to WT NG vector. *, p < 0.05; ***, p < 0.001. D, ROS generation in Nox2- or Nox4-transfected WT kidney fibroblasts exposed to NG or HG for 48 h was examined by Amplex Red. Data shown are the mean ± S.E. of 8 replicates/group. ***, p < 0.001 compared with NG. ALU, arbitrary light units.
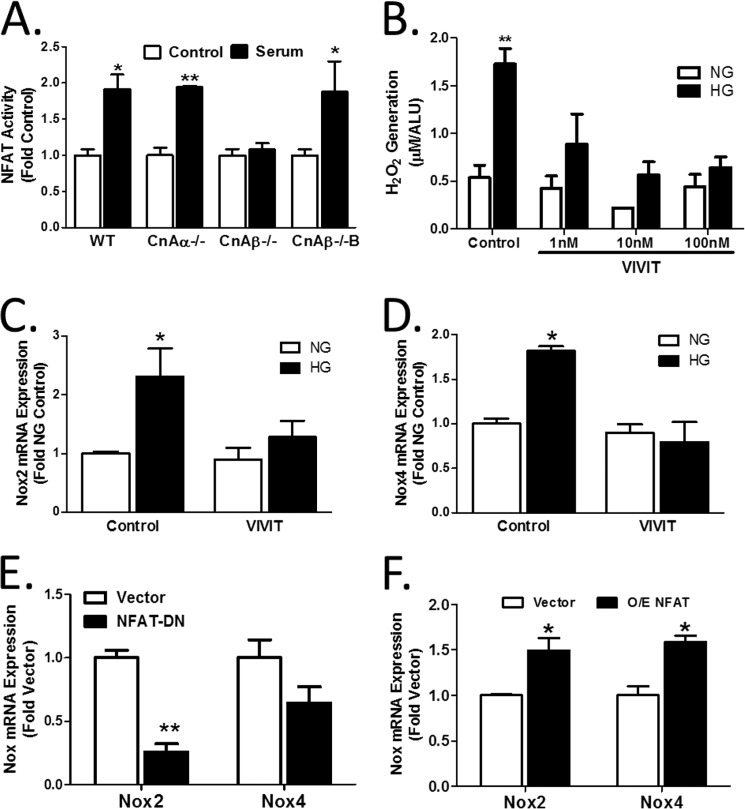
Cn activation by calcium results in dephosphorylation of substrates, including the NFAT family of transcription factors. Previously, NFAT has been shown to be activated in response to hypertrophic signaling in vitro (4, 6) and in vivo (1). Therefore, the role of NFAT in CnAβ-mediated regulation of Nox2 and Nox4 was examined. First, activation of an NFAT-responsive luciferase reporter construct was examined in WT, CnAα−/−, and CnAβ−/− cells. Fig. 7A shows that NFAT transcriptional activity can be stimulated in WT and CnAα−/− fibroblasts but failed to respond in CnAβ−/− cells. Re-expression of CnAβ in CnAβ−/− fibroblasts (CnAβ−/−B) restored NFAT regulation. Next, the affect of a peptide inhibitor of NFAT, VIVIT, on hypertrophy and ROS generation was examined. Fig. 7B shows that VIVIT was sufficient to block HG-mediated ROS generation in a dose-responsive manner. Consistent with this, induction of Nox2 and Nox4 mRNA by HG was attenuated by VIVIT (Fig. 7, C and D). Last, NFAT dominant negative overexpression in WT cells decreased Nox2 and Nox4 expression (Fig. 7E), whereas overexpression of NFAT increased expression (Fig. 7F). These findings demonstrate that CnAβ regulates Nox expression through NFAT.
FIGURE 7.
CnAβ regulates NFAT transcriptional activity. A, NFAT activity in WT, CnAα−/−, CnAβ−/−, and CnAβ−/−B kidney fibroblasts exposed to low or high serum was examined using an NFAT-responsive luciferase promoter construct. Data shown are the mean ± S.E. (error bars) of 5 replicates/group. *, p < 0.05; **, p < 0.01 compared with WT control. B, ROS generation was examined by an Amplex Red assay in WT kidney fibroblasts treated with an increasing concentration of VIVIT peptide and then exposed to NG or HG for 48 h. Data shown are the mean ± S.E. of 8 replicates/group. **, p < 0.01 compared with NG. Nox2 (C) and Nox4 (D) mRNA expression in WT kidney fibroblasts treated with 10 nm VIVIT were examined by qRT-PCR. Data shown are the mean ± S.E. of triplicate samples per group. *, p < 0.05 compared with control. E, basal Nox2 and Nox4 mRNA expression in vector- or NFAT-DN-transfected WT kidney fibroblasts were examined by qRT-PCR. Data shown are the mean ± S.E. of triplicate samples per group. **, p < 0.01 compared with vector. F, basal Nox2 and Nox4 mRNA expression in vector- or NFAT-transfected WT kidney fibroblasts were examined by qRT-PCR. Data shown are the mean ± S.E. of triplicate samples per group. *, p < 0.05 compared with vector. ALU, arbitrary light units.
The results of these experiments indicated that CnAβ is selectively activated by HG and dephosphorylates the transcription factor NFAT. Furthermore, CnAβ/NFAT were required for HG-mediated expression of Nox2 and Nox4 and increased ROS generation (Fig. 8). Taken together, these data demonstrate a novel role of CnAβ and NFAT in the regulation of Nox-mediated ROS generation. Because oxidative stress negatively alters the milieu of the intracellular environment of the kidney and adds to hyperglycemia-induced kidney damage, it is paramount that more studies investigate the mechanisms of this pathway.
FIGURE 8.
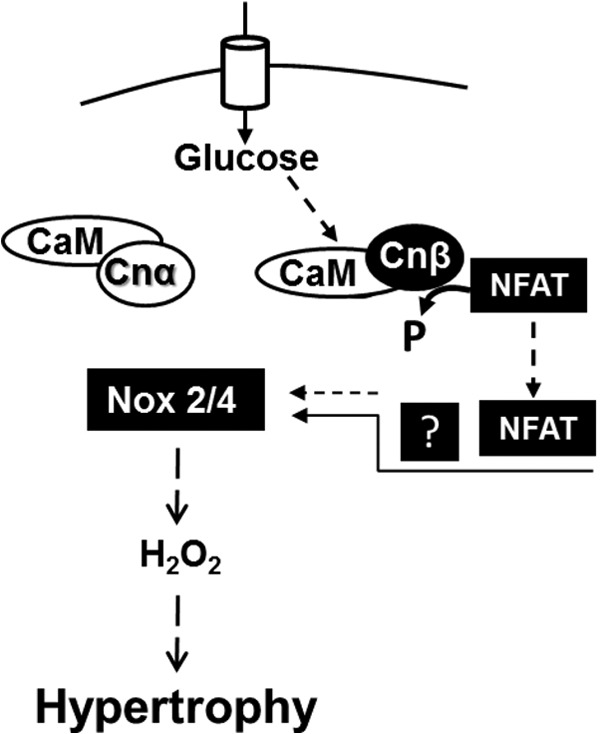
NFAT mediates CnAβ-induced Nox2 and Nox4 up-regulation in kidney hypertrophy. In renal fibroblast cells, CnAα is constitutively active, whereas CnAβ is an inducible enzyme that is selectively activated by HG and other hypertrophic factors. CnAβ dephosphorylates NFAT, which translocates to the nucleus and (either directly or indirectly) induces the transcription of Nox2 and Nox4. Increased expression of Nox proteins leads to enhanced ROS generation and hypertrophy.
DISCUSSION
This study builds on our previous work investigating isoform-specific functions of CnAα and CnAβ. Our findings indicate a primary role for CnAα in the development and function of the kidney (25, 26). This is consistent with data in this study showing that CnAα is probably the predominant isoform under basal conditions. In fact, the strong baseline association of CnAα with calmodulin and the lack of change in CnAα binding with stimuli suggest that CnAα is constitutively active. In contrast, although our previous data showed an absence of a significant defect in CnAβ−/− kidneys (25), diabetic hypertrophy is attenuated (2), suggesting that CnAβ plays a role in renal responses to stimuli. Enhanced CnAβ binding to calmodulin in response to HG and increased enzyme activity in cells expressing only CnAβ (Fig. 1) are consistent with CnAβ being an inducible enzyme.
Adding to the complexity of CnAα/CnAβ signaling, the data indicate that there may be cross-talk between the two isoforms. For example, Figs. 1B and 5A show that CnAα mRNA increases when CnAβ is absent or reduced. One possible mechanism is via altered expression of the endogenous calcineurin inhibitor CBP1/DSCR1, which is a transcriptional target of NFAT. Our data could support a model whereby loss of NFAT relieves repression of CnAα by CBP1/DSCR1. Isoform specificity of CBP1/DSCR1 has yet to be explored and is an important area for future study. Although these data suggest an intriguing mechanism of interaction between the two isoforms, we do not find evidence that elevated CnAα mRNA leads to increased basal activity. Fig. 1, C and E, does not show an increase in enzyme activity or calmodulin binding in the absence of CnAβ. Fig. 5B shows a slight increase in basal activity, but the change is not significant. This suggests that factors other than expression of the catalytic subunit may drive basal calcineurin activity. Because activation of the calcineurin holoenzyme requires interaction of the catalytic subunit with a regulatory subunit as well as calmodulin, it is possible that availability of the B regulatory subunit and/or calmodulin also influences basal activity.
In addition to further defining complementary roles of CnAα and CnAβ in the kidney, these data reveal that CnAβ plays a previously unknown role in regulation of Nox expression and function. Our data confirm the central role of Nox-mediated ROS generation in cellular changes with HG (Fig. 3). This increase in HG-mediated ROS is attenuated in CnAβ−/− cells, and ROS generation is reduced in CnAβ−/− kidneys, indicating that CnAβ is upstream of Nox function in vitro and in vivo. This hypothesis was confirmed by the data in Fig. 4 showing that loss of CnAβ is associated with decreased basal Nox2 and Nox4 and attenuation of HG induction of both enzymes. mRNA changes parallel expression of both proteins, supporting a transcriptional mechanism. Finally, selective knockdown of CnAβ in WT cells recapitulated the changes on Nox expression and HG response.
The data show that CnAβ is required for induction of Nox2 and Nox4 expression in response to HG in vitro. Although a number of signaling pathways downstream of CnAβ have been investigated in the setting of hypertrophy, this is, to our knowledge, the first time Nox has been linked to Cn action. Given the consistent finding that CnAβ is an integral player in hypertrophic signals in multiple tissues, it is possible that CnAβ regulates Nox expression and chronic oxidative stress in other organs as well. It is also intriguing to speculate that a lack of Nox2/Nox4 up-regulation is responsible for the blunted cardiac hypertrophy reported in 2002 (27) and whole kidney and glomerular hypertrophy reported more recently by our group in CnAβ−/− mice (2).
In addition to establishing CnAβ as a novel upstream regulator of Nox2 and Nox4, this study also places the Cn substrate NFAT in the pathway. Overexpression and inhibition of NFAT modulates Nox2 and, to a lesser degree, Nox4 expression. Additional experiments are required to determine if NFAT acts directly on the Nox2 and/or Nox4 promoters or if NFAT acts indirectly either as a transcriptional co-factor or via regulation of another pathway. For example, NFAT is a member of the Rel transcription factor family along with NFκB. NFκB has been shown to regulate Nox4 (28). Moreover, Cn can dephosphorylate IκB (29), providing an additional avenue for cross-talk between the pathways. These data do not allow us to conclude if Nox4 and Nox2 are each regulated in parallel or if Nox2 is the target of CnAβ/NFAT regulation and that Nox2, in turn, regulates Nox4.
There are several interesting aspects of this pathway that warrant additional discussion and investigation. First, it is interesting that constitutive loss of CnAβ reduces basal Nox2 and Nox4 expression. Because Fig. 1 shows that CnAβ is not active in the absence of stimuli, it is possible that CnAα plays a role as an endogenous inhibitor of Nox2/4 expression. Supporting this model, siRNA to CnAβ attenuated HG-mediated up-regulation of Nox2/4 activity but had minimal effect on basal ROS. This model would also provide an explanation for the observation that calcineurin inhibitors increase Nox2 expression in vivo (30). If CnAα is constitutively active, the majority of effects from calcineurin inhibitor treatment will be due to down-regulation of CnAα. We have also found that CnAα−/− cells have increased basal levels of Nox2 and Nox4.3 Taken together, these data confirm that CnAα and CnAβ may both be involved in aspects of regulation of Nox expression and ROS generation. Finally, the data show that constitutive loss of CnAβ also results in an increase in Nox1. This may represent a compensatory response to maintain cellular ROS. Additional experiments are necessary to identify the mechanism and significance of Nox1 up-regulation.
Finally, the current study was performed with spontaneously immortalized renal fibroblasts which is a potential limitation of the data. In vivo, proximal tubule epithelial cells are the site of greatest up-regulation of Nox4 in the diabetic kidney (17). In a limited set of experiments, we confirmed that Nox4 is also down-regulated in CnAβ−/− tubule epithelial cells (data not shown). However, because cultured tubule epithelial cells do not undergo hypertrophy in response to HG in vitro, we chose to investigate the signaling pathway in renal fibroblasts. Nox4 expression and regulation have been reported in mesangial cells (31), podocytes (11, 32), and macula densa (13, 33), suggesting that although expression may be highest in the proximal tubule, regulation of Nox4 is widespread in the diabetic kidney. To confirm the relevance of our findings, we also show that ROS and Nox expression are reduced in CnAβ−/− whole kidney lysates.
Although targeting of Nox4 is an area of therapeutic interest in the kidney, recent data showing that constitutive loss of Nox4 actually enhances kidney disease (24) highlights the need for additional study of the pathway. CnAβ and NFAT are new players upstream of Nox that may offer an additional strategy for targeting Nox and hypertrophy in vivo.
Acknowledgments
We thank Dr. K. Griendling for reagents and for review of the manuscript and Drs. R. Price and H. Franch for helpful discussion of the data.
This work was supported, in whole or in part, by National Institutes of Health, NIDDK, Grant T32 DK00756 (to C. R. W.). This work was also supported by a Department of Veterans Affairs MERIT award (to J. L. G.).
C. R. Williams and J. L. Gooch, manuscript in preparation.
- Cn
- calcineurin
- NFAT
- nuclear factor of activated T cells
- ROS
- reactive oxygen species
- DPI
- diphenyleneiodonium
- qRT-PCR
- quantitative RT-PCR
- HG
- high glucose
- NG
- normal glucose.
REFERENCES
- 1. Gooch J. L., Barnes J. L., Garcia S., Abboud H. E. (2003) Calcineurin is activated in diabetes and is required for glomerular hypertrophy and ECM accumulation. Am. J. Physiol. Renal Physiol. 284, F144–F154 [DOI] [PubMed] [Google Scholar]
- 2. Reddy R. N., Knotts T. L., Roberts B. R., Molkentin J. D., Price S. R., Gooch J. L. (2011) Calcineurin A-β is required for hypertrophy but not matrix expansion in the diabetic kidney. J. Cell Mol. Med. 15, 414–422 [DOI] [PMC free article] [PubMed] [Google Scholar]
- 3. Seyer-Hansen K. (1983) Renal hypertrophy in experimental diabetes mellitus. Kidney Int. 23, 643–646 [DOI] [PubMed] [Google Scholar]
- 4. Gooch J. L., Gorin Y., Zhang B. X., Abboud H. E. (2004) Involvement of calcineurin in transforming growth factor-β-mediated regulation of extracellular matrix accumulation. J. Biol. Chem. 279, 15561–15570 [DOI] [PubMed] [Google Scholar]
- 5. Gooch J. L., Pèrgola P. E., Guler R. L., Abboud H. E., Barnes J. L. (2004) Differential expression of calcineurin A isoforms in the diabetic kidney. J. Am. Soc. Nephrol. 15, 1421–1429 [DOI] [PubMed] [Google Scholar]
- 6. Gooch J. L., Tang Y., Ricono J. M., Abboud H. E. (2001) Insulin-like growth factor-I induces renal cell hypertrophy via a calcineurin-dependent mechanism. J. Biol. Chem. 276, 42492–42500 [DOI] [PubMed] [Google Scholar]
- 7. Wang L., Chang J.-H., Paik S.-Y., Tang Y., Eisner W., Spurney R. F. (2011) Calcineurin (CN) activation promotes apoptosis of glomerular podocytes both in vitro and in vivo. Mol. Endocrinol. 25, 1376–1386 [DOI] [PMC free article] [PubMed] [Google Scholar]
- 8. Qi X. M., Wu Y. G., Liang C., Zhang P., Dong J., Ren K. J., Zhang W., Fang F., Shen J. J. (2011) FK506 ameliorates renal injury in early experimental diabetic rats induced by streptozotocin. Int. Immunopharmacol. 11, 1613–1619 [DOI] [PubMed] [Google Scholar]
- 9. Gooch J. L., Roberts B. R., Cobbs S. L., Tumlin J. A. (2007) Loss of the α-isoform of calcineurin is sufficient to induce nephrotoxicity and altered expression of transforming growth factor-β. Transplantation 83, 439–447 [DOI] [PubMed] [Google Scholar]
- 10. Rao A., Luo C., Hogan P. (1997) Transcription factors of the NFAT family. Regulation and function. Annu. Rev. Immunol. 15, 707–747 [DOI] [PubMed] [Google Scholar]
- 11. Eid A. A., Gorin Y., Fagg B. M., Maalouf R., Barnes J. L., Block K., Abboud H. E. (2009) Mechanisms of podocyte injury in diabetes. Role of cytochrome P450 and NADPH oxidases. Diabetes 58, 1201–1211 [DOI] [PMC free article] [PubMed] [Google Scholar]
- 12. Etoh T., Inoguchi T., Kakimoto M., Sonoda N., Kobayashi K., Kuroda J., Sumimoto H., Nawata H. (2003) Increased expression of NAD(P)H oxidase subunits, NOX4 and p22phox, in the kidney of streptozotocin-induced diabetic rats and its reversibity by interventive insulin treatment. Diabetologia 46, 1428–1437 [DOI] [PubMed] [Google Scholar]
- 13. Zhang R., Harding P., Garvin J. L., Juncos R., Peterson E., Juncos L. A., Liu R. (2009) Isoforms and functions of NAD(P)H oxidase at the macula densa. Hypertension 53, 556–563 [DOI] [PMC free article] [PubMed] [Google Scholar]
- 14. Gorin Y., Block K., Hernandez J., Bhandari B., Wagner B., Barnes J. L., Abboud H. E. (2005) Nox4 NAD(P)H oxidase mediates hypertrophy and fibronectin expression in the diabetic kidney. J. Biol. Chem. 280, 39616–39626 [DOI] [PubMed] [Google Scholar]
- 15. Maalouf R. M., Eid A. A., Gorin Y. C., Block K., Escobar G. P., Bailey S., Abboud H. E. (2012) Nox4-derived reactive oxygen species mediate cardiomyocyte injury in early type 1 diabetes. Am. J. Physiol. Cell Physiol. 302, C597–C604 [DOI] [PMC free article] [PubMed] [Google Scholar]
- 16. Schröder K., Zhang M., Benkhoff S., Mieth A., Pliquett R., Kosowski J., Kruse C., Luedike P., Michaelis U. R., Weissmann N., Dimmeler S., Shah A. M., Brandes R. P. (2012) Nox4 is a protective reactive oxygen species generating vascular NADPH oxidase. Circ. Res. 110, 1217–1225 [DOI] [PubMed] [Google Scholar]
- 17. Sedeek M., Callera G., Montezano A., Gutsol A., Heitz F., Szyndralewiez C., Page P., Kennedy C. R., Burns K. D., Touyz R. M., Hébert R. L. (2010) Critical role of Nox4-based NADPH oxidase in glucose-induced oxidative stress in the kidney. Implications in type 2 diabetic nephropathy. Am. J. Physiol. Renal Physiol. 299, F1348–F1358 [DOI] [PubMed] [Google Scholar]
- 18. Roberts B., Pohl J., Gooch J. L. (2008) A fluorimetric method for determination of calcineurin activity. Cell Calcium 43, 515–519 [DOI] [PMC free article] [PubMed] [Google Scholar]
- 19. Livak K. J., Schmittgen T. D. (2001) Analysis of relative gene expression data using real-time quantitative PCR and the 2(−ΔΔC(T)) method. Methods 25, 402–408 [DOI] [PubMed] [Google Scholar]
- 20. Cobbs S. L., Gooch J. L. (2007) NFATc is required for TGFβ-mediated transcriptional regulation of fibronectin. Biochem. Biophys. Res. Commun. 362, 288–294 [DOI] [PMC free article] [PubMed] [Google Scholar]
- 21. Block K., Gorin Y., Abboud H. E. (2009) Subcellular localization of Nox4 and regulation in diabetes. Proc. Natl. Acad. Sci. U.S.A. 106, 14385–14390 [DOI] [PMC free article] [PubMed] [Google Scholar]
- 22. Sedeek M., Gutsol A., Montezano A. C., Burger D., Nguyen Dinh Cat A., Kennedy C. R., Burns K. D., Cooper M. E., Jandeleit-Dahm K., Page P., Szyndralewiez C., Heitz F., Hebert R. L., Touyz R. M. (2013) Renoprotective effects of a novel Nox1/4 inhibitor in a mouse model of Type 2 diabetes. Clin. Sci. 124, 191–202 [DOI] [PubMed] [Google Scholar]
- 23. Bhandarkar S. S., Jaconi M., Fried L. E., Bonner M. Y., Lefkove B., Govindarajan B., Perry B. N., Parhar R., Mackelfresh J., Sohn A., Stouffs M., Knaus U., Yancopoulos G., Reiss Y., Benest A. V., Augustin H. G., Arbiser J. L. (2009) Fulvene-5 potently inhibits NADPH oxidase 4 and blocks the growth of endothelial tumors in mice. J. Clin. Invest. 119, 2359–2365 [DOI] [PMC free article] [PubMed] [Google Scholar]
- 24. Babelova A., Avaniadi D., Jung O., Fork C., Beckmann J., Kosowski J., Weissmann N., Anilkumar N., Shah A. M., Schaefer L., Schröder K., Brandes R. P. (2012) Role of Nox4 in murine models of kidney disease. Free Radic. Biol. Med. 53, 842–853 [DOI] [PubMed] [Google Scholar]
- 25. Gooch J. L., Toro J. J., Guler R. L., Barnes J. L. (2004) Calcineurin A-α but not A-β is required for normal kidney development and function. Am. J. Pathol. 165, 1755–1765 [DOI] [PMC free article] [PubMed] [Google Scholar]
- 26. Gooch J. L. (2006) An emerging role for calcineurin Aalpha in the development and function of the kidney. Am. J. Physiol. Renal Physiol. 290, F769–F776 [DOI] [PubMed] [Google Scholar]
- 27. Bueno O. F., Wilkins B. J., Tymitz K. M., Glascock B. J., Kimball T. F., Lorenz J. N., Molkentin J. D. (2002) Impaired cardiac hypertrophic response in calcineurin Aβ-deficient mice. Proc. Natl. Acad. Sci. 99, 4586–4591 [DOI] [PMC free article] [PubMed] [Google Scholar]
- 28. Williams C. R., Lu X., Sutliff R. L., Hart C. M. (2012) Rosiglitazone attenuates NF-κB-mediated Nox4 upregulation in hyperglycemia-activated endothelial cells. Am. J. Physiol. Cell Physiol. 303, C213–C223 [DOI] [PMC free article] [PubMed] [Google Scholar]
- 29. Biswas G., Anandatheerthavarada H. K., Zaidi M., Avadhani N. G. (2003) Mitochondria to nucleus stress signaling. A distinctive mechanism of NFκB/Rel activation through calcineurin-mediated inactivation of IκBβ. J. Cell Biol. 161, 507–519 [DOI] [PMC free article] [PubMed] [Google Scholar]
- 30. Djamali A., Reese S., Hafez O., Vidyasagar A., Jacobson L., Swain W., Kolehmainen C., Huang L., Wilson N. A., Torrealba J. R. (2012) Nox2 is a mediator of chronic CsA nephrotoxicity. Am. J. Transplant. 12, 1997–2007 [DOI] [PMC free article] [PubMed] [Google Scholar]
- 31. Fu Y., Zhang Y., Wang Z., Wang L., Wei X., Zhang B., Wen Z., Fang H., Pang Q., Yi F. (2010) Regulation of NADPH oxidase activity is associated with miRNA-25-mediated NOX4 expression in experimental diabetic nephropathy. Am. J. Nephrol. 32, 581–589 [DOI] [PubMed] [Google Scholar]
- 32. Gill P. S., Wilcox C. S. (2006) NADPH oxidases in the kidney. Antioxid. Redox Signal. 8, 1597–1607 [DOI] [PubMed] [Google Scholar]
- 33. Cheng H. F., Wang C. J., Moeckel G. W., Zhang M. Z., McKanna J. A., Harris R. C. (2002) Cyclooxygenase-2 inhibitor blocks expression of mediators of renal injury in a model of diabetes and hypertension. Kidney Int. 62, 929–939 [DOI] [PubMed] [Google Scholar]


