

Abstract
Freshwater organisms of North America have had their contemporary genetic structure shaped by vicariant events, especially Pleistocene glaciations. Life history traits promoting dispersal and gene flow continue to shape population genetic structure. Cumberlandia monodonta, a widespread but imperiled (IUCN listed as endangered) freshwater mussel, was examined to determine genetic diversity and population genetic structure throughout its range. Mitochondrial DNA sequences and microsatellite loci were used to measure genetic diversity and simulate demographic events during the Pleistocene using approximate Bayesian computation (ABC) to test explicit hypotheses explaining the evolutionary history of current populations. A phylogeny and molecular clock suggested past isolation created two mtDNA lineages during the Pleistocene that are now widespread. Two distinct groups were also detected with microsatellites. ABC simulations indicated the presence of two glacial refugia and post-glacial admixture of them followed by simultaneous dispersal throughout the current range of the species. The Ouachita population is distinct from others and has the lowest genetic diversity, indicating that this is a peripheral population of the species. Gene flow within this species has maintained high levels of genetic diversity in most populations; however, all populations have experienced fragmentation. Extirpation from the center of its range likely has isolated remaining populations due to the geographic distances among them.
Keywords: Cumberlandia monodonta , spectaclecase, COI, microsatellite, genetic diversity, post-glacial dispersal
Introduction
Species diversification and current population structure reflect both historic and contemporary ecological and evolutionary forces often associated with past vicariant events (Hewitt, 2000). Repeated glaciations in the Pleistocene Epoch were the major force forming species pools for current local communities. During times of drastic climatic change such as interglacial periods, organisms often experienced extinction over large portions of their ranges, survival in glacial refugia, or dispersal to new locations (reviewed in Hewitt, 2000). Even unglaciated areas were not free from affects due to climatic and physical changes. The glaciers created a drier, colder climate and more land was exposed due to lowered sea levels (Smith, 2007). Many hypotheses suggest that organisms survived the Pleistocene in multiple isolated refugia, where small populations and adaptation to different environmental conditions created intraspecific variation (Hewitt, 2000). These processes left their signatures in the genomes of species, and thus, current population genetic structure can be used to infer past evolutionary and demographic events within species (Avise, 2000).
Freshwater systems were altered by repeated expansion and contraction of Pleistocene glaciers. Rivers were often rerouted and large areas of land were inundated by meltwater, allowing aquatic organisms to disperse widely and facilitating mixture of conspecifics from different refugia (Berendzen et al., 2003). In eastern North America, it has been proposed that current species distributions and genetic structure at both intra- and interspecific levels were formed through pre-Pleistocene vicariance (Mayden, 1985; Wiley and Mayden, 1985), geographic isolation through multiple glacial refugia during the Pleistocene glaciations, and post-glacial dispersal with secondary contact (Near et al., 2001; April et al., 2013). Phylogeographic studies have identified changes in drainage patterns through geological history as the major component forming current patterns of genetic variation of freshwater organisms in North America (Strange and Burr, 1997; Near et al., 2001; Berendzen et al., 2003). For example, populations in previously glaciated regions often show reductions in genetic diversity due to founder effects following dispersal from refugia, and signs of range expansion (Bernatchez and Wilson, 1998; Berendzen et al., 2003). In contrast to glaciated northern regions, unglaciated southern highland regions (that is, the Eastern Highlands and Interior Highlands) contain endemic aquatic taxa, which are believed to be the product of geographic isolation due to Pliocene and Pleistocene vicariance events (Mayden, 1985; 1988). While fish phylogeography and speciation have been extensively studied (Mayden, 1988; Near et al., 2001; April et al., 2013), the same is not true for other freshwater organisms.
North America has greater richness of freshwater mussels (Bivalvia: Unionoida) than any other continent (Graf and Cummings, 2007). These organisms possess a complex life history in which larvae (glochidia) are obligate parasites of fishes (or a salamander in one case). Although adult mussels tend to be immobile, dispersal of glochidia occurs with the movement of fish hosts. This relationship has likely led to similar patterns in local species composition and distribution of mussels and fishes (Schwalb et al., 2013). Despite this close relationship, most phylogeographic studies of mussels have been limited to endangered species with either very small population sizes or limited geographic ranges (Roe et al., 2001). Several recent studies of phylogeography of widespread mussel and fish species have found evidence that species colonized previously glaciated drainages, such as the upper Mississippi River and northern Atlantic coastal drainages, from multiple refugia (Bernatchez and Wilson, 1998; Burdick and White, 2007; Elderkin et al., 2007). Populations in glaciated regions typically have less genetic diversity than those in southern unglaciated areas. However, co-occurring mussel species can have different genetic structure at various spatial scales, presumably due to variation in life history traits such as demography and use of different fish hosts (Elderkin et al., 2008). This variation among mussel species becomes important when developing conservation strategies for threatened and endangered species, a status that applies to ∼70% of all mussel taxa in North America (Lydeard et al., 2004).
Cumberlandia monodonta (Say 1829) (Unionoida: Margaritiferidae), the spectaclecase, was historically widely distributed throughout the Mississippi River system, occupying both formerly glaciated and unglaciated areas (Butler, 2002). While fossils of this species have not been reported, it occurred in the mainstems of the Mississippi, Ohio, and Tennessee rivers along with 40 tributaries until the early 20th century; extant populations are limited to a few localities. It has been sporadically reported in 19 streams over the last 20 years, and decline and extirpation of local populations is likely due mainly to stream impoundment (Butler, 2002). Along with habitat destruction, the fragmentation of rivers has had serious ramifications for fish movement and, therefore, mussel dispersal and gene flow. However, the host fish of C. monodonta is still unknown (Baird, 2000; Butler, 2002). Due to drastic reduction in its current range, the species is listed as endangered under the U.S. Endangered Species Act and by the IUCN.
The historic distribution of C. monodonta prior to recent population declines is similar to several widely distributed fish species that have been studied using phylogeographic analyses (Bernatchez and Wilson, 1998; Near et al., 2001). Comparisons among fish species, especially those found in previously glaciated areas, have revealed similar changes in overall genetic diversity, but different colonization histories. Fish inhabiting Mississippian refugia were able to use proglacial lakes for dispersal into northern habitats, facilitating many different patterns of dispersal as lakes changed with receding and advancing ice sheets (Gagnon and Angers, 2006). With a similar distribution, C. monodonta could have also survived glaciation events in multiple refugia, where local adaptation and genetic drift may have occurred.
We investigated genetic variation in extant populations of C. monodonta in order to make inferences about the species' evolutionary history since the Pleistocene. First, we quantified within- and among-population genetic variation and divergence for extant populations from throughout the historical range of the species using mitochondrial cytochrome oxidase subunit I (COI) sequences and 17 microsatellite loci. We hypothesized that post-glacial founder effects in the one extant population north of the last glacial maximum should have reduced genetic diversity compared with southern unglaciated populations that were stable for longer periods. In addition to estimating genetic diversity indices for each population, we estimated divergence times among populations using a relaxed molecular clock with a coalescent model. Second, we examined historical demography by simulating alternative scenarios during Pleistocene glaciation using an approximate Bayesian computation (ABC) framework, a number of glacial refugia, and post-glacial admixture and dispersal based on the genetic structure of current populations.
Materials and methods
Tissue was obtained from 192 individuals from five populations (Table 1; Figure 1). Three large populations were sampled in 2002: 48 individuals from the Clinch River, Hancock County, TN, USA; 50 from the St Croix River, Chisago County, MN, USA; and 40 from the Gasconade River, Osage County, MO, USA. An additional 34 individuals were sampled from the Meramec River, Franklin County, MO, USA in 2004, and 20 individuals were sampled from the Ouachita River, Ouachita County, AR, USA in 2012. These are the only rivers currently known to have large numbers of individuals. Populations we sampled were from several biogeographic provinces identified by Haag (2009): Upper Mississippi Province (Gasconade, Meramec, and St Croix), Tennessee–Cumberland Province (Clinch), and the border of the Interior Highland and Mississippi Embayment provinces (Ouachita). Because the last glacial maximum advanced south to the course of the modern Missouri and Ohio rivers, only the St Croix population was glaciated during the Pleistocene, whereas the Gasconade and Meramec populations are located in the vicinity of the last glacial maximum (Burr and Page, 1986). Despite the fact that the latter rivers were not glaciated, the fish and mussel communities are similar to those of the Upper Mississippi Province (Mayden, 1988; Haag, 2009) and post-Pleistocene dispersal from this region to the upper Mississippi has been suggested (Near et al., 2001; Berendzen et al., 2003).
Table 1. Descriptive statistics of COI and 16 microsatellite loci for each collection site of Cumberlandia monodonta from populations in the Clinch River, TN; Gasconade and Meramec Rivers, MO; Ouachita River, AR; St. Croix River, MN; Tennessee River, AL; and a single specimen in the Cumberland River, KY.
| Population |
COI
|
Microsatellite
|
||||||||||||
|---|---|---|---|---|---|---|---|---|---|---|---|---|---|---|
| n | H | H R | H P | K | π | % Lineage 1 | N A | A R | A P | H O | H E | θ | N e | |
| Clinch | 48 | 18 | 11.0 (1.45) | 11 | 4.17 | 0.0062 | 71 | 13.9 (1.77) | 12.6 (1.49) | 22 | 0.770 (0.034) | 0.850 (0.028) | 8.750 (8.146–9.400) | 4375 (4073–4700) |
| Gasconade | 40 | 9 | 6.6 (1.05) | 6 | 3.18 | 0.0047 | 82 | 12.8 (1.62) | 11.8 (1.40) | 8 | 0.829 (0.024) | 0.841 (0.024) | 8.811 (8.185–9.501) | 4406 (4093–4751) |
| Meramec | 34 | 8 | 7.2 (0.98) | 3 | 2.97 | 0.0044 | 83 | 13.8 (1.78) | 12.7 (1.50) | 19 | 0.815 (0.028) | 0.854 (0.022) | 11.094 (10.245–12.046) | 5547 (5123–6023) |
| Ouachita | 20 | 3 | 3.0 (0.00) | 3 | 0.48 | 0.0007 | 0 | 8.0 (1.15) | 7.9 (1.12) | 12 | 0.702 (0.061) | 0.737 (0.041) | 2.820 (2.648–3.006) | 1410 (1324–1503) |
| St. Croix | 50 | 9 | 6.5 (1.07) | 4 | 2.25 | 0.0033 | 90 | 13.2 (1.69) | 12.1 (1.45) | 8 | 0.804 (0.032) | 0.842 (0.026) | 9.118 (8.438–9.868) | 4559 (4219–4934) |
| Tennessee | 5 | 4 | — | 0 | 2.00 | 0.0030 | 100 | — | — | — | — | — | — | |
| Cumberland | 1 | 1 | — | 0 | — | — | 100 | — | — | — | — | — | — | |
| Total | 198 | 32 | 9.6 (1.61) | — | 3.83 | 0.0059 | 74 | 12.3 (0.75) | 12.8 (1.55) | 69 | 0.784 (0.017) | 0.825 (0.014) | — | — |
Abbreviations: AP, number of private alleles; AR, rarefied allelic richness; COI, cytochrome oxidase subunit I; H, number of haplotypes; HE, mean expected heterozygosity; HO, mean observed heterozygosity; HP, number of private haplotypes; HR, rarefied number of haplotypes; K, mean number of base pair differences; n, number of samples; NA, mean number of observed alleles; π, nucleotide diversity; %Lineage 1, percentage of Lineage 1 haplotypes; θ, effective population size (Ne) parameter (θ=4Neμ, where μ is mutation rate per generation). Ne estimates were based on a mutation rate of 5 × 10⁻⁴ per generation. (s.d.), except θ and Ne have 95% confidence interval.
Figure 1.

Map of the central United States indicating sites where Cumberlandia monodonta were sampled. Populations are labeled with the names of their resident rivers (abbreviations in parentheses). Pie charts represent the frequencies of Lineage 1 (light gray) and Lineage 2 (dark gray) resolved in the mtDNA phylogeny (Table 1 and Figure 3).
All specimens were collected by wading or diving; animals were sampled non-destructively using mantle snips or tissue swabs, and then returned to the river bottom. Samples were flash frozen in liquid nitrogen or preserved in 95% ethanol. A voucher specimen from the Meramec population was placed in the Illinois Natural History Survey Collection (number INHS 31198). Additionally, we used museum specimens from extirpated populations in the Tennessee River, AL, USA and the Cumberland River, KY, USA. Mantle tissue from museum specimens was clipped by museum personnel and sent to us. However, due to the small number of museum specimens and difficulty with DNA amplification (many had been preserved in formalin before being stored in ethanol), we included museum specimens only in limited genetic analyses. Total genomic DNA from live organisms was extracted from ∼25 mg tissue using DNeasy animal tissue kits (Qiagen, Valencia, CA, USA). Similar quantities of tissue from museum specimens were extracted with phenol/chloroform.
Polymerase chain reaction and sequencing of a 678-bp region of the COI gene was performed as in Elderkin et al. (2007), except BigDye v3.1 (Applied Biosystems, Foster City, CA, USA) was used for sequencing reactions. An ABI Genetic Analyzer produced sequences that were aligned visually in DNADYNAMO (Blue Tractor Software, Llanfairfechan, UK).
We analyzed 17 tri- and tetranucleotide microsatellite loci (Inoue et al., 2011). Forward primers were labeled with a 5′ fluorescent tag (6-FAM, NED, PET or VIC) for visualization. We performed six sets of multiplex PCR (Plex1: CMA1-CMD9-CMH12; Plex2: CMB3-CMD1; Plex3: CMB6-CMC109-CMC126; Plex4: CMC115-CMD102-CMH7; Plex5: CMA2-CMC5-CMD101-CMH9; and Plex6: CMC11-CMH8) designed by MULTIPLEXMANAGER v1.2 (Holleley and Geerts, 2009). We performed fragment analyses on an ABI Genetic Analyzer with LIZ600 size standard (Applied Biosystems). We used PEAKSCANNER v1.0 (Applied Biosystems) to score alleles and TANDEM v1.07 (Matschiner and Salzburger, 2009) to assign integer numbers to DNA fragment sizes.
mtDNA analysis
Genetic diversity was analyzed by examining haplotype frequencies and molecular divergence in ARLEQUIN v3.5.1.3 (Excoffier and Lischer, 2010). To correct for sample-size bias, we used rarefaction to estimate the number of haplotypes per population. ARLEQUIN was also used to calculate mean nucleotide diversity (π) within each population. To test for a latitudinal gradient in genetic diversity (Elderkin et al., 2007), the number of haplotypes, nucleotide diversity, and mean number of base pair differences within populations were regressed with latitude using linear regression analysis.
Due to small sample size, further analyses only included the five large extant populations (that is, Clinch, Gasconade, Meramec, Ouachita, and St Croix). Genetic differentiation was analyzed within and among all five populations using an analysis of molecular variance; significance of differentiation was tested using with 9999 nonparametric permutations using GENALEX v6.3 (Peakall and Smouse, 2006). The mean value of ΦST differences among pairs of populations was calculated, with 9999 permutations used to test significance (P=0.05). Correlation of matrices of pairwise genetic differences (ΦST) and geographic distances between populations was evaluated with a Mantel test. We measured river distance between populations using ArcGIS v9.3 (ESRI, Redlands, CA, USA). A mismatch distribution was calculated in ARLEQUIN for all of the individuals pooled, for each population, and for each lineage obtained from phylogenetic analyses (see RESULTS).
Phylogenetic relationships were analyzed with Bayesian inference, using several margaritiferid sequences and one unionid sequence from GenBank as outgroups. We included five C. monodonta individuals from the Tennessee River and one individual from the Cumberland River. Only unique haplotypes were used in the analysis. We determined the most suitable model of DNA evolution for Bayesian inference with a hierarchical log-likelihood-ratio test using KAKUSAN4 (Tanabe, 2011). The best evolutionary model for the data set was the HKY+G model. Bayesian inference was conducted in MRBAYES v3.2 (Ronquist et al., 2012). Two simultaneous Markov runs of four chains with default heat settings were conducted with a random starting tree for 2 million generations, sampling trees every 1000 generations and excluding the first 25% of trees as burn-in. The number of trees to exclude as burn-in was evaluated by using TRACER v1.5 (Rambaut and Drummond, 2009). When the likelihood values reached a plateau, we considered the Markov chains stationary. A 50% majority rule consensus tree was generated from 3000 trees and the proportion of trees in which each node occurred was reported as the posterior probability of the node.
A 95% confidence parsimony network was created with TCS v1.21 (Clement et al., 2000). Multiple connections between haplotypes were simplified by assigning the shortest path from the most frequent haplotype (Fetzner and Crandall, 2003). We estimated divergence times among lineages generated from the phylogenetic analysis (see RESULTS) using a relaxed molecular clock method implemented in BEAST 1.7.4 (Drummond et al., 2012). An UPGMA starting tree was estimated under the HKY+G model with empirical base frequencies. An uncorrelated lognormal clock model and constant size coalescent model were used. We calibrated the clock using COI substitution rates ranging from 0.67–1.21% substitution per million years obtained from a marine bivalve (Marko, 2002). Analysis was run for 10 million generations with sampling every 1000 generations and a burn-in of 25% of the total saved trees.
Microsatellite analysis
We used MICRO-CHECKER (van Oosterhout et al., 2004) to detect null alleles and GENEPOP v4.0.10 (Rousset, 2008) to conduct exact tests of pairwise linkage disequilibrium and Hardy–Weinberg equilibrium. We estimated summary statistics of population genetic parameters including mean number of observed alleles per locus (NA), number of private alleles (AP), and observed and expected heterozygosities (HO and HE) for each population using GENALEX. We used FSTAT (Goudet, 1995) to estimate allelic richness (AR) for each population via rarefaction, and ARLEQUIN to perform an analysis of molecular variance to examine population structure. We estimated genetically effective population size (Ne) for each population from θ (=4Neμ, which combines effective population size and mutation rate μ), a value generated in MIGRATE-N v3.3.2, (Beerli, 2006) which implements coalescent models to estimate long-term average migration rates among populations and θ. We performed maximum likelihood analysis using 10 short chains of 1000 steps and two long chains of 10 000 steps, sampled every 100 steps following a burn-in of 10 000 steps. Once θ values were obtained, Ne was calculated with a generalized mutation rate of 5 × 10⁻⁴ per generation (Goldstein and Schlotterer, 1999), because we do not have mussel-specific mutation rates for microsatellite loci.
We examined whether or not there are distinct population clusters by assigning individuals to populations using STRUCTURE v2.3.4 (Pritchard et al., 2000), which groups individuals based on their genotypes without a priori delineation of populations. We used the admixture model and allowed for correlated allele frequencies to account for any migration in the data set. We ran STRUCTURE with a burn-in period of 100 000 generations followed by 200 000 iterations for k=1 through 5 with 20 replicates for each k. We evaluated the logarithm of the probability of the data and estimates of Δk using STRUCTURE HARVESTER v0.6.93 (Earl and vonHoldt, 2012) to determine the most likely number of distinct clusters. We averaged each individual's admixture proportions over the 20 replicates for the best k using CLUMPP v1.1.2 (Jakobsson and Rosenberg, 2007), then produced a graphical display of results using DISTRUCT v1.1 (Rosenberg, 2004).
ABC analysis of historic demography
We tested different demographic scenarios in the Pleistocene using the ABC framework implemented in DIYABC (Cornuet et al., 2010). Mitochondrial DNA phylogenetic analyses identified two lineages, suggesting therefore two glacial refugia (see RESULTS). We then used microsatellite markers to simulate historic demography during the Pleistocene glaciation. We compared three demographic scenarios characterized by the existence of two glacial refugia with post-glacial admixture and dispersal events (Figure 2). At generation t0 (that is, the present), all scenarios had the five large extant populations. Because neither mtDNA nor microsatellite markers showed isolation-by-distance (see RESULTS), we simulated all populations simultaneously diverging from the ancestral population. Although there are numerous possible models, we felt these three scenarios represent the most likely demographic scenarios during and after the Pleistocene.
Figure 2.
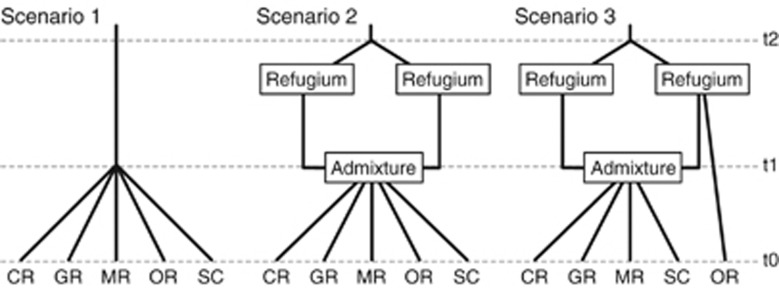
Demographic scenarios in the Pleistocene tested using DIYABC. All three scenarios assume that there are five populations (CR, Clinch; GR, Gasconade; MR, Meramec; OR, Ouachita; and SC, St. Croix population) at the present time (t0) and these populations diverged in the past. The time scale is shown on the right.
Prior values of Ne for current populations were set as 10–10 000 individuals with a uniform distribution and an ancestral population was set as 10–100 000 (up to 10 times larger than current Ne) with a log-uniform distribution (Table 3). These values were used based on current Ne calculated from MIGRATE-N and several preliminary runs to confirm upper boundaries of prior values. Prior values for time points were chosen as follows: time of the divergence in the ancestral population (t2) was 13 384–60 153 generations ago (0.348–1.564 Mya), with a uniform distribution based on divergence time estimated between the two mtDNA lineages (see RESULTS); and time of the admixture events (t1) was 1–60 153 generations ago (26 years ago–1.564 Mya) with a uniform distribution (Table 3). We used a mean generation time of 26 years for C. monodonta, estimated by constructing a static life table with demographic data for Missouri populations (Baird, 2000). The rate of admixture between the refugia was drawn in a uniform distribution (0.001–0.999). We chose the following summary statistics for each population: mean number of alleles, mean genetic diversity, mean allele size variance, and mean Garza–Williamson's M. For each pair of populations, we calculated FST and the classification index. We used a default generalized stepwise mutation model with a mean mutation rate of 1 × 10⁻⁵ to 10−3 (Table 3). We ran one million simulations for each scenario and compared them by estimating posterior probabilities using logistic regression (Cornuet et al., 2008). We assessed confidence in scenario choice by evaluating Type I and Type II error rates (Cornuet et al., 2010). One hundred test data sets were simulated using each of the three scenarios. The posterior probabilities of the scenarios were evaluated for each of the simulated data sets. Type I error rates were estimated by counting the proportion of times that Scenario X did not have the highest posterior probability among the competing scenarios when Scenario X was the true scenario. Type II error rates were estimated by the proportion of times that Scenario X had the highest posterior probability among the competing scenario when Scenario X was not the true scenario.
Results
mtDNA analysis
We recovered 32 unique COI haplotypes with 31 phylogenetically informative sites. After correcting for unequal sample sizes via rarefaction, the Clinch population had the greatest variation with 11.0 haplotypes, and each of the other four populations contained 3.0–7.2 haplotypes (Table 1). Unique haplotypes were found in each population, and all haplotypes in the Ouachita population were unique (Table 1). Nucleotide diversity values within localities were extremely low, ranging from 0.0007–0.0064 (Table 1). Analysis of molecular variance revealed 30.8% of genetic variation was among populations. However, this high genetic variation among populations was primarily due to the Ouachita population. When it was excluded, only 4.1% of genetic variation was found among populations. There were significant pairwise ΦST values between the Clinch and St. Croix, and the Clinch and Gasconade populations (Table 2). The Ouachita population had significant pairwise ΦST values with all other populations. There were no significant correlations of pairwise ΦST with river distance among populations (Mantel's r=−0.236, P=0.49). Pairwise comparisons of all sequences form a bimodal mismatch distribution (Supplementary Information), with distinct modes at 1 and 7 bp. These modes are also present in each population mismatch distribution except the Ouachita population (data not shown). These bimodal distributions indicate the presence of two lineages (see below), where mismatch distributions for each lineage form unimodal distributions (Supplementary Information). The Lineage 1 mismatch distribution is consistent with population expansion in the recent past (P=0.58), whereas Lineage 2 indicates a stationary population (P=0.02).
Table 2. Pairwise ΦST values for COI sequences (above diagonal) and FST values for 16 microsatellite loci (below diagonal) from five populations of Cumberlandia monodonta.
| Clinch | Gasconade | Meramec | Ouachita | St Croix | |
|---|---|---|---|---|---|
| Clinch | — | 0.041 | 0.015 | 0.551 | 0.118 |
| Gasconade | 0.009 | — | −0.003 | 0.693 | 0.005 |
| Meramec | 0.006 | 0.008 | — | 0.700 | 0.038 |
| Ouachita | 0.081 | 0.096 | 0.090 | — | 0.779 |
| St. Croix | 0.003 | 0.004 | 0.001 | 0.088 | — |
Values in bold indicate statistical significance at P<0.05 with 9999 nonparametric permutations of the data.
Consistent with previous studies (Huff et al., 2004), our BI phylogenies showed that C. monodonta forms a monophyletic clade with high posterior probability (Figure 3a), which is basal within Margaritiferidae. Within C. monodonta, there are two major clades: Lineage 1 has many haplotypes forming an unresolved polytomy, whereas a few haplotypes form a well-supported clade that is Lineage 2. Overall, 74% of individuals belong to Lineage 1; the Ouachita population contained only Lineage 2, which was a minority of individuals in all other populations (Table 1 and Figure 1). Most haplotypes within a lineage were 1 bp different; the minimum number of differences between the two lineages was 5 bp (Figure 3b). The Cumberland River haplotype was one of the most common haplotypes in other populations. Median divergence time between lineages, estimated from the relaxed molecular clock, was 0.81 Mya (95% credible interval: 0.348–1.564 Mya) with posterior probability of 0.94 in Lineage 1 and 1.00 in Lineage 2. We did not observe further diversification of lineages with high posterior probabilities (data not shown).
Figure 3.

(a) Bayesian inference of phylogeny for Margaritiferidae and (b) a parsimony network for Cumberlandia monodonta. Cumberlandia monodonta haplotypes are numbered according to sample ID, letters designate initials of populations (except Cumberland River=B). (a) Posterior probabilities from Bayesian analysis are along the branches. Sequences from the genus Margaritifera and the outgroup, Pyganodon grandis, are from GenBank. (b) Each line represents one base pair difference between haplotypes, black dots are inferred missing haplotypes, and haplotype frequency is relative to the size of the circle.
Microsatellite analysis
All loci were polymorphic in all five populations. There were signs of linkage disequilibrium between five pairs of loci after applying a Bonferroni correction to the probability levels (P<0.000074); however, no pairs of loci were consistently linked among the populations. One locus (CMB3) and several different loci in five populations indicated signs of null alleles. The test for Hardy–Weinberg equilibrium indicated a deviation from Hardy–Weinberg equilibrium at two loci (CMB3 and CMD102) in the Clinch, one locus (CMB3) in the Gasconade, two loci (CMB3 and CMD101) in the Ouachita, and three loci (CMB3, CMD1, and CMH7) in the St. Croix population, after applying a Bonferroni correction (P<0.000488). Thus, we excluded CMB3 from further analyses.
The number of alleles per locus ranged from 5 to 51 (total of 327 alleles over 16 loci). Allelic richness ranged from 7.9 in the Ouachita population to 12.7 in the Meramec population (Table 1). Mean observed heterozygosity ranged from 0.702 in the Ouachita population to 0.829 in the Gasconade population, and the mean expected heterozygosity ranged from 0.737 in the Ouachita population to 0.854 in the Meramec population. The lowest genetic diversity was consistently found in the Ouachita population. Analysis of molecular variance revealed 96.5% of genetic variation was within populations and the overall FST value was 0.035 (P<0.001); pairwise FST ranged from 0.001 to 0.096 (Table 3). There were significant FST values between the Clinch and Gasconade, Clinch and Meramec, and Gasconade and Meramec populations. The Ouachita population had significant pairwise FST values with all the other populations. Correlation of pairwise values of ΦST and FST were marginally significant (Mantel's r=0.987; P=0.051). MIGRATE-N estimated a range in θ from 2.820 in the Ouachita population to 11.094 in the Meramec population (Table 1). Based on θ, the Ne ranged from 1410 (95% CI: 1324–1503) in the Ouachita to 5547 (5123–6023) in the Meramec population (Table 1).
Table 3. Prior distributions of parameters and posterior parameter values for Scenario 2.
| Parameter | Population |
Prior distributions
|
Posterior parameter estimates
|
||||
|---|---|---|---|---|---|---|---|
| Minimum | Maximum | Distribution | Median | 95% credible interval | |||
| N e | Clinch | 10 | 10 000 | Uniform | 7330 | 3790 | 9740 |
| N e | Gasconade | 10 | 10 000 | Uniform | 5570 | 2200 | 9480 |
| N e | Meramec | 10 | 10 000 | Uniform | 7520 | 3920 | 9770 |
| N e | Ouachita | 10 | 10 000 | Uniform | 375 | 104 | 2890 |
| N e | St Croix | 10 | 10 000 | Uniform | 6480 | 2750 | 9620 |
| N e | Ancestral | 10 | 100 000 | Log-Uniform | 26 000 | 147 | 92 400 |
| t1 (generations) | 1 | 60 153 | Uniform | 122 | 28 | 414 | |
| t2 (generations) | 13 384 | 60 153 | Uniform | 33 900 | 14 600 | 58 500 | |
| Mean mutation rate (μ) | 1 × 10⁻⁵ | 1 × 10⁻³ | Uniform | 6.56 × 10⁻⁴ | 1.57 × 10⁻⁴ | 9.84 × 10⁻⁴ | |
The Bayesian cluster analysis indicated explicit boundaries between the Ouachita population and the others at k=2 (Figure 4). Group 1 included all individuals except the Ouachita individuals and Group 2 contained all Ouachita individuals. A cluster analysis on Group 1 alone did not recover any additional differentiation (that is, k=1, data not shown).
Figure 4.
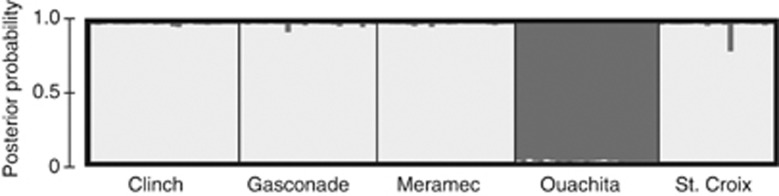
Bar plot obtained from STRUCTURE, assigning individuals into two groups (k=2): Group 1 (light gray) includes all individuals except the Ouachita individuals and Group 2 (dark gray) includes all individuals from the Ouachita population. Labels are a priori population assignments.
ABC analysis of historic demography
We tested three demographic scenarios (Figure 2). Scenario 1 was a null model, where all five populations diverged simultaneously from a single recent common ancestor with equal divergence rates. Because phylogenetic analysis showed two lineages, Scenario 2 assumed two glacial refugia followed by post-glacial admixture and dispersal events. Furthermore, because the Ouachita population consists of only one mtDNA lineage and has distinct microsatellite population structure, we assumed the Ouachita population did not experience admixture from two refuges. Thus, Scenario 3 assumed the Ouachita population was a direct descendent from one refugium and the other populations were diverged simultaneously from the admixed population. Analysis with DIYABC identified Scenario 2 as most highly supported, with moderately strong posterior probability (0.5778; Table 4). This posterior probability value is similar to, or slightly lower than, other published posterior probabilities for best scenarios using this approach (e.g. Lander et al., 2011). The other two scenarios had much lower support. The Type I error rate estimate for Scenario 2 was relatively high (0.60; Table 4) compared with Scenario 1; however, the Type II error rate for Scenario 2 was low (0.18–0.24; Table 4). Although Scenario 2 had a high Type I error, indicating that it was rarely chosen when it was the true scenario, the high posterior probability and low Type II error suggests greater confidence that Scenario 2 is likely to be the truest of the proposed scenarios.
Table 4. Type I and Type II error rates and posterior probabilities for each scenario calculated from DIYABC.
| True scenario used for |
Type II error rate
|
Type I error | Posterior probability(95% credible | ||
|---|---|---|---|---|---|
| simulation | Scenario | Scenario | Scenario | rate | interval) |
| 1 | 2 | 3 | |||
| Scenario 1 | — | 0.24 | 0.23 | 0.47 | 0.2692 (0.2312–0.3073) |
| Scenario 2 | 0.30 | — | 0.30 | 0.60 | 0.5778 (0.5363–0.6193) |
| Scenario 3 | 0.31 | 0.18 | — | 0.59 | 0.1529 (0.1242–0.1816) |
Posterior distributions of Ne estimates in Scenario 2 were consistent with Ne estimates from MIGRATE-N; the Ouachita population had the lowest Ne and the other populations were similar to each other (Table 3). The divergence time of current populations (t1) was 122 generations ago (28–414 generations ago; Table 3), which is 3172 years ago (728–10 764 years ago). Mean mutation rate (μ) was 6.56 × 10⁻⁴ per generation (1.57–9.84 × 10⁻⁴ per generation; Table 3).
Discussion
Both mtDNA and microsatellite loci have substantially high levels of genetic variation in C. monodonta. There were more haplotypes in this species compared with other endangered mussels (Zanatta and Murphy, 2008), but about the same as in other widespread species (Elderkin et al., 2007). Because most haplotypes were only 1 bp different, and both nucleotide diversity and among-population variation were low, our results indicate recent population expansion and a high degree of gene flow among populations following post-Pleistocene dispersal. Allelic richness and heterozygosity per population were similar to other unionid species (Eackles and King, 2002), but much higher than European Margaritifera margaritifera (Geist and Kuehn, 2005). This trend was also found in a previous allozyme study of C. monodonta (Monroe, 2008). Within-population variation was not negatively correlated with latitude, unlike the results for other mussels (Elderkin et al., 2008) and fish (Bernatchez and Wilson, 1998); thus our results do not support the hypothesis that the one extant population north of the last glacial maximum has lower genetic variation than southern unglaciated populations due to post-glacial founder effects. In fact, the northernmost population (St Croix) had almost the same genetic diversity as the Gasconade and Meramec populations, and greater overall diversity (θ) than the Clinch and Gasconade populations. The southernmost population (Ouachita) had the lowest nucleotide diversity, allelic richness, and heterozygosity. This surprising result could have occurred if the St Croix population was colonized by a large contingent of mussels via highly mobile fish hosts from more than one refugium, suggesting wide-ranging dispersal and high gene flow throughout the species' range. Alternatively, the Ouachita population perhaps is a peripheral population with low gene flow due to isolation from other populations and small effective population size (see below).
The COI phylogeny indicates that C. monodonta has two distinct mitochondrial lineages supported by high posterior probabilities. These two lineages are found across most of the extant range of this species (all but the Ouachita population) covering thousands of river kilometers. Because the divergence time of these lineages was mid-Pleistocene, these lineages presumably have originated independently in two glacial refugia. Consequently, post-glacial admixture and dispersal resulted in coexistence of these lineages in most of the range. The Ouachita population is, on the other hand, composed of only Lineage 2 individuals; possible explanations are that the population was founded from a small group of colonists dominated by Lineage 2 followed by complete lineage sorting, or that Lineage 1 was never present in this population. This genetic structure was consistent with microsatellite analyses; the Bayesian cluster analysis indicated one group composed of the Ouachita population and the other composed of the remainder of the populations. Analysis using ABC supports the hypothesis that the Ouachita population, although founded from a post-glacial admixture of both lineages, is composed of a subset of the species' total genetic variation and that this limited variation arose relatively recently.
Admixture of the two COI lineages and non-significant population genetic structure indicate that gene flow was high across most of the range of the species (with the exception of the Ouachita), including unglaciated streams such as the Clinch, Tennessee, and Cumberland rivers. For mussel species studied to date, most have met the prediction of dispersal by the stepping-stone model (Berg et al., 1998; Elderkin et al., 2007; Elderkin et al., 2008), which is expected, as mussels live in linear river systems with patchy distributions and use host fishes that are confined to the same linear systems. However, our results indicate a panmictic population across most of the range of C. monodonta. This panmictic population may be due to life history features of C. monodonta along with highly connected riverscapes prior to modern human impact. Similar to European margaritiferid species, C. monodonta has impressively high fecundity, from 1.9–9.6 million per female (Baird, 2000). Release of such large numbers of glochidia increases the probability of successfully infesting host species. If the host is a highly migratory fish species or the riverscape is nonfragmented, this can result in dispersal across long river distances (Elderkin et al., 2008; Grobler et al., 2011). Unfortunately, the host species for C. monodonta are still unknown (Butler, 2002); our results suggest studies need to test fish species whose movements might account for the lack of differentiation in contemporary populations of C. monodonta.
Demographic reconstruction using the ABC framework showed evidence of two refugia during the Pleistocene glaciations, followed by post-Pleistocene admixture and dispersal of the two refuge populations. However, the posterior probability of the best-fit scenario had only moderately high support. This could be due to the fact simulations were conducted solely with microsatellite data, which indicated weak genetic structure among populations through Bayesian cluster analysis. However, the two refugia scenario is further supported by the existence of two COI lineages indicating that at some point in the past, these lineages were likely isolated in two discrete geographic areas. Multiple glacial refugia are a common pattern found in large river mussel and fish species (Elderkin et al., 2008; April et al., 2013). Furthermore, estimates of divergence times in the mid-Pleistocene (0.81 Mya) lend support to a hypothesis of Pleistocene isolation followed by rapid post-Pleistocene dispersal consistent with that described for fishes (Gagnon and Angers, 2006; April et al., 2013). Our simulation results support simultaneous dispersal events from the admixed population in relatively recent times. We should, however, note that DIYABC does not allow migration among populations in the scenario; this may underestimate dispersal events from the admixed population, because Bayesian cluster analysis indicated panmixia of most populations. Further analysis incorporating isolation with migration is needed to investigate timing of dispersal events. Our results do suggest that dispersal events from the admixed population occurred post-Pleistocene and rapidly across the current range of the species. The mismatch distributions for the overall data set and Lineage 1 fit a model of rapid population expansion. Mussels would have dispersed along with fishes as the latter entered glaciated regions from multiple refugia. Presence of the two lineages across the range, no correlation of genetic differentiation with geographic distance, and homogeneity of allele frequencies are all consistent with high migration rates for this species. Such high migration rates are not unreasonable; field studies of Margaritifera hembeli have shown rapid recolonization rates (10% replacement of a population in 30 months) for populations that had been completely removed by large flood events (Curole et al., 2004).
The Ouachita population, however, is distinct from the other C. monodonta populations. The Interior Highlands (that is, Ouachita and Ozark highlands) possess distinct aquatic faunas, including endemic mussels, fish, crayfish, and salamanders (Mayden, 1985; Haag, 2009). These unique communities are believed to have been formed during pre-Pleistocene vicariant events that separated this region from the eastern Central Highlands, followed by repeated isolation due to Pleistocene glaciations (Mayden, 1988). However, the Ouachita population of C. monodonta appears to have been separated from the other populations during the Holocene. The formation of its current population genetic structure can be explained with a combination of two factors. First, this population has the smallest effective population size. An estimate of Ne in the Ouachita population is over one order of magnitude different from other populations. This facilitates reduction of genetic variability via genetic drift. In fact, the Ouachita population comprises only one lineage of COI haplotype. As ABC analysis supported the scenario that the Ouachita population diverged from the same admixed population as the other populations, the fact that the former comprises one lineage is likely a consequence of lineage sorting. The distinctiveness of the Ouachita population is due to lower genetic variation, rather than the presence of unique alleles. Second, such low genetic variation is consistent with low gene flow due to dispersal limitation. All three haplotypes of the Ouachita population are endemic, which suggests little or no apparent gene flow with other populations. Furthermore, relatively higher ΦST/FST values between the Ouachita and the other populations indicate recent isolation. Significant isolation of populations in the Ouachita River has been reported in other widespread mussel and fish species (Berendzen et al., 2003; Elderkin et al., 2008). Aquatic species in the uplands of the Ouachita are isolated from the upper Mississippi by the Lower Mississippi Embayment, a region with a much different (and less diverse) community of mussels and fish (Mayden, 1985; Haag, 2009). Together, these factors lead to the conclusion that the Ouachita is a ‘peripheral population' in the sense that it is smaller in size, and isolated from main and contiguous populations (Lesica and Allendorf, 1995).
Our results reveal that Pleistocene glaciations promoted divergence among populations, and post-Pleistocene dispersal had a strong affect on the geographic structuring of genetic diversity in C. monodonta. Homogeneous genetic structure across most of the range provides evidence of high gene flow post-Pleistocene, and thus these populations can be considered a single evolutionary unit. The Ouachita population, on the other hand, is a peripheral population of C. monodonta. As the importance of protecting peripheral populations is widely recognized because peripheral populations are potentially important sites of evolutionary diversity and future speciation events (Lesica and Allendorf, 1995), we recommend the Ouachita population be designated as an evolutionarily significant unit that must be considered in the development of conservation strategies and the species recovery plan. Furthermore, panmictic populations suggest a highly connected riverscape in North America prior to modern human impact. However, all populations will likely become genetically differentiated over time for two reasons—first, because the rivers connecting these distant populations are now impounded and therefore fragmented. Physical barriers on many streams that prevent fish host movement will interrupt gene flow. Second, the loss of intermediate populations lowers chances of gene flow among remaining populations, regardless of physical barriers.
We should note, however, that the geographical coverage of our study was limited due to the small number of extant populations. Were we able to sample additional populations, for instance from tributaries of the Ohio, Tennessee, and Cumberland rivers, we might have uncovered additional population genetic structure and glacial refugia for this species. However because this species has been extirpated from most of its former range, fully understanding its evolutionary history will be difficult, unless extraction of DNA from museum shell collections becomes possible. Additional genetic markers, such as single nucleotide polymorphisms, may reveal further geographic patterns while also accounting for selection and adaptation to local environments. Alternatively, comparative phylogeography between host fishes and C. monodonta may help locate where isolation occurred during the Pleistocene. Clearly, identification of fish hosts is essential for understanding how this mussel experienced such high levels of gene flow prior to its decline.
The fate of this species, as well as much of North America's aquatic fauna, is unclear. Complex geological forces shaped a highly diverse community of invertebrates and fishes in the streams of eastern North America. Human alteration of these streams now threatens to extirpate many of these species. Conservation efforts must incorporate knowledge gained from historical and contemporary biogeographical studies in order to successfully preserve variation and ensure the evolutionary potential of these imperiled species.
Data archiving
COI sequences are available in NCBI GenBank (accession numbers: KF647332-KF647529), and microsatellite genotypic data, in GENPOP format, are available in the Dryad repository: doi:10.5061/dryad.439vn.
Acknowledgments
We would like to thank M Hove, S McMurray, JS Faiman, J Jones, S Ahlstedt, C Leary-Elderkin, T Levine, W Posey II, and J Harris for help with sample collections. Technical assistance was provided by S Roark, G Moyer, A Williams, numerous undergraduate technicians in the Berg Lab, and the Center for Bioinformatics and Functional Genomics at Miami University. Museum specimens were donated by: North Carolina State Museum of Natural Sciences (A Bogan), The Illinois Natural History Survey (K Cummings), The Academy of Natural Sciences (D Graf), The Carnegie Museum of Natural History (T Pearce) and The Ohio State University Museum of Biological Diversity (GT Watters). We thank B Cochrane, T Levine, M Sei, R Seidel, Berg Lab members, and several anonymous reviewers for comments on earlier drafts of this manuscript. Funding was provided by the US Fish & Wildlife Service and facilitated by R Butler and S Oetker. Animals were collected with permits from the National Park Service (permit # SACN-2002-SCI-0005), State of Wisconsin (552), State of Minnesota (11247), and State of Missouri.
The authors declare no conflict of interest.
Footnotes
Supplementary Information accompanies this paper on the Heredity website (http://www.nature.com/hdy)
Supplementary Material
References
- April J, Hanner RH, Dion-Cote AM, Bernatchez L. Glacial cycles as an allopatric speciation pump in north-eastern American freshwater fishes. Mol Ecol. 2013;22:409–422. doi: 10.1111/mec.12116. [DOI] [PubMed] [Google Scholar]
- Avise JC. Harvard University Press: Cambridge, MA, USA; 2000. Phylogeography: the History and Formation of Species. [Google Scholar]
- Baird MS.2000Life History of the Spectaclecase,Cumberlandia monodontaSay, 1829 (Bivalvia, Unionoidae, Margaritiferidae). Master of Science thesis Southwest Missouri State University: Springfield, MO, USA [Google Scholar]
- Beerli P. Comparison of Bayesian and maximum-likelihood inference of population genetic parameters. Bioinformatics. 2006;22:341–345. doi: 10.1093/bioinformatics/bti803. [DOI] [PubMed] [Google Scholar]
- Berendzen PB, Simons AM, Wood RM. Phylogeography of the northern hogsucker, Hypentelium nigricans (Teleostei: Cypriniformes): genetic evidence for the existence of the ancient Teays River. J Biogeogr. 2003;30:1139–1152. [Google Scholar]
- Berg DJ, Cantonwine EG, Hoeh WR, Guttman SI. Genetic structure of Quadrula quadrula (Bivalvia: Unionidae): little variation across large distances. J Shellfish Res. 1998;17:1365–1373. [Google Scholar]
- Bernatchez L, Wilson CC. Comparative phylogeography of Nearctic and Palearctic fishes. Mol Ecol. 1998;7:431–452. [Google Scholar]
- Burdick RC, White MM. Phylogeography of the Wabash pigtoe, Fusconaia flava (Rafinesque, 1820) (Bivalvia: Unionidae) J Mollus Stud. 2007;73:367–375. [Google Scholar]
- Burr BM, Page LM.1986Zoogeography of fishes of the lower Ohio-upper Mississippi BasinIn: Hocutt CH, Wiley EO, (eds)The Zoogeography of North American Freshwater Fishes John Wiley and Sons: New York, NY, USA [Google Scholar]
- Butler RS.2002Status Assessment Report for the Spectaclecase,Cumberlandia monodonta,Occurring in the Mississippi River System The Ohio River Valley Ecosystem Team Mollusk Subgroup: Asheville, NC, USA [Google Scholar]
- Clement M, Posada D, Crandall KA. TCS: a computer program to estimate gene genealogies. Mol Ecol. 2000;9:1657–1659. doi: 10.1046/j.1365-294x.2000.01020.x. [DOI] [PubMed] [Google Scholar]
- Cornuet J-M, Santos F, Beaumont MA, Robert CP, Marin J-M, Balding DJ, et al. Inferring population history with DIY ABC: a user-friendly approach to approximate Baysian computation. Bioinformatics. 2008;24:2713–2719. doi: 10.1093/bioinformatics/btn514. [DOI] [PMC free article] [PubMed] [Google Scholar]
- Cornuet J-M, Ravigne V, Estoup A. Inference on population history and model checking using DNA sequence and microsatellite data with the software DIYABC (v1.0) BMC Bioinformatics. 2010;11:401. doi: 10.1186/1471-2105-11-401. [DOI] [PMC free article] [PubMed] [Google Scholar]
- Curole JP, Foltz DW, Brown KM. Extensive allozyme monomorphism in a threatened species of freshwater mussel, Margaritifera hembeli Conrad (Bivalvia: Margaritiferidae) Conserv Genet. 2004;5:271–278. [Google Scholar]
- Drummond AJ, Suchard MA, Xie D, Rambaut A. Bayesian phylogenetics with BEAUti and the BEAST 1.7. Mol Biol Evol. 2012;29:1969–1973. doi: 10.1093/molbev/mss075. [DOI] [PMC free article] [PubMed] [Google Scholar]
- Eackles MS, King TL. Isolation and characterization of microsatellite loci in Lampsilis abrupta (Bivalvia: Unionidae) and cross-species amplification within the genus. Mol Ecol Notes. 2002;2:559–562. [Google Scholar]
- Earl DA, vonHoldt BM. STRUCTURE HARVESTER: a website and program for visualizing STRUCTURE output and implementing the Evanno method. Conserv Genet Resour. 2012;4:359–361. [Google Scholar]
- Elderkin CL, Christian AD, Metcalfe-Smith JL, Berg DJ. Population genetics and phylogeography of freshwater mussels in North America, Elliptio dilatata and Actinonaias ligamentina (Bivalvia: Unionidae) Mol Ecol. 2008;17:2149–2163. doi: 10.1111/j.1365-294X.2008.03745.x. [DOI] [PubMed] [Google Scholar]
- Elderkin CL, Christian AD, Vaughn CC, Metcalfe-Smith JL, Berg DJ. Population genetics of the freshwater mussel, Amblema plicata (Say 1817) (Bivalvia: Unionidae): evidence of high dispersal and post-glacial colonization. Conserv Genet. 2007;8:355–372. [Google Scholar]
- Excoffier L, Lischer HE. Arlequin suite ver 3.5: a new series of programs to perform population genetics analyses under Linux and Windows. Mol Ecol Resour. 2010;10:564–567. doi: 10.1111/j.1755-0998.2010.02847.x. [DOI] [PubMed] [Google Scholar]
- Fetzner JW, Jr., Crandall KA. Linear habitats and the nested clade analysis: an empirical evaluation of geographic versus river distances using an Ozark crayfish (Decapoda: Cambaridae) Evolution. 2003;57:2101–2118. doi: 10.1111/j.0014-3820.2003.tb00388.x. [DOI] [PubMed] [Google Scholar]
- Gagnon MC, Angers B. The determinant role of temporary proglacial drainages on the genetic structure of fishes. Mol Ecol. 2006;15:1051–1065. doi: 10.1111/j.1365-294X.2005.02828.x. [DOI] [PubMed] [Google Scholar]
- Geist J, Kuehn R. Genetic diversity and differentiation of central European freshwater pearl mussel (Margaritifera margaritifera L.) populations: implications for conservation and management. Mol Ecol. 2005;14:425–439. doi: 10.1111/j.1365-294X.2004.02420.x. [DOI] [PubMed] [Google Scholar]
- Goldstein DB, Schlotterer C. Microsatellites: Evolution and Applications. Oxford University Press: Oxford, UK; 1999. [Google Scholar]
- Goudet J. FSTAT (version 1.2): a computer program to calculate F-statistics. J Hered. 1995;86:485–486. [Google Scholar]
- Graf DL, Cummings KS. Review of the systematics and global diversity of freshwater mussel species (Bivalvia: Unionoida) J Mollus Stud. 2007;73:291–314. [Google Scholar]
- Grobler JP, Jones JW, Johnson NA, Neves RJ, Hallerman EM. Homogeneity at nuclear microsatellite loci masks mitochondrial haplotype diversity in the endangered fanshell pearlymussel (Cyprogenia stegaria) J Hered. 2011;102:196–206. doi: 10.1093/jhered/esq120. [DOI] [PubMed] [Google Scholar]
- Haag WR. A hierarchical classification of freshwater mussel diversity in North America. J Biogeogr. 2009;37:12–26. [Google Scholar]
- Hewitt G. The genetic legacy of the Quanternary ice ages. Nature. 2000;405:907–913. doi: 10.1038/35016000. [DOI] [PubMed] [Google Scholar]
- Holleley CE, Geerts PG. Multiplex Manager 1.0: a cross-platform computer program that plans and optimizes multiplex PCR. Biotechniques. 2009;46:511–517. doi: 10.2144/000113156. [DOI] [PubMed] [Google Scholar]
- Huff SW, Campbell D, Gustafson RG, Lydeard C, Altaba CR, Giribet G. Investigations into the phylogenetic relationships of freshwater pearl mussels (Bivalvia: Margaritiferidae) based on molecular data: implications for their taxonomy and biogeography. J Mollus Stud. 2004;70:379–388. [Google Scholar]
- Inoue K, Moyer GR, Williams A, Monroe EM, Berg DJ. Isolation and characterization of 17 polymorphic microsatellite loci in the spectaclecase, Cumberlandia monodonta (Bivalvia: Margaritiferidae) Conserv Genet Resour. 2011;3:57–60. [Google Scholar]
- Jakobsson M, Rosenberg NA. CLUMPP: a cluster matching and permutation program for dealing with label switching and multimodality in analysis of population structure. Bioinformatics. 2007;23:1801–1806. doi: 10.1093/bioinformatics/btm233. [DOI] [PubMed] [Google Scholar]
- Lander TA, Oddou-Muratorio S, Prouillet-Leplat H, Klein EK. Reconstruction of a beech population bottleneck using archival demographic information and Bayesian analysis of genetic data. Mol Ecol. 2011;20:5182–5196. doi: 10.1111/j.1365-294X.2011.05356.x. [DOI] [PubMed] [Google Scholar]
- Lesica P, Allendorf FW. When are peripheral populations valuable for conservation. Conserv Biol. 1995;9:753–760. [Google Scholar]
- Lydeard C, Cowie RH, Ponder WF, Bogan AE, Bouchet P, Clark SA, et al. The global decline of nonmarine mollusks. Bioscience. 2004;54:321–330. [Google Scholar]
- Marko PB. Fossil calibration of molecular clocks and the divergece times of geminate species pairs separated by the Isthmus of Panama. Mol Biol Evol. 2002;19:2005–2021. doi: 10.1093/oxfordjournals.molbev.a004024. [DOI] [PubMed] [Google Scholar]
- Matschiner M, Salzburger W. TANDEM: integrating automated allele binning into genetics and genomics workflows. Bioinformatics. 2009;25:1982–1983. doi: 10.1093/bioinformatics/btp303. [DOI] [PubMed] [Google Scholar]
- Mayden RL. Biogeography of Ouachita highland fishes. Southwest Nat. 1985;30:195–211. [Google Scholar]
- Mayden RL. Vicariance biogeography, parsimony, and evolution in North American freshwater fishes. Syst Zool. 1988;37:329–355. [Google Scholar]
- Monroe EM. Population Genetics and Phylogeography of Two Large-River Freshwater Mussel Species at Large and Small Spatial Scales. Doctor of Philosophy Thesis. Miami University: Oxford, OH, USA; 2008. [Google Scholar]
- Near TJ, Page LM, Mayden RL. Intraspecific phylogeography of Percina evides (Percidae: Etheostomatinae): an additional test of the Central Highlands pre-Pleistocene vicariance hypothesis. Mol Ecol. 2001;10:2235–2240. doi: 10.1046/j.1365-294x.2001.01362.x. [DOI] [PubMed] [Google Scholar]
- Peakall R, Smouse PE. GENALEX 6: genetic analysis in Excel. Population genetic software for teaching and research. Mol Ecol Notes. 2006;6:288–295. doi: 10.1093/bioinformatics/bts460. [DOI] [PMC free article] [PubMed] [Google Scholar]
- Pritchard JK, Stephens M, Donnelly P. Inference of population structure using multilocus genetype data. Genetics. 2000;155:945–959. doi: 10.1093/genetics/155.2.945. [DOI] [PMC free article] [PubMed] [Google Scholar]
- Rambaut A, Drummond AJ.2009 ): http://tree.bio.ed.ac.uk/software/tracer/ .
- Roe KJ, Hartfield PD, Lydeard C. Phylogeographic analysis of the threatened and endangered superconglutinate-producing mussels of the genus Lampsilis (Bivalvia: Unionidae) Mol Ecol. 2001;10:2225–2234. doi: 10.1046/j.1365-294x.2001.01361.x. [DOI] [PubMed] [Google Scholar]
- Ronquist F, Teslenko M, van der Mark P, Ayres DL, Darling A, Höhna S, et al. MrBayes 3.2: efficient Bayesian phylogenetic inference and model choice across a large model space. Syst Biol. 2012;61:539–542. doi: 10.1093/sysbio/sys029. [DOI] [PMC free article] [PubMed] [Google Scholar]
- Rosenberg NA. DISTRUCT: a program for the graphical display of population structure. Mol Ecol Notes. 2004;4:137–138. [Google Scholar]
- Rousset F. GENEPOP'007: a complete re-implementation of the GENEPOP software for Windows and Linux. Mol Ecol Resour. 2008;8:103–106. doi: 10.1111/j.1471-8286.2007.01931.x. [DOI] [PubMed] [Google Scholar]
- Schwalb AN, Morris TJ, Mandrak NE, Cottenie K. Distribution of unionid freshwater mussels depends on the distribution of host fishes on a regional scale. Divers Distrib. 2013;19:446–454. [Google Scholar]
- Smith CI. Historical biogeography: the new synthesis. Curr Biol. 2007;17:R598–R600. doi: 10.1016/j.cub.2007.05.063. [DOI] [PubMed] [Google Scholar]
- Strange RM, Burr BM. Intraspecific phylogeography of North American highland fishes: a test of the Pleistocene vicariance hypothesis. Evolution. 1997;51:885–897. doi: 10.1111/j.1558-5646.1997.tb03670.x. [DOI] [PubMed] [Google Scholar]
- Tanabe AS. Kakusan4 and Aminosan: two programs for comparing nonpartitioned, proportional and separate models for combined molecular phylogenetic analyses of multilocus sequence data. Mol Ecol Resour. 2011;11:914–921. doi: 10.1111/j.1755-0998.2011.03021.x. [DOI] [PubMed] [Google Scholar]
- van Oosterhout C, Hutchinson WF, Wills DPM, Shipley P. Micro-Checker: software for identifying and correcting genotyping errors in microsatellite data. Mol Ecol Notes. 2004;4:535–538. [Google Scholar]
- Wiley EO, Mayden RL. Speciation in phylogenetic systematics, with examples from the North American fish fauna. Ann Missouri Bot Gard. 1985;72:596–635. [Google Scholar]
- Zanatta DT, Murphy RW. The phylogeographical and management implications of genetic population structure in the imperiled snuffbox mussel, Epioblasma triquetra (Bivalvia: Unionidae) Biol J Linnean Soc. 2008;94:371–384. [Google Scholar]
Associated Data
This section collects any data citations, data availability statements, or supplementary materials included in this article.