Abstract
Purpose.
To evaluate early diabetes-induced changes in retinal thickness and microvasculature in a type 2 diabetic mouse model by using optical coherence tomography (OCT)/optical microangiography (OMAG).
Methods.
Twenty-two-week-old obese (OB) BTBR mice (n = 10) and wild-type (WT) control mice (n = 10) were imaged. Three-dimensional (3D) data volumes were captured with spectral domain OCT using an ultrahigh-sensitive OMAG scanning protocol for 3D volumetric angiography of the retina and dense A-scan protocol for measurement of the total retinal blood flow (RBF) rate. The thicknesses of the nerve fiber layer (NFL) and that of the NFL to the inner plexiform layer (IPL) were measured and compared between OB and WT mice. The linear capillary densities within intermediate and deep capillary layers were determined by the number of capillaries crossing a 500-μm line. The RBF rate was evaluated using an en face Doppler approach. These quantitative measurements were compared between OB and WT mice.
Results.
The retinal thickness of the NFL to IPL was significantly reduced in OB mice (P < 0.01) compared to that in WT mice, whereas the NFL thickness between the two was unchanged. 3D depth-resolved OMAG angiography revealed the first in vivo 3D model of mouse retinal microcirculation. Although no obvious differences in capillary vessel densities of the intermediate and deep capillary layers were detected between normal and OB mice, the total RBF rate was significantly lower (P < 0.05) in OB mice than in WT mice.
Conclusions.
We conclude that OB BTBR mice have significantly reduced NFL–IPL thicknesses and total RBF rates compared with those of WT mice, as imaged by OCT/OMAG. OMAG provides an unprecedented capability for high-resolution depth-resolved imaging of mouse retinal vessels and blood flow that may play a pivotal role in providing a noninvasive method for detecting early microvascular changes in patients with diabetic retinopathy.
Keywords: obesity, optical coherence tomography, retinal microcirculation, retinal vasculature
Optical microangiography provides an unprecedented capability for high-resolution depth-resolved imaging of mouse retinal vessels and blood flow that may play a pivotal role in providing a noninvasive method for detecting early microvascular changes in patients with diabetic retinopathy.
Introduction
Diabetic retinopathy (DR) is the most common microvascular complication of diabetes and is one of the leading causes of blindness worldwide.1 DR can be divided into 2 stages: nonproliferative and proliferative. The earliest visible signs of nonproliferative DR are microaneurysms and retinal hemorrhages. Prolonged hyperglycemia can lead to severe pathologic changes in the retina, leading to proliferative retinopathy with retinal neovascularization and diabetic macular edema. Early diagnosis and prevention of retinopathy in diabetic patients is crucial for preventing vision loss.2 A noninvasive imaging technique with the capability of detecting early changes in DR, such as retinal structural and microvascular alterations, would be critical.
Optical coherence tomography (OCT) is a noncontact, noninvasive imaging modality that has been widely used for human retinal imaging.3 Functional OCT can provide important clinical information that is not available in the typical intensity-based structural OCT images. Doppler OCT and OCT angiography have attracted increased attention in the clinical community because of their utility in studying functional changes in microvascular pathology in vivo. Phase-resolved Doppler OCT (PRDOCT)4,5 has been applied to quantify blood flow in human retina.6,7 On the other hand, in order to visualize the microcirculation network, a number of technological strategies have recently emerged that provide improved imaging contrast for microvasculature components (eg, OCT angiography). Optical microangiography (OMAG)8 is one of the earliest OCT angiography methods, capable of generating three-dimensional (3D) images of dynamic blood perfusion distribution within microcirculatory tissue beds in vivo. Most recently, OMAG has been extended to ultrahigh-sensitive OMAG (UHS-OMAG)9 that dramatically improves the detection sensitivity to slower blood flow velocities to a level that enables the imaging of true capillaries within the scanned tissue volume. We have demonstrated its capability for volumetric imaging of retinal vasculature and quantitative measurement of retinal blood flow (RBF) in rats10,11 and mice.12
Because most structural, functional, and biochemical studies cannot be carried out in human subjects, animal models are essential for studying DR pathology and for developing new and better therapeutic strategies to treat human diseases.13 Mouse models of DR have proven useful for studying DR and evaluating novel therapies due to their amenability to genetic manipulation.14–18 Type 2 diabetes mellitus is a progressive disease that generally has an onset in adulthood and accounts for over 90% of all diabetes cases. A recently developed mouse strain, BTBR, which carries the ob/ob leptin-deficiency mutation, develops type 2 diabetes, hypercholesterolemia, elevated triglycerides, and insulin resistance.19–23
The purpose of this study was to investigate the early signs of DR, including retinal thickness, microvasculature changes, and total RBF change in a diabetic mouse model of type 2 diabetes and obesity using the OCT/OMAG system. As shown in our results, the retinal thickness measured from the nerve fiber layer (NFL) to the inner plexiform layer (IPL) and the total RBF were significantly lower in obese (OB) mice, whereas there was no obvious alteration in the retinal capillary density.
Materials and Methods
Animal Model
Twenty-two-week-old female BTBR ob/ob leptin-deficient obese (OB) mice (n = 10) and BTBR wild-type (WT) control mice (n = 10), bred at the University of Washington as previously described,19 were used in this study. BTBR ob/ob mice develop type 2 diabetes19 and several diabetic complications including morphologically advanced nephropathy and cardiomyopathy. It is not yet known whether these mice are capable of developing a robust, advanced proliferative retinopathy resembling morphologically advanced DR. The BTBR ob/ob mice used here weighed an average of 63.9 ± 2.2 g and had elevated serum glucose levels that exceeded 600 mg/dL. In comparison, control WT mice had an average weight of 32.6 ± 1.4 g and serum glucose levels of 242 ± 27 mg/dL. The average systolic blood pressure of BTBR ob/ob mice was 120.3 ± 9.2 mm Hg and diastolic blood pressure was 83.7 ± 6.4 mm Hg. Although the average systolic blood pressure of WT mice was 89.8 ± 4.2 mm Hg and diastolic blood pressure was 66.6 ± 3.6 mm Hg, both the average systolic and diastolic blood pressure of BTBR ob/ob mice are significantly (P < 0.05) higher than those of WT mice, indicating that BTBR ob/ob mice are hypertensive compared to WT. The measured axial eye length for the WT and OB mice were 3.624 ± 0.121 mm (n = 10) and 3.591 ± 0.147 (n = 10), respectively. There were no significant differences between them. All animals were treated in accordance with the Association for Research in Vision and Ophthalmology statement for the Use of Animals in Ophthalmic and Vision Research, and the animal protocol was approved by the Animal Care and Use Committee at University of Washington.
Optical Coherence Tomography/Optical Microangiography System
A spectral-domain OCT-based OMAG system was used in this study to acquire in vivo 3D datasets of retinal microstructure and microvasculature. The system has been previously described in detail.12 Here we briefly provide some key parameters that specifically determined the system performance for mouse eye imaging. The system was operated at a central wavelength of 840 nm with a spectral bandwidth of 42 nm, providing an axial resolution of approximately 7.2 μm in air. The detector used was a high-speed CMOS line scan camera (spL2048-140 km; Basler Sprint, Ahrensburg, Germany), having 10-μm square pixels in 2 rows and 2048 pixels wide. In order to increase the camera speed, only 896 pixels were illuminated, and the camera was read at an exposure time of 5.7 μseconds, which provided a line scan rate of 140 kHz (ie, 140,000 A-scans per second). In the sample arm, we applied an ocular lens (Maxlight standard 90D; Ocular Instrument) that enabled both a large field of view (∼2 × 2 mm2) and an acceptable lateral resolution (∼10 μm) of the mouse retina.
Image Acquisition and Processing
Mice were anesthetized with inhaled isoflurane (1.5%) mixed with 80% air and 20% oxygen and positioned in a custom-made head holder, and the right eye was prepared for OCT/OMAG imaging. The pupil was dilated with eye drops (10% phenylephrine hydrochloride ophthalmic solution, USP; AK-Dilate). 3D data volumes covering the optic nerve head (ONH) area (∼2 × 2 mm2) were first captured using the UHS-OMAG scanning protocol,24 in which the raster scanning of the beam spot was performed to capture 512 A-lines within each B-frame (2D cross-sectional image) and 2000 B-frames for each C-scan (3D image). These 2000 B-frames were captured at 400 cross-sections with 5 repeated B-frames captured at each cross-section position. Using a frame rate of 220 frames per second (fps), we were able to obtain a single 3D data volume in approximately 7 seconds. We then captured another 3D dataset (using 2048 A-lines per B-frame and a frame rate of 35 fps) covering a region of ∼1 × 1 mm2 around the ONH for PRDOCT analysis to determine the axial blood flow velocity in retinal arteries and veins.12 During the procedure, the position of the mice was unchanged, and the eye movement was minimal.
3D OMAG data were postprocessed using the UHS-OMAG algorithm,9,10 (ie, high-pass filtering along the C-scan direction to extract the blood flow signal from the background tissue). At each cross-section, the phase-compensated complex signals of adjacent B-frames were subtracted and then averaged (4 times) to obtain the cross-sectional structural image (Fig. 1A) and its corresponding blood flow image (Fig. 1C). This was applied in all of the 400 cross-sections to generate concurrent 3D structural and blood flow movies. The 3D retinal structure and microvascular network were rendered using Amira 3D software (Visage Imaging, Inc.). An example of the maximum intensity projection map of the retinal microvasculature in a typical mouse is shown in Figure 1D.
Figure 1.
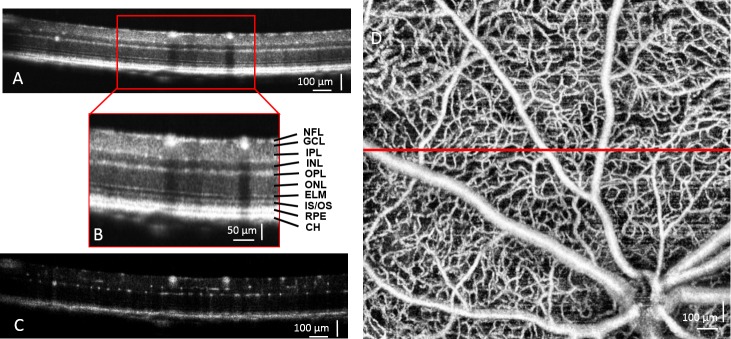
Ultrahigh-resolution OCT/OMAG images from a normal WT BTBR mouse are shown. Cross-sectional OCT structural image of the retina (A) and higher magnification (B, inset) demonstrate the resolved retinal and choroidal layers. CH, choroid; ELM, external limiting membrane; GCL, ganglion cell layer; INL, inner nuclear layer; IPL, inner plexiform layer; IS/OS, junction between the inner and outer segment of the photoreceptors; NFL, nerve fiber layer; ONL, outer nuclear layer; OPL, outer plexiform layer; RPE, retinal pigment epithelium layer. (C) Corresponding cross-sectional blood flow image was obtained by comparing the 5 repeated B frames captured at the same cross-section. (D) Maximum intensity projection map shows mouse retinal microvasculature, generated by OMAG. The red line indicates where the cross-section is shown in (A).
Retinal Segmentation and Thickness Measurement
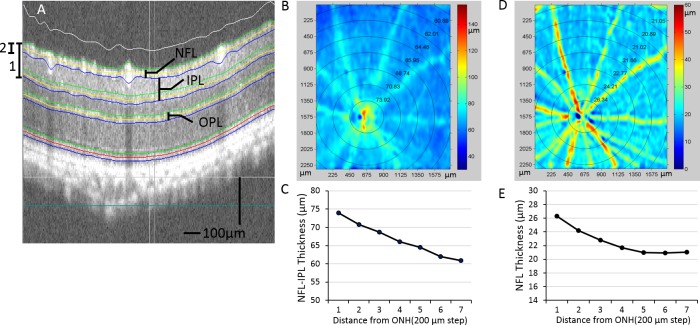
A semiautomated retinal layer segmentation algorithm developed by our research group was used to segment individual retinal layers from the OCT cross-sectional structural images based on intensity difference (Fig. 2A). This was conducted with the entire 3D data volume. After segmentation, the thickness of the NFL (Fig. 2B) and the thickness from the NFL to the IPL (in short, NFL–IPL) (Fig. 2C) were calculated. These results were captured from a BTBR WT mouse. As seen from the thickness map (Fig. 2), the thickness of the measured retinal layers decreases with distance away from the ONH, consistent with what has been previously reported.25 We report the retinal thickness in each of the concentric circles according to the distance from the center of the ONH (Figs. 2D, 2E). For each retina, the mean thickness (MT) is calculated as the average thickness of the whole scanned area.
Figure 2.
Retinal layer segmentation and thickness measurements are shown. (A) OCT images from the 3D OCT data set are segmented, and interfaces are identified by the center line (yellow) and boundaries (green and blue). (B) Pseudocolor image of NFL–IPL thickness (A, 1) from an OB mouse. Mean thicknesses within the concentric regions of varying distances from ONH are shown on top of the thickness map and plotted in (C). (D) Pseudocolor image is shown of NFL thickness (A, 2). Similarly, the MTes within the circular region are shown on top and plotted in (E).
Measurement of Retinal Capillary Density
Retinal capillary dropout is a hallmark of both early and late DR. Hence, the ability to quantify retinal capillary density can potentially be an important early indicator in the evaluation of diabetes-induced changes. We quantified capillary density in the IPL and outer plexiform layer (OPL) by measuring the number of capillaries intersected by a 500-μm straight line.26 For each retina, 12 locations were chosen for the measurements according to the distance and angle to the ONH. Twelve measurements of capillary densities were averaged for the IPL and OPL capillaries in 10 WT and 10 OB mice.
Measurement of Total Retinal Blood Flow Rate
Total RBF rate measurements were performed using the elegant en face Doppler method demonstrated by Srinivasan et al.27 We have also described the approach for the measurement of total blood flow rate in mouse retina in detail.12 Briefly, axial flow velocity within a 3D volume around the ONH was measured. Then, by reorienting the velocity map into an en face view, an en face plane could be chosen that bisected all of the retinal arteries and veins. By integrating the axial flow components over the vessel cross-sections, the total RBF could be obtained without knowing the Doppler angle. Total RBF was computed by adding together either the arterial or venous flow. We computed the total RBF as the average of arterial and venous flow in the right eyes of 10 WT and 10 OB mice.
Statistical Analysis
Data are means ± SE. Differences in retinal layer thicknesses, capillary densities, and total RBF rates between WT and OB mice were analyzed using Student t-test by determining the P value, where it was assumed that the sample populations were normally distributed. The criterion for statistical significance was P < 0.05.
Results
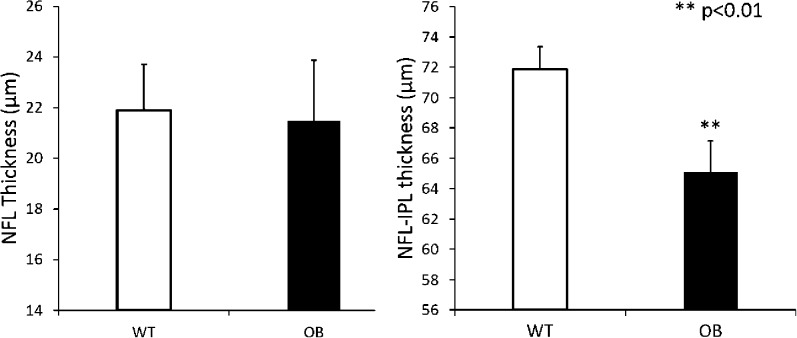
Retinal thickness measurements were performed after layer segmentation of the retinal structural images. The MTs of the NFL and NFL–IPL layers in WT control mice (n = 10) and diabetic OB mice (n = 10) are presented in Figure 3. The WT control mice had a mean NFL thickness of 21.9 ± 1.8 μm, and the diabetic OB mice had an MT of 21.5 ± 2.4 μm. There was no statistical difference observed between these 2 groups. However, the MT of the NFL–IPL thickness in diabetic OB mice was significantly lower (65.1 ± 2.1 μm; P <0.01) than that of the WT control mice (71.9 ± 1.5 μm). Thickness from the OPL to RPE was also measured, and no significant differences were found between the 2 groups (data not shown).
Figure 3.
Decrease in NFL–IPL thickness in OB mouse retinas are compared to those in WT mouse retinas. Left: Mean thicknesses of NFL in WT control mice (n = 10) and diabetic OB mice (n = 10) are shown. No statistical differences were observed between the two groups. Right: Mean thicknesses of NFL–IPL in WT control mice (n = 10) and diabetic OB mice (n = 10) are shown, with the NFL–IPL thickness measured from the retinal surface to the posterior limit of the IPL layer. **P < 0.01 between the two groups. Data are means ± SE.
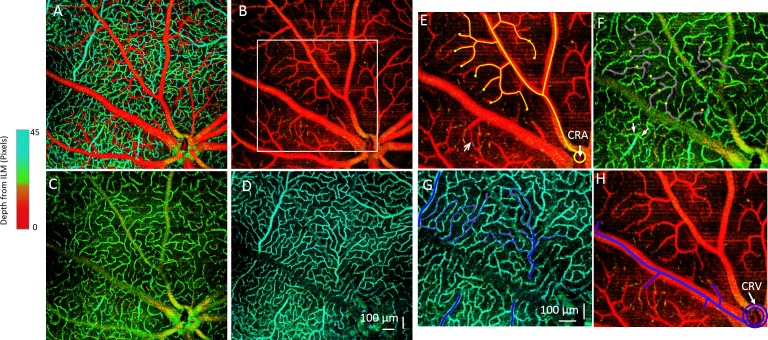
The OMAG imaging technique can provide depth-resolved imaging (Fig. 4A) of the microvasculature in the mouse retina with a large field of view. In the holangiotic retina, there are, schematically speaking, 3 layers of microvessels: a superficial microvessel network in the ganglion cell layer, an intermediate capillary network in the IPL, and a deep microvessel network in the outer plexiform layer.28 Hence, we segmented the vasculature into these 3 different layers based on the architecture of the murine retinal microvascular network (Figs. 4B–4D). With this high-resolution and depth-resolved microvasculature map, we were able to track the blood flow path through the three retinal layers (Figs. 4E–4H). As we know, the blood flow in outer retinal layers is supplied by the central retinal artery, which usually divides into 4–6 major arteriolar branches. Each major arteriolar branch will then separate into small precapillary arterioles (Fig. 4E). Notably, the superficial layer is predominantly precapillary arterioles (Fig. 4E), which then dive into the intermediate layer. After an asymmetric cross path in the IPL as intermediate capillaries, they either dive into the OPL to form the deep microvessels or join the venules directly (Fig. 4F). The venous-end capillary flow in the deep layer of OPL is then collected by postcapillary venules (Fig. 4G), which finally join with major venules in the superficial layer. From our images, we can see that these postcapillary venules may be connected to the major venules either directly or by passing through the intermediate layer. Finally, all of the blood flow returns to the central retinal vein (Fig. 4H). To the best of our knowledge, this is the first time that the murine capillary network has been imaged in such 3D structural detail in an in vivo and noninvasive method. With this capability, we expect to be able to detect retinal microvascular changes in the diabetic OB mice and make comparisons to WT mice.
Figure 4.
Depth-resolved retinal microvascular network and 3D tracking of the microvessels are shown. (A) Depth-coded color angiography of the whole mouse retina is shown. (B–D) Microvascular networks are shown within 3 different layers: (B) GCL, (C) IPL, and (D) OPL. The microvascular organization within the 3 layers has distinct patterns. (E–H) Tracking of the microvessel paths of an arteriole and venule is demarcated in the white rectangular region in (B). (E) In the superficial microvessels of the GCL, the blood flows through arterioles branched from the central retinal artery (CRA), shown as the yellow lines. The yellow dots denote where the vessels dive to a separate layer. The arrow points to a direct arteriovenular connection in the superficial GCL layer. (F) An intermediate capillary layer in the IPL is shown. Yellow dots indicate the vessels that are diving to this layer from the superficial layer in (E). These capillaries flow as pink lines and then dive into a deeper layer at the pink dots. Arrows point to capillaries joining the postcapillary venules. (G) Deep-layer microvessel in OPL is shown, in which the pink dots from IPL indicate diving vessels and blue lines indicate flow. All of the blood flow will then be collected by the postcapillary venules and returned to the superficial layer and to the major venules (H), which will join the central retinal vein (CRV).
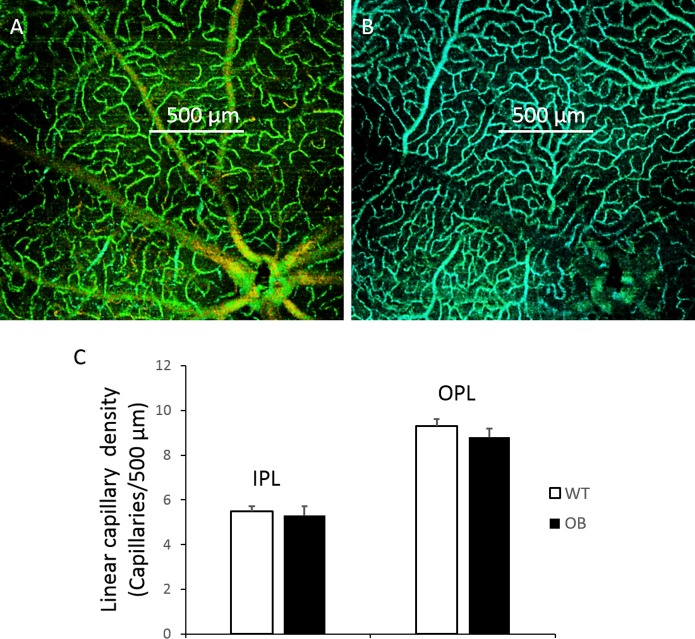
In order to quantitatively compare the capillary vessel densities of WT controls with those of diabetic OB mice, we measured the linear capillary density by determining the number of capillaries crossed by a 500-μm line (Figs. 5A, 5B). For each retina, we randomly chose 12 counts and averaged them to obtain the mean value. The linear capillary density in the IPL is usually less dense than the deep capillaries in the OPL. No statistical differences were found between the WT control mice (n = 10) and diabetic OB mice (n = 10) for both capillary density in either the IPL or OPL (Fig. 5C).
Figure 5.
Determination of retinal capillary density in WT and OB mouse retinas is shown. Measurement of linear capillary density was determined by the number of capillaries crossing a 500-μm line in the intermediate capillary layer (A) and deep layer (B). (C) Linear capillary densities in WT control mice (n = 10) and diabetic OB mice (n = 10) are shown. No statistical differences were found between the 2 groups. Data are means ± SE.
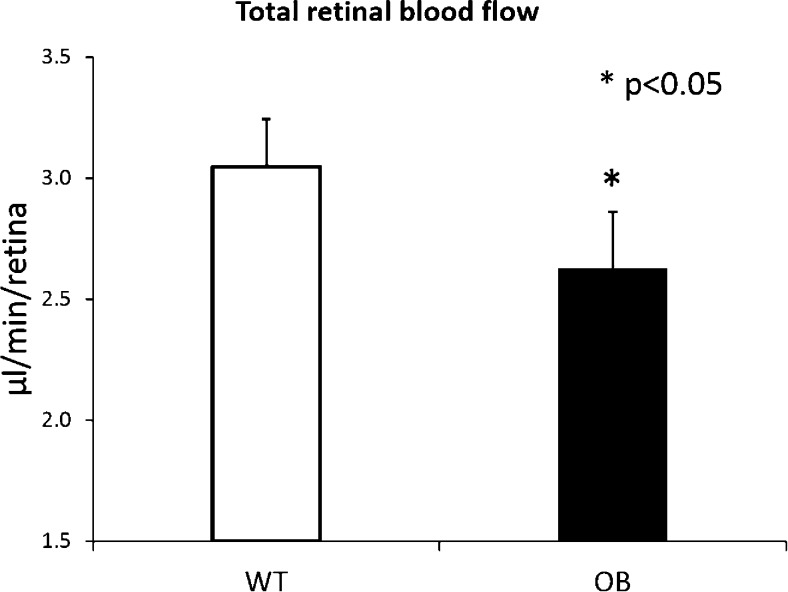
We next measured the total RBF in all the mice by using the en face Doppler approach.12 Interestingly, although the capillary densities were unchanged between the 2 groups, we found that the total RBF in the diabetic OB mice (n = 10) was significantly lower than that in normal WT mice (n = 10) (Fig. 6). The mean total RBF rate in WT mice was 3.05 ± 0.20 μL/min, whereas the RBF rate in diabetic OB mice was 2.63 ± 0.23 μL/min, which is 13% lower (P < 0.05).
Figure 6.
Decrease in total RBF in OB mouse retinas is compared to that in WT. Mean total RBF rates (μL/min/retina) are shown in WT control mice (n = 10) and diabetic OB mice (n = 10). *P < 0.05 indicates significant differences between the two groups. Data are means ± SE.
Discussion
In this study, we applied OCT and its functional modality, OMAG, to noninvasively obtain 3D imaging of the murine retinal microstructure and microvasculature. The purpose was to investigate early diabetes-induced alterations in the retinal structure and microvasculature by using an OB diabetic mouse model. Our results suggest that there is a significant change in both retinal thickness and total RBF rate in the diabetic OB retinas, whereas the retinal capillary density did not show any significant change compared to that in the WT retinas in our imaging system.
Although the retinal thickness of the NFL–IPL was significantly thinner in diabetic OB mice than in WT controls, the NFL thickness remained unchanged as detected by our current OCT/OMAG system. There is reason to suspect that ganglion cell loss may responsible for the reduction in NFL–IPL thickness in diabetic mice.29,30 Krady et al.31 reported that spontaneous development of diabetes in Ins2Akita mice (a model of type 1 diabetes) resulted in a 23.4% reduction in the number of cell bodies in the GCL after 22 weeks of hyperglycemia. The effect of diabetes on retinal ganglion cells has also been studied in the spontaneously diabetic KKAY strain (a model of type 2 diabetes) where Ning et al.32 demonstrated apoptosis of retinal ganglion cells by using TUNEL staining in whole retinas. Our OCT/OMAG imaging results are consistent with those findings and perhaps provide a mechanism for imaging ganglion cell layer thinning (and other potential diabetes-induced microstructural changes) over time in a noninvasive in vivo manner.
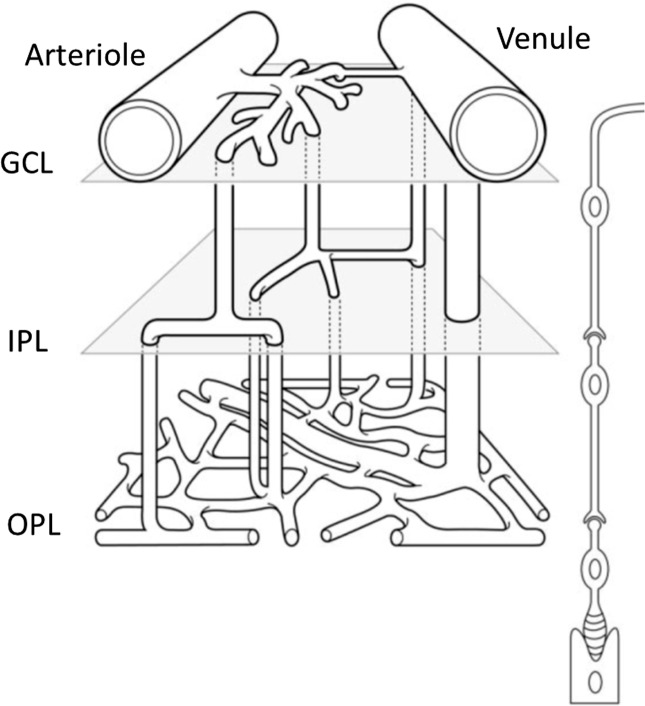
It has been commonly reported that 3 layers of microvessels are present in the mouse retina, with predominantly precapillary arterioles in the superficial layer and postcapillary venules in the deep layer. Paque et al.33 proposed a schema of the microvessel array between an arteriovenous couple (Fig. 7) based on their observation from ex vivo confocal imaging. They clearly identified the intermediate layer as asymmetrical crossroads for capillary blood flow. In this study, we confirmed this schema of mouse retinal microvascular organization by using our 3D depth-resolved OMAG imaging in living animals in their physiological state. Compared to confocal imaging or multiphoton microscopy of mouse retina, the biggest advantage of OMAG is its noninvasiveness and in vivo imaging capability. Another advantage of OMAG is its large field of view. Although we did not observe any differences in the capillary vessel organization between WT control and diabetic OB mice in this study, we anticipate that this may be due to the fact that OB mice are still in the early stage of diabetes with no observable morphological change occurring in the capillary bed. However, a system capable of detecting retinal microvasculature changes noninvasively in vivo would be particularly useful for studying DR in human patients. Tam et al.34 reported that there is disruption of the retinal parafoveal capillary network in type 2 diabetes before the onset of DR, based on the use of adaptive optics scanning laser ophthalmoscopy. As such, the OMAG system, which has been successfully applied for imaging of human retinal microvasculature35 can potentially be used for screening patients suspected of having diabetes. In addition, OMAG imaging would allow for longitudinal monitoring of progressive diabetic microvascular changes, including detection of early microaneurysms and perhaps even early detection of neovascular changes.
Figure 7.
Schema shows the microvessel array between an arteriovenous couple. GCL, ganglion cell layer; IPL, inner plexiform layer; OPL, outer plexiform layer. Reprinted with permission from Paques M, Tadayoni R, Sercombe R, et al. Structural and hemodynamic analysis of the mouse retinal microcirculation. Invest Ophthalmol Vis Sci. 2003;44:4960–4967.33
Measurement of the total RBF rate was achieved using the phase-resolved en face Doppler approach. This method has been successfully applied for measuring pulsatile total RBF in both human and rat eyes,36,37 although in this study, we did not take into account RBF pulsatility because our goal was to measure the averaged total RBF rate. By integrating the axial velocity over the vessel cross-section in the en face plane, both the systolic and diastolic flow rates were included, thus eliminating the pulsatility effect. Finally, the total RBF rates described in this paper are the averages of arterial and venous flow rates, which make the measurements less reflective of motion and pulsatility artifacts.
Although there were no differences in the densities of the retinal capillaries, interestingly, there was a significant measurable decrease in the total RBF in the OB retinas in comparison to those in WT retinas. These results are consistent with previous studies that show that there is a reduction in RBF in diabetic rat and mouse models.38–40 It has also been reported that RBF measured by using laser Doppler velocimetry was decreased in early stage of DR in patients with type 141 and type 242 diabetes. However, there is still controversy about whether the total RBF increases or decreases in diabetic patients. The reduction in RBF is usually seen in the earlier stages of diabetes, which may result in a reduction of nutrient delivery to the retinal tissue that may contribute to the resultant development of microvascular changes. However, the increases in RBF are usually seen in the later stages of DR development.38 OMAG's capability in performing long term in vivo monitoring of RBF changes may help better elucidate these pathological changes.
A recent study by Harris et al.26 reported similar findings, where they found that diabetes-induced RBF is decreased in the STZ-induced diabetic rat, whereas there was no reduction in linear capillary density. By infusing fluorescently-labeled red blood cells (RBCs) into the mouse retina, they compared the number of fluorescent RBCs in the intermediate and deep capillary layers versus the RBCs in the superficial branches of the primary arterioles and found that in the diabetic rat, the number of fluorescent RBCs in the inner and deep capillary layers was lower than those in the normal control. This indicates that a lower fraction of the RBF passes through the inner and deep capillaries, with a higher than normal fraction of blood flowing through superficial arteriovenular pathways for diabetic rat. This explanation could be applicable to our observations in the OB diabetic mice as well. We also hypothesize that the capillary flux (ie, the number of blood cells flowing through the capillary beds per unit of time) is reduced due to hyperglycemia in diabetic mice. Hyperglycemia can increase the viscosity of blood, which may in turn reduce capillary velocity as well as the blood flux. In order to validate this hypothesis, we are now working on developing a method to measure capillary flux based on the OMAG technique.
Acknowledgments
Supported by National Institutes of Health Diabetes Complication Consortium through a pilot project, by NIH research Grants HL093140, EB009682, EY010145, and DK 83391, by unrestricted funds from Research to Prevent Blindness, Inc., and by a Samuel and Althea Stroum Endowed Diabetes Fellowship Award from UW Diabetes Research Center. Ruikang K. Wang is a recipient of Research to Prevent Blindness Innovative Ophthalmic Research Award.
Disclosure: Z. Zhi, None; J.R. Chao, None; T. Wietecha, None; K.L. Hudkins, None; C.E. Alpers, None; R.K. Wang, P
References
- 1. Antonetti DA, Barber AJ, Bronson SK, et al. Diabetic retinopathy—seeing beyond glucose-induced microvascular disease. Diabetes. 2006; 55: 2401–2411 [DOI] [PubMed] [Google Scholar]
- 2. Cheung N, Mitchell P, Wong TY. Diabetic retinopathy. Lancet. 2010; 376: 124–136 [DOI] [PubMed] [Google Scholar]
- 3. Huang D, Swanson EA, Lin CP, et al. Optical coherence tomography. Science. 1991; 254: 1178–1181 [DOI] [PMC free article] [PubMed] [Google Scholar]
- 4. Chen Z, Milner TE, Srinivas S, et al. Noninvasive imaging of in vivo blood flow velocity using optical Doppler tomography. Opt Lett. 1997; 22: 1119–1121 [DOI] [PubMed] [Google Scholar]
- 5. Zhao Y, Chen Z, Ding Z, Ren H, Nelson JS. Real-time phase-resolved functional optical coherence tomography by use of optical Hilbert transformation. Opt Lett. 2002; 27: 98–100 [DOI] [PubMed] [Google Scholar]
- 6. Wang Y, Fawzi A, Tan O, Gil-Flamer J, Huang D. Retinal blood flow detection in diabetic patients by Doppler Fourier domain optical coherence tomography. Opt Express. 2009; 17: 4061–4073 [DOI] [PMC free article] [PubMed] [Google Scholar]
- 7. Wang Y, Fawzi AA, Varma R, et al. Pilot study of optical coherence tomography measurement of retinal blood flow in retinal and optic nerve diseases. Invest Ophthalmol Vis Sci. 2011; 52: 840–845 [DOI] [PMC free article] [PubMed] [Google Scholar]
- 8. Wang RK, Jacques SL, Ma Z, Hurst S, Hanson SR, Gruber A. Three dimensional optical angiography. Opt Express. 2007; 15: 4083–4097 [DOI] [PubMed] [Google Scholar]
- 9. An L, Qin J, Wang RK. Ultrahigh sensitive optical microangiography for in vivo imaging of microcirculations within human skin tissue beds. Opt Express. 2010; 18: 8220–8228 [DOI] [PMC free article] [PubMed] [Google Scholar]
- 10. Zhi Z, Cepurna W, Johnson E, Shen T, Morrison J, Wang RK. Volumetric and quantitative imaging of retinal blood flow in rats with optical microangiography. Biomed Opt Express. 2011; 2: 579–591 [DOI] [PMC free article] [PubMed] [Google Scholar]
- 11. Zhi Z, Cepurna WO, Johnson EC, Morrison JC, Wang RK. Impact of intraocular pressure on changes of blood flow in the retina, choroid, and optic nerve head in rats investigated by optical microangiography. Biomed Opt Express. 2012; 3: 2220–2233 [DOI] [PMC free article] [PubMed] [Google Scholar]
- 12. Zhi Z, Yin X, Dziennis S, et al. Optical microangiography of retina and choroid and measurement of total retinal blood flow in mice. Biomed Opt Express. 2012; 3: 2976 [DOI] [PMC free article] [PubMed] [Google Scholar]
- 13. Robinson R, Barathi VA, Chaurasia SS, Wong TY, Kern TS. Update on animal models of diabetic retinopathy: from molecular approaches to mice and higher mammals. Dis Model Mech. 2012; 5: 444–456 [DOI] [PMC free article] [PubMed] [Google Scholar]
- 14. Barber AJ, Antonetti DA, Reiter CEN, Stiller CA, Gardner TW, Bronson SK. The Ins2(Akita) mouse as a model of diabetic retinopathy. Invest Ophthalmol Vis Sci. 2004; 45: U92–U92 [Google Scholar]
- 15. Feit-Leichman RA, Kinouchi R, Takeda M, et al. Vascular damage in a mouse model of diabetic retinopathy: Relation to neuronal and glial changes. Invest Ophthalmol Vis Sci. 2005; 46: 4281–4287 [DOI] [PubMed] [Google Scholar]
- 16. Feit R, Kinouchi R, Kern TS, Chen DF. Using C57BL/6J as a mouse model for diabetic retinopathy. Invest Ophthalmol Vis Sci. 2004; 45: U93–U93 [Google Scholar]
- 17. Kern TS, Engerman RL. A mouse model of diabetic retinopathy. Arch Ophthalmol. 1996; 114: 986–990 [DOI] [PubMed] [Google Scholar]
- 18. Li QH, Verma A, Han PY, et al. Diabetic eNOS-knockout mice develop accelerated retinopathy. Invest Ophthalmol Vis Sci. 2010; 51: 5240–5246 [DOI] [PMC free article] [PubMed] [Google Scholar]
- 19. Hudkins KL, Pichaiwong W, Wietecha T, et al. BTBR Ob/Ob mutant mice model progressive diabetic nephropathy. J Am Soc Nephrol. 2010; 21: 1533–1542 [DOI] [PMC free article] [PubMed] [Google Scholar]
- 20. Clee SM, Attie AD. The genetic landscape of type 2 diabetes in mice. Endocr Rev. 2007; 28: 48–83 [DOI] [PubMed] [Google Scholar]
- 21. Clee SM, Nadler ST, Attie AD. Genetic and genomic studies of the BTBR ob/ob mouse model of type 2 diabetes. Am J Ther. 2005; 12: 491–498 [DOI] [PubMed] [Google Scholar]
- 22. Ranheim T, Dumke C, Schueler KL, Cartee GD, Attie AD. Interaction between BTBR and C57BL/6J genomes produces an insulin resistance syndrome in (BTBR x C57BL/6J) F-1 mice. Arterioscler Thromb Vasc Biol. 1997; 17: 3286–3293 [DOI] [PubMed] [Google Scholar]
- 23. Clee SM, Yandell BS, Schueler KM, et al. Positional cloning of Sorcs1, a type 2 diabetes quantitative trait locus. Nat Genet. 2006; 38: 688–693 [DOI] [PubMed] [Google Scholar]
- 24. Zhi Z, Jung Y, Jia Y, An L, Wang RK. Highly sensitive imaging of renal microcirculation in vivo using ultrahigh sensitive optical microangiography. Biomed Opt Express. 2011; 2: 1059–1068 [DOI] [PMC free article] [PubMed] [Google Scholar]
- 25. Srinivasan VJ, Ko TH, Wojtkowski M, et al. Noninvasive volumetric Imaging and morphometry of the rodent retina with high-speed, ultrahigh-resolution optical coherence tomography. Invest Ophthalmol Vis Sci. 2006; 47: 5522–5528 [DOI] [PMC free article] [PubMed] [Google Scholar]
- 26. Leskova W, Watts MN, Carter PR, Eshaq RS, Harris NR. Measurement of retinal blood flow rate in diabetic rats: disparity between techniques due to redistribution of flow. Invest Ophthalmol Vis Sci. 2013; 54: 2992–2999 [DOI] [PMC free article] [PubMed] [Google Scholar]
- 27. Srinivasan VJ, Sakadzic S, Gorczynska I, et al. Quantitative cerebral blood flow with optical coherence tomography. Opt Express. 2010; 18: 2477–2494 [DOI] [PMC free article] [PubMed] [Google Scholar]
- 28. Cuthbertson RA, Mandel TE. Anatomy of the mouse retina—endothelial-cell pericyte ratio and capillary distribution. Invest Ophthalmol Vis Sci. 1986; 27: 1659–1664 [PubMed] [Google Scholar]
- 29. Kern TS, Barber AJ. Retinal ganglion cells in diabetes. J Physiol. 2008; 586: 4401–4408 [DOI] [PMC free article] [PubMed] [Google Scholar]
- 30. Martin PM, Roon P, Van Ells TK, Ganapathy V, Smith SB. Death of retinal neurons in streptozotocin-induced diabetic mice. Invest Ophthalmol Vis Sci. 2004; 45: 3330–3336 [DOI] [PubMed] [Google Scholar]
- 31. Barber AJ, Antonetti DA, Kern TS, et al. The Ins2(Akita) mouse as a model of early retinal complications in diabetes. Invest Ophthalmol Vis Sci. 2005; 46: 2210–2218 [DOI] [PubMed] [Google Scholar]
- 32. Ning X, Qin BY, Liang YZ, Sheng SL, Reed E, Li QDQ. Neuro-optic cell apoptosis and microangiopathy in KKAY mouse retina. Int J Mol Med. 2004; 13: 87–92 [PubMed] [Google Scholar]
- 33. Paques M, Tadayoni R, Sercombe R, et al. Structural and hemodynamic analysis of the mouse retinal microcirculation. Invest Ophthalmol Vis Sci. 2003; 44: 4960–4967 [DOI] [PubMed] [Google Scholar]
- 34. Tam J, Dhamdhere KP, Tiruveedhula P, et al. Disruption of the retinal parafoveal capillary network in type 2 diabetes before the onset of diabetic retinopathy. Invest Ophthalmol Vis Sci. 2011; 52: 9257–9266 [DOI] [PMC free article] [PubMed] [Google Scholar]
- 35. Wang RK, An L, Francis P, Wilson DJ. Depth-resolved imaging of capillary networks in retina and choroid using ultrahigh sensitive optical microangiography. Opt Lett. 2010; 35: 1467–1469 [DOI] [PMC free article] [PubMed] [Google Scholar]
- 36. Baumann B, Potsaid B, Kraus MF, et al. Total retinal blood flow measurement with ultrahigh speed swept source/Fourier domain OCT. Biomed Opt Express. 2011; 2: 1539–1552 [DOI] [PMC free article] [PubMed] [Google Scholar]
- 37. Choi W, Baumann B, Liu JJ, et al. Measurement of pulsatile total blood flow in the human and rat retina with ultrahigh speed spectral/Fourier domain OCT. Biomed Opt Express. 2012; 3: 1047–1061 [DOI] [PMC free article] [PubMed] [Google Scholar]
- 38. Clermont AC, Bursell SE. Retinal blood flow in diabetes. Microcirculation. 2007; 14: 49–61 [DOI] [PubMed] [Google Scholar]
- 39. Bursell SE, Clermont AC, Shiba T, King GL. Evaluating retinal circulation using video fluorescein angiography in control and diabetic rats. Curr Eye Res. 1992; 11: 287–295 [DOI] [PubMed] [Google Scholar]
- 40. Muir ER, Renteria RC, Duong TQ. Reduced ocular blood flow as an early indicator of diabetic retinopathy in a mouse model of diabetes. Invest Ophthalmol Vis Sci. 2012; 53: 6488–6494 [DOI] [PMC free article] [PubMed] [Google Scholar]
- 41. Feke GT, Buzney SM, Ogasawara H, et al. Retinal circulatory abnormalities in type-1 diabetes. Invest Ophthalmol Vis Sci. 1994; 35: 2968–2975 [PubMed] [Google Scholar]
- 42. Nagaoka T, Sato E, Takahashi A, Yokota H, Sogawa K, Yoshida A. Impaired retinal circulation in patients with type 2 diabetes mellitus: retinal laser Doppler velocimetry study. Invest Ophthalmol Vis Sci. 2010; 51: 6729–6734 [DOI] [PubMed] [Google Scholar]


