

Abstract
Recent biochemical and cell-based studies identified G0/G1 switch gene 2 (G0S2) as an inhibitor of adipose triglyceride lipase (ATGL), a key mediator of intracellular triacylglycerol (TG) mobilization. Here, we show that upon fasting, G0S2 protein expression exhibits an increase in liver and a decrease in adipose tissue. Global knockout of G0S2 in mice enhanced adipose lipolysis and attenuated gain of body weight and adiposity. More strikingly, G0S2 knockout mice displayed a drastic decrease in hepatic TG content and were resistant to high-fat diet (HFD)-induced liver steatosis, both of which were reproduced by liver-specific G0S2 knockdown. Mice with hepatic G0S2 knockdown also showed increased ketogenesis, accelerated gluconeogenesis, and decelerated glycogenolysis. Conversely, overexpression of G0S2 inhibited fatty acid oxidation in mouse primary hepatocytes and caused sustained steatosis in liver accompanied by deficient TG clearance during the fasting-refeeding transition. In response to HFD, there was a profound increase in hepatic G0S2 expression in the fed state. Global and hepatic ablation of G0S2 both led to improved insulin sensitivity in HFD-fed mice. Our findings implicate a physiological role for G0S2 in the control of adaptive energy response to fasting and as a contributor to obesity-associated liver steatosis.
Introduction
Adipose tissue and liver function coordinately in the maintenance of systemic energy homeostasis in response to nutrient intake and deprivation (1,2). During the fed state, insulin stimulates synthesis and storage of glycogen in liver and of triacylglycerols (TGs) in white adipose tissue (WAT). In the fasted state, glycogenolysis and gluconeogenesis are enhanced in liver to help preserve the supply of glucose. Fasting also induces the influx of free fatty acids (FFAs) and glycerol, released from WAT via lipolysis, into liver. While glycerol mostly serves as a substrate for gluconeogenesis, FFAs taken up by hepatocytes can either be used for β-oxidation in mitochondria and subsequent production of ketone bodies or re-esterified into TGs of VLDL particles for secretion. During fasting, the rate of hepatic fatty acid (FA) uptake often exceeds the net rate of FA utilization, leading to increased TG synthesis and storage within the intracellular lipid droplets (3–5). The fasting-induced TG accumulation in liver is reversible as TG levels gradually recede in response to refeeding. In humans, nonalcoholic fatty liver disease develops when hepatic steatosis becomes sustained owing to disruption of the normal mechanisms for synthesis, transport, or removal of FFAs and TGs (2,6–9).
Adipose triglyceride lipase (ATGL)/desnutrin/patatin-like phospholipase domain–containing 2 (PNPLA2) is considered to be the rate-limiting intracellular TG hydrolase (10–13). Inhibition of ATGL results in blocked adipose lipolysis and ultimate accumulation of triglyceride in various tissues (11,14–16). ATGL is widely expressed, and recent data point to a critical role for ATGL in the development of fatty liver (17–22). For example, adenovirus-mediated hepatic overexpression of ATGL promotes FA oxidation, reduces hepatic lipotoxicity, and ameliorates steatosis in mice with diet-induced obesity (DIO) (21,22). Conversely, liver-specific ATGL ablation leads to impairment in peroxisome proliferator–activated receptor (PPAR)α expression and FA oxidation along with the development of hepatic steatosis (18,19).
Existing evidence suggests that protein-protein interactions with comparative gene identification-58 (CGI-58), also known as α/β hydrolase domain–containing protein 5 (ABHD5), can stimulate ATGL posttranslationally (23). Recently, our laboratory identified a protein encoded by G0/G1 switch gene 2 (G0S2) as a selective inhibitor of ATGL (24–26). The G0S2 messenger levels decrease in adipose tissue along with a concomitant increase in liver during fasting (27–29). In cultured adipocytes and fat explants, overexpression of G0S2 decreased basal and isoproterenol-stimulated lipolysis. Suppression of endogenous G0S2, on the other hand, enhanced lipolysis in mature adipocytes (24,30).
Despite the compelling in vitro evidence demonstrating the antilipolytic role, the in vivo relevance of G0S2 remains unclear. In the current study, we have explored the physiologic roles of G0S2 by using both a global knockout mouse model as well as liver-specific loss- and gain-of-function approaches. Specifically, we examined the phenotypic changes in mice with altered G0S2 levels with respect to lipid and glucose homeostasis during the feeding-fasting transition and in response to high-fat feeding.
Research Design and Methods
Generation of G0S2 Knockout Mice
Global G0S2 knockout mice on the C57BL/6n background were obtained from the International Knockout Mouse Consortium (University of California, Davis, Knockout Mouse Project [KOMP] Repository). For genotyping, genomic DNA extracted from the mouse tail was subjected to PCR using the following primers: 5′-GAAAGTGTGCAGGAGCTG-3′ (primer 1), 5′-GCAAAGTGATAGCTCCTTGATTGC-3′ (primer 2), and 5′-GCAGCCTCTGTTCCACATACACTTCA-3′ (primer 3). Heterozygous G0S2+/− mice were crossed to generate the homozygous G0S2−/− mice. Wild-type (WT) and G0S2−/− mice were maintained in the animal facility at the Mayo Clinic in Arizona and fed either a chow diet (cat. no. 5001; Test Diet) or high-fat diet (HFD) (cat. no. D12492, 60% calories as fat; Research Diets) beginning at 8 weeks of age.
Liver-Specific Knockdown and Overexpression Experiments
Female C57BL/6J mice were purchased from The Jackson Laboratory (Bar Harbor, ME). All mice were fed a chow diet as described above unless otherwise indicated. For knockdown experiments, we used a method developed by Invitrogen that effectively deliverers stealth small interfering RNA (siRNA) to the liver of live animals via Invivofectamine reagent. The prepared siRNA oligonucleotides (7 mg/kg) were injected into 8-week-old female mice via the retro-orbital sinus. The sequences of siRNA oligonucleotides (Invitrogen) are as follows: for mouse G0S2, sense 5′-CAUGCUGUUUCAAGGUGCCACCGAA-3′ and antisense 5′-UUCGGUGGCACCUUGAAACAGCAUG-3′. Control oligonucleotides with comparable GC content were also obtained from Invitrogen. For overexpression experiments, mice were injected with 2.5 × 10⁹ plaque-forming units of adenovirus encoding murine G0S2 (Ad-G0S2) or a control adenovirus (Ad-null) via the retro-orbital sinus. The animal protocol was approved by the Mayo Clinic Institutional Animal Care and Use Committee.
Ex Vivo Lipolysis Measurement
For ex vivo lipolysis, peri-intestinal fat pads isolated from mice were incubated at 37°C in 1.0 mL phenol red–free Dulbecco’s modified Eagle’s medium containing 2% FA-free BSA with or without 1 μmol/L isoproterenol. The contents of glycerol (ZenBio) and FFA (Wako) in incubation media were quantified according to the manufacturer’s protocols.
Immunoblotting and Immunoprecipitation
For immunoblotting, liver or adipose tissues were homogenized in a buffer containing 50 mmol/L Tris-HCl (pH 7.4), 135 mmol/L NaCl, 10 mmol/L NaF, 1% Nonidet P-40, 0.1% SDS, 0.5% sodium deoxycholate, 1.0 mmol/L EDTA, 5% glycerol, and protease inhibitor) and analyzed as previously described (24). For immunoprecipitation, liver was extracted in a buffer containing 50 mmol/L Tris-HCl (pH 7.4), 135 mmol/L NaCl, 10 mmol/L NaF, 1% Triton X-100, 1.0 mmol/L EDTA, 5% glycerol, and protease inhibitors. The lysates were clarified by centrifugation at 20,000g for 10 min, and then immunoprecipitation was performed as previously described (24).
RNA Extraction and Real-Time PCR
Total RNA was isolated from mouse liver samples using the RNeasy Plus Mini Kit (Qiagen). cDNA was synthesized from total RNA by LongRange reverse transcriptase (Qiagen) with Oligo d(T). The resulting cDNA was subjected to real-time PCR analysis with SYBGreen PCR Master Mix (Invitrogen) on an Applied Biosystems 7900 HT Real-Time PCR System. The sequences of PCR primers are available upon request. Data were analyzed using the comparative cycle threshold (ΔΔCt) method normalized to β-actin.
Glucose, Insulin, and Pyruvate Tolerance Tests
For the glucose, insulin, and pyruvate tolerance tests, mice were fasted and injected intraperitoneally with glucose, insulin, or pyruvate. Blood glucose levels were monitored at indicated times from the tail vein using a glucometer (Freestyle; Abbott Diabetes Care).
Analysis of Hepatic Glycogen and TG Content
For measurement of hepatic glycogen, live tissue was acid hydrolyzed in 2 N HCL at 92°C for 2 h, neutralized with an equal volume of 2 N NaOH, and centrifuged at 15,000g for 10 min. The liberated free-glycosyl units of the supernatant were determined using the glucose-hexokinase kit (Wako). Analysis of liver TG was custom performed by the Vanderbilt Hormone Assay and Analytical Services Core.
Plasma Metabolite Analysis
Plasma glucose (Wako), total triglyceride (Thermo Fisher Scientific), total cholesterol (Wako), FFAs (Wako), and 3-hydroxybutyrate (Stanbio Laboratory) were measured according to the manufacturer’s protocols. Plasma insulin, leptin, and adiponectin levels were measured by using ELISA reagent kits purchased from Millipore.
Liver Histology
When mice were killed, livers were rapidly fixed in 10% neutral buffered formalin at 4°C overnight and embedded in paraffin. Paraffin sections were cut, mounted on glass slides, and stained with hematoxylin-eosin (H-E). Sections were photographed at ×20 magnification.
Triglyceride Hydrolase Activity Assay
After 16 h of fasting, the whole liver was quickly removed and then homogenized in 5 mL lysis buffer (0.25 mol/L sucrose, 1 mmol/L EDTA, 1 mmol/L dithiothreitol, and protease inhibitor). The tissue extract was centrifuged twice at 20,000g for 10 min each. Neutral TG hydrolase activity was determined as previously described (24).
Analysis of FA Oxidation in Mouse Primary Hepatocytes
FA oxidation was assessed on the basis of 3H2O production from [9,10-3H]oleate as described by Moon and Rhead (31) with minor modifications. Primary hepatocytes were isolated from 10-week-old female C57/Bl6 mice as previously described (32). Hepatocytes were infected with 1 × 10⁷ plaque-forming units/well of Ad-G0S2 or Ad-Null for 24 h. Then, cells were replaced with 3 mL BSA-complexed oleate (0.3 mmol/L unlabeled plus 1 μCi/mL [9,10-3H]oleate and 2% BSA) in the presence of carnitine (0.25 mmol/L) in serum-free Dulbecco’s modified Eagle’s medium. After 6 h, the media were collected for measuring 3H2O production.
Statistical Analysis
Values are expressed as mean ± SD. Statistical significance was evaluated by two-tailed unpaired Student t test. Differences were considered significant at P < 0.05.
Results
Tissue-Specific Expression of G0S2 Is Sensitive to Fasting and Feeding
To determine whether G0S2 expression is subject to nutritional regulation, we examined the G0S2 protein content in adipose tissue and liver throughout the feeding-fasting-refeeding cycle (Fig. 1A). In comparison with ad libitum feeding, 6- and 16-h fast increased hepatic G0S2 levels by nearly sixfold as revealed by immunoblotting analysis. The 6-h fast only caused a mild increase in ATGL expression in liver. However, after the chronic 16-h fast hepatic ATGL content rose to 5.5-fold of its level in the fed state. A 6-h refeeding was sufficient to induce a marked decrease in the expression of both G0S2 and ATGL (Fig. 1A). Thus, expression levels of G0S2 and ATGL in the liver are rhythmic. While G0S2 peaks early on, significant upregulation of ATGL only occurs during the chronic stage. Interestingly, in contrast to its changes in liver, G0S2 protein was downregulated in WAT upon fasting and restored after refeeding. In comparison, the ATGL protein levels in WAT remained relatively stable throughout the feeding-fasting-refeeding cycle (Fig. 1A).
Figure 1.

G0S2−/− mice have a lean phenotype. A: Eight-week-old C57BL/6j female mice were killed after being given food ad libitum (fed), fasted for 6 h (6 h fasted)/16 h (16 h fasted), or fasted and refed for 6 h (refed). Liver and gonadal adipose tissues were collected and analyzed for the expression of G0S2 and ATGL by immunoblotting. β-Actin was used as a loading control. B: PCR analysis of mice with the indicated G0S2 genotypes. The 0.51 kb and 0.31 kb fragments correspond to WT and mutated alleles, respectively. C: Immunoblotting analysis of gonadal fat extracts from fed mice or liver extracts from 16-h-fasted mice. D: Time course of body weight over 12 weeks in female mice fed either chow diet or HFD starting at the age of 8 weeks (n = 14–18 per group). #P < 0.05, ##P < 0.01, ###P < 0.001 vs. WT chow; **P < 0.01, ***P < 0.001 vs. knockout (KO) HFD. E: Time course of body weight over 12 weeks in male mice fed either chow diet or HFD starting at the age of 8 weeks (n = 18–21 per group). ##P < 0.01, ###P < 0.001 vs. WT chow; **P < 0.01, ***P < 0.001 vs. KO HFD. F: Average food intake of female mice in D during the diet treatments. G: Average food intake of male mice in E during the diet treatments.
Decreased Adiposity and Increased Adipose Lipolysis in Global G0S2 Knockout Mice
To determine the role of G0S2 in vivo, we obtained global G0S2 knockout mice from the KOMP. Disruption of the G0S2 gene was demonstrated by PCR of mouse genomic DNA (Fig. 1B), and deletion of the G0S2 protein was detected by immunoblotting in homogenates of adipose tissue and liver (Fig. 1C). G0S2−/− mice were modestly leaner on a chow diet, and the difference became greater after a 12-week HFD, especially in female mice (Fig. 1D and E). On both diets, G0S2−/− mice consumed an amount of food similar to that consumed by WT mice (Fig. 1F and G). Inguinal, gonadal, peri-renal, peri-intestinal, and interscapular (brown adipose tissue) fat depots weighed significantly less in the knockout mice compared with respective depots from WT mice (Fig. 2A and B). Under both basal and isoproterenol-stimulated conditions, glycerol and FFA release from WAT explants isolated from G0S2−/− mice was significantly higher than that from WT mice (Fig. 2C, D, E, and F), indicating higher lipolytic rates upon G0S2 deletion. Consistently, the knockout mice showed a significantly higher plasma FFA level in the basal state as well as upon injection of CL316243 to stimulate β3-adrenergic receptor in adipose tissue (Fig. 2G and Table 1). Therefore, global G0S2 deletion results in decreased body weight and adiposity under both chow and HFD feeding conditions along with elevated adipose lipolysis.
Figure 2.

G0S2 deficiency increases lipolysis and decreases fat mass: A: Organ and fat pad weights in 20-week-old female mice on chow diet (n = 12 per group). *P < 0.05, **P < 0.01 vs. WT chow. B: Organ and fat pad weights in female mice after 15 weeks on HFD (n = 9–11 per group). *P < 0.05, **P < 0.01 vs. WT HFD. C and D: Glycerol and FFA release in adipose tissue from female mice on chow diet. Peri-intestinal fat pads from 16-week-old female mice were cultured ex vivo in the presence or absence of 1 μmol/L isoproterenol. Glycerol and FFA contents of explant media were subsequently measured (n = 6 per group). #P < 0.05 vs. WT basal; *P < 0.05, **P < 0.01 vs. WT stimulated. E and F: Glycerol and FFA release in adipose tissue from mice after 12 weeks of HFD. Peri-intestinal fat pads were stimulated with or without 1 μmol/L isoproterenol. Glycerol and FFA contents in the media were detected (n = 6 per group). *P < 0.05, **P < 0.01 vs. WT stimulated. G: Plasma FFA levels were determined 15 min after PBS or CL316243 injection in 16-week-old female on chow diet (n = 8–10 per group). ###P < 0.01 vs. WT PBS; **P < 0.001 vs. WT CL316243. BAT, brown adipose tissue; Gon, gonadal fat pad; KO, knockout; Ing, inguinal fat pad; Peri-Ren, peri-renal fat pad; P-Intes, peri-intestinal fat.
Table 1.
Blood chemistry of WT and knockout mice
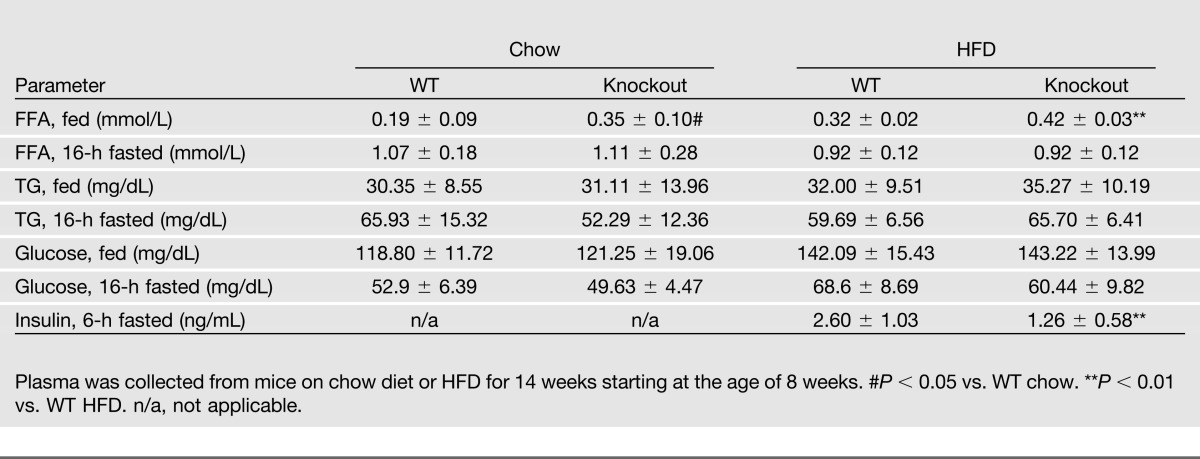
G0S2 Knockout Mice Are Resistant to Fasting-Induced Hepatic TG Accumulation and HFD-Induced Liver Steatosis
While there was no difference in heart, lung, or spleen weights, liver weight was lower in G0S2−/− mice compared with WT mice (Fig. 2A and B). Strikingly, the global G0S2 deletion caused a 79% decrease in the fasting liver TG levels in mice fed with chow diet (Fig. 3A). HFD induced a near-threefold increase in the fasting liver TG content of WT mice, which was reduced by 81% in G0S2−/− animals (Fig. 3A). As a result, the liver from G0S2−/− mice on HFD exhibited a darker color (Fig. 3B). Histological analysis of liver specimens revealed a pronounced decrease of fat vacuoles in G0S2−/− mice (Fig. 3C). In addition, lower levels of alanine aminotransferase and aspartate aminotransferase were observed in serum from the knockout mice, especially after HFD treatment (Fig. 3D and E). Together, these results suggest that G0S2 not only is a critical regulator of hepatic TG accumulation in chow-fed mice but also contributes to the development of liver steatosis and damage in response to HFD.
Figure 3.

G0S2 deficiency abolishes TG accumulation in liver. A: Hepatic TG content in 16-h-fasted female mice fed chow diet (n = 8 per group) or HFD (n = 11 per group) for 14 weeks. ###P < 0.001 vs. WT chow; ***P < 0.001 vs. WT HFD. B: Representative image of liver from female mice after 14 weeks on HFD followed by a 16-h fast. C: Representative H-E staining of liver sections from mice in A. D and E: Plasma alanine aminotransferase (ALT) and aspartate aminotransferase (AST) levels in mice after 14 weeks on chow diet or HFD starting at the age of 8 weeks (n = 5–8 per group for chow diet and 14–17 per group for HFD). **P < 0.01, ***P < 0.001 vs. WT HFD. U, units.
Reduction of Hepatic G0S2 Increases TG Hydrolase Activity and Decreases TG Content in Liver
To evaluate the antilipolytic role of hepatic G0S2, we first determined whether endogenous ATGL and G0S2 interact with each other in the fasting liver. To this end, ATGL was immunoprecipitated from liver extracts with a specific antibody (Fig. 4A). G0S2 coimmunoprecipitated with ATGL but was absent in the precipitates of nonspecific IgG. Inclusion of an ATGL-blocking peptide was able to abolish immunoprecipitation of ATGL and coprecipitation of G0S2 (Fig. 4A), demonstrating the specificity of their association. Next, we reduced G0S2 levels in liver by using an invivofectamine/siRNA-mediated knockdown method. Compared with that of a GC-matched negative control siRNA, intravenous injection of siRNA directed against G0S2 was effective in inducing a >90% reduction in hepatic G0S2 protein (Fig. 4B). The effect was limited to liver, since no noticeable knockdown was observed in adipose tissue (Fig. 4B). Importantly, knockdown of hepatic G0S2 resulted in a significant increase in TG hydrolase activity in liver tissue extracts (Fig. 4C). In mice receiving control siRNA, 6- and 16-h fasts increased liver TG content by 3- and 12-fold, respectively (Fig. 4D). Suppression of G0S2 significantly decreased liver TGs at all three time points of the feeding-fasting period. The most profound reduction was observed at 6 h into fasting, when the TG levels in the G0S2-depleted liver were <40% of that in the control liver (Fig. 4D). Consistently, histological analysis of liver specimens showed considerably fewer fat vacuoles after G0S2 knockdown (Fig. 4E). Thus, hepatic G0S2 is critically involved in liver TG accumulation, possibly through interacting with and inhibiting ATGL, especially during the early fasting stage.
Figure 4.

Upregulation of hepatic G0S2 expression is critical for fasting- and HFD-induced TG accumulation: A: Eight-week-old C57BL/6j female mice were killed after a 16-h fast. Immunoprecipitation (IP) of endogenous ATGL was performed in the liver extracts in the presence or absence of an ATGL epitope–blocking peptide. Nonspecific (NS) IgG was used as control. G0S2 and ATGL in precipitates and extracts were analyzed by immunoblotting with respective antibodies. B–E: C57BL/6j female mice were injected with G0S2-specific siRNA (G0S2 KD) or control (Ctrl KD) siRNA and then subject to the following analyses 3 days later. B: Immunoblotting was performed to detect protein levels in liver and gonadal adipose tissues after a 16-h fast. C: TG hydrolase activity in liver from 16-h-fasted mice was measured using 3H-labeled triolein as substrate. The activity was normalized with the total protein levels of the reaction mixtures and was shown in relation to the control (n = 3 per group). *P < 0.05 vs. Ctrl KD. D: Hepatic TG content was determined at indicated conditions (n = 5–6 per group). *P < 0.05, **P < 0.01 vs. Ctrl KD. E: Livers from mice as shown in C were also used for H-E staining. F: Eight-week-old C57BL/6j female mice were fed chow diet or HFD for 3 weeks. The protein levels of G0S2 in liver from fed or 16-h-fasted mice were determined by immunoblotting. G and H: After 3 weeks of HFD, mice were injected with G0S2-specific or control siRNA. Three days later, after a 6-h fast, hepatic G0S2 expression by immunoblotting (B) and TG content (C) was measured (n = 4 per group for chow diet and 6 for HFD). **P < 0.01 vs. HFD-Ctrl KD.
Next, we asked whether hepatic G0S2 is involved in the development of steatosis in mice on HFD. As shown in Fig. 4F, HFD feeding for 3 weeks caused a marked increase in the hepatic protein levels of G0S2 in the fed state. In the fasted state, however, the difference in G0S2 levels was not significant in the liver of HFD- versus chow-fed mice. Hepatic TG content in the HFD-fed mice treated with G0S2 siRNA was only one-third that in the HFD-fed controls (Fig. 4G and H). Liver TG content in the G0S2 knockdown mice on HFD was even lower than that in the control knockdown animals fed with chow diet. These results suggest that increased hepatic G0S2 expression in the fed state contributes critically to the development of HFD-induced steatosis.
Energy Metabolism in Mice with Liver-Specific Knockdown
To determine whether enhanced FA oxidation contributes to the reduction in hepatic TG content, we measured the plasma levels of ketone body 3-hydroxybutyrate. Figure 5A shows that G0S2 knockdown increased the plasma levels of 3-hydroxybutyrate by 65% after a 16-h fast. Additionally, G0S2 overexpression in mouse primary hepatocytes resulted in a 44% decrease in H2O production when the cells were treated with oleic acid (Fig. 5B). As revealed by real time PCR analysis, knockdown of G0S2 in liver elicited a significant increase in the expression of genes related to FA oxidation including AOX, CPT1, and PDK4 (Fig. 5C). However, messenger expression of PPARα or other more sensitive target genes of PPARα including EHHADH, Acot1, Cyp4a10, and Cyp4a14 was unaffected by G0S2 knockdown (Fig. 5C). Taken together, these results indicate a negative regulatory effect of G0S2 on hepatic FA oxidation and the subsequent ketogenesis.
Figure 5.

G0S2 regulates hepatic FFA and glucose metabolism. Eight-week-old C57BL/6j female mice were injected with G0S2-specific (G0S2 KD) or control (Ctrl KD) siRNA, and the following analyses were performed 3 days later except for in B. A: After a 16-h fast, plasma levels of 3-hydroxybutyrate were measured (n = 5 per group). *P < 0.05 vs. Ctrl KD. B: Primary hepatocytes were infected with Ad-G0S2 or Ad-Null for 24 h followed by measurement of FA oxidation. The data are representative of three independent experiments. *P < 0.05 vs. Ad-Null. C: Real-time PCR was used to determine the mRNA levels of genes in liver from mice in A. Data normalized to β-actin were expressed relative to the control (n = 5 per group). *P < 0.05 vs. Ctrl KD. D: After a 16-h fast, mice were injected with 2 g/kg pyruvate and blood glucose levels were detected at indicated times (n = 6 per group). *P < 0.05 vs. Ctrl KD. E: After a 16-h fast, the mRNA levels of G6Pase, PEPCK, FPB1, and PC in liver were assessed by real-time PCR (n = 5 per group). G6Pase, glucose-6-phosphatase, catalytic; PEPCK, phosphoenolpyruvate carboxykinase 1, cytosolic; PC, pyruvate carboxylase. *P < 0.05, **P < 0.01 vs. Ctrl KD. F: Hepatic glycogen content was measured at indicated conditions (n = 5–6 per group). *P < 0.05, **P < 0.01 vs. Ctrl KD.
For more direct assessment of the role of G0S2 in hepatic glucose homeostasis, mice were challenged with the gluconeogenic precursor pyruvate. Injection of pyruvate after an overnight fast led to a significantly higher plasma glucose level in both groups of mice, but the G0S2 knockdown mice displayed a greater increase in plasma glucose levels than the control mice at 15- and 30-min time points (Fig. 5D). G0S2 knockdown also significantly increased expression of glucose-6-phosphatase, catalytic, and fructose-1, 6-bisphosphatase 1 (FBP1): the enzymes responsible for catalyzing the final step of gluconeogenesis (Fig. 5E). Interestingly, after a 6-h fast the hepatic glycogen content was approximately a threefold higher in the G0S2 knockdown mice (Fig. 5F). Compared with the levels in the fed state, only 12% of glycogen remained in the liver of control mice after the 6-h fast, while the G0S2 knockdown mice were able to retain 33% of their hepatic glycogen (Fig. 5F). The difference became considerably smaller when the fast was prolonged to 16 h. Thus, hepatic ablation of G0S2 leads to acceleration of gluconeogenesis and deceleration of glycogenolysis during the early phase of fasting.
Hepatic Overexpression of G0S2 Causes Steatosis That Is Less Susceptible to Modulation by Feeding and Fasting
To ascertain whether alternating changes in G0S2 levels are critical for the oscillations in hepatic TG content, we attempted a strategy in which ectopic expression was used to maintain G0S2 protein at constant high levels. This was achieved by intravenous injection of mice with Ad-G0S2. Compared with Ad-null, Ad-G0S2 markedly increased the hepatic protein levels of G0S2, and this ectopic expression was not subject to regulation by feeding, fasting, or refeeding (Fig. 6A). Ad-G0S2 reduced the TG hydrolase activity as measured in the liver homogenates by 59% (Fig. 6B) and significantly increased the size and the number of fat vacuoles in the liver sections (Fig. 6C). In the control mice injected with Ad-null, a 16-h fast resulted in a near 6.0-fold increase in hepatic TG content, which exhibited a 2.9-fold reduction after a 12-h refeeding (Fig. 6D). G0S2 overexpression caused a near 4.3-fold increase in the liver TG levels during ad libitum feeding. However, in response to fasting, only a 2.2-fold further elevation was observed in mice injected with Ad-G0S2. Moreover, refeeding reduced hepatic TG levels in these mice by <30% (Fig. 6D). Therefore, ectopic G0S2 was able to not only enhance the overall liver TG content but also restrict its changes during the feeding-fasting-refeeding cycles.
Figure 6.
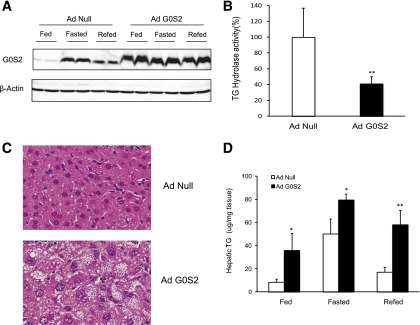
G0S2 overexpression in liver disrupts the oscillations of hepatic TG content during the feeding/fasting/refeeding cycle: Eight-week-old C57BL/6j female mice were injected with Ad-G0S2 or Ad-Null. Experiments were conducted 7 days postinjection. A: Immunoblotting of liver extracts isolated from mice that were fed, fasted for 16 h, or fasted for 16 h and then refed for 12 h. B: Hepatic TG hydrolase activity in mice after a 16-h fast (n = 4–6 per group). **P < 0.01 vs. Ad-Null. C: H-E staining of liver in 6-h-fasted mice after 7 days of adenovirus infection. D: Hepatic TG content in mice from A (n = 4 per group). *P < 0.05, **P < 0.01 vs. Ad-Null.
Deletion of G0S2 Improves Insulin Sensitivity During HFD Treatment
Given that enhanced adiposity and hepatic steatosis are often associated with abnormality of glucose metabolism, we further evaluated the impact of G0S2 deletion on the whole-body glucose tolerance and insulin tolerance in mice fed with HFD. To this end, we measured glucose and insulin tolerance in global G0S2 knockout mice 8 weeks after treatment with HFD. As shown in Fig. 7A and B, the global G0S2 knockout mice displayed a significant improvement in insulin sensitivity as revealed by intraperitoneal glucose tolerance test (IPGTT) and intraperitoneal insulin tolerance test (IPITT). There was also a 52% decrease in fasting plasma insulin concentration in the HFD-fed knockout mice in comparison with WT animals on HFD (Table 1). Furthermore, both glucose tolerance and insulin sensitivity were also improved significantly in response to hepatic G0S2 knockdown (Fig. 7C and D). Thus, both global and liver-specific ablation of G0S2 ameliorate hepatic steatosis induced by HFD with a concurrent improvement in global insulin resistance.
Figure 7.
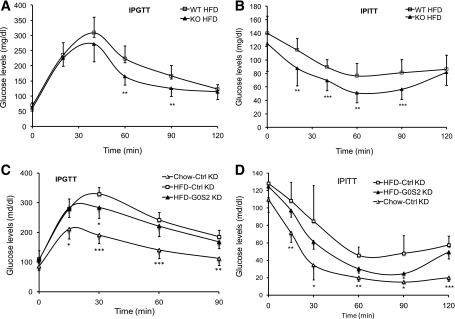
Global or liver-specific depletion of G0S2 improves insulin sensitivity: A: IPGTT (2 g/kg) in 16-h-fasted female mice after 8 weeks of HFD (n = 9–11 per group). **P < 0.01 vs. WT HFD. B: IPITT (0.85 units/kg) in 6-h-fasted female mice after 8 weeks of HFD (n = 12 per group). **P < 0.01, ***P < 0.001 vs. WT HFD. C and D: After 3 weeks of HFD feeding, mice were injected twice with G0S2-specific (G0S2 KD) or control (Ctrl KD) siRNA with a 1-week interval during the following 2 weeks on continuous HFD. After a 6-h fast, IPGTT (C) (2 g/kg) and IPITT (D) (0.75 units/kg) were performed. n = 6 per group for HFD and 4 for chow. *P < 0.05, **P < 0.01, ***P < 0.001 vs. HFD-Ctrl KD. KO, knockout.
Discussion
In the fasted state, a set of metabolic changes occurs in WAT and liver to spare carbohydrate and increase dependence on fat as a substrate for energy supply. In this context, the current study demonstrates that G0S2, whose expression increases in liver and decreases in WAT upon fasting, is an important switch at the crossroads of carbohydrate and lipid metabolism. Using a global knockout model, we have gained evidence that G0S2 in adipose tissue attenuates lipolysis in the fed state and G0S2 in liver promotes TG accumulation in the fasted state. Liver-specific knockdown has shown that hepatic G0S2 acts to accelerate glycogen breakdown while decelerating FA oxidation, ketone body production, and gluconeogenesis. We have also provided evidence that G0S2 is involved in the development of hepatic steatosis and insulin resistance in HFD-induced obesity.
Our phenotypic characterization of the G0S2 knockout mice showed that the global ablation of G0S2 attenuated increases in body weight and fat mass in mice fed both chow and HFD. In agreement with the previous findings of G0S2 as an ATGL inhibitor, the whole-body G0S2 ablation resulted in enhanced adipose lipolysis. Increased FA flux from adipose tissue usually leads to increased TG accumulation in other peripheral tissues. However, to our surprise, the most drastic phenotype displayed by G0S2 knockout mice is the profound decrease in the fasting liver TG content. Especially in response to HFD, the knockout animals were largely protected against the development of hepatic steatosis. Subsequently, our liver-specific knockdown experiments provided an explanation for this metabolic effect of G0S2 knockout by demonstrating a direct function of hepatic G0S2 in the control of liver TG content.
Several lines of evidence are in support of an antilipolytic role of hepatic G0S2. First, endogenous G0S2 and ATGL associate with each other in the fasting liver as revealed by coimmunoprecipitation experiment. Second, there was a significant increase of intrahepatic TG hydrolase activity after G0S2 knockdown and a decrease of such activity upon G0S2 overexpression. Another of our key findings is the inhibition of hepatic FA oxidation and ketogenesis by G0S2. Reminiscent of those observed in mice with hepatic ATGL overexpression (21,22), G0S2 knockout and knockdown both resulted in a marked reduction in the liver TG levels along with enhanced ketogenesis. Like what was observed with ATGL ablation (18,19), FA oxidation was also suppressed in mouse primary hepatocytes overexpressing G0S2. Thus, inhibition of ATGL-mediated TG turnover by G0S2 in hepatocytes likely limits the amount of FFAs available for mitochondrial β-oxidation. Moreover, G0S2 may also act to suppress FA oxidation through downregulation of expression of FA oxidation genes (i.e., AOX, CPT1, and PDK4). Earlier evidence shows that liver-specific ATGL ablation leads to drastic downregulation of PPARα expression (18,19). However, hepatic G0S2 knockdown caused no alteration in expression of either PPARα or other more sensitive PPARα target genes such as Ehhadh, Cyp4a10, Cyp4a14, and Acot1. Our data suggest that G0S2 deletion can uncouple expression of FA oxidation genes from PPARα activation.
What is the physiologic benefit of upregulating G0S2 in liver during fasting? We propose that G0S2 is produced to promote partitioning of FAs into the lipid droplet TG pool, thereby increasing the threshold for FA utilization. This could be especially relevant during the early stage of fasting when glycogen-derived glucose is the primary source of rapid energy output. Indeed, we found that hepatic G0S2 expression peaked within 6 h of fasting and that knockdown of G0S2 caused a marked reduction in glycogen breakdown during this early fasting stage. It is important to note that despite the impact on glycogenolysis, the plasma glucose levels remained unchanged without G0S2. This lack of reduction in glycemia could be explained, at least partially, by the enhanced hepatic capacity for de novo gluconeogenesis as revealed by the pyruvate tolerance test. It is well-known that hepatic gluconeogenesis is activated upon fasting and is fueled by FA oxidation. Therefore, lipolytic changes likely influence gluconeogenesis through altered FA oxidation. During the chronic stage of fasting, we detected a drastic upregulation in hepatic expression of ATGL, presumably through activation of FOXO1 (33). Elevated ATGL levels coupled with continuous TG buildup may eventually override the dam effect of G0S2 inhibition, allowing TGs in lipid droplets to be mobilized in support of processes such as FA oxidation and ketogenesis.
Findings from our overexpression experiment agree with a recent observation that increased G0S2 in liver promotes TG accumulation (34). Additionally, our data demonstrate that when it stays at constant high levels, G0S2 can prevent TG clearance during the fasting-refeeding transition and thereby produce a steatotic state that is rigid and inflexible. Increased hepatic G0S2 expression and TG accumulation are two shared features of fasting and HFD-induced steatosis. We speculate that in response to HFD, the increased G0S2 expression in the fed state may cause deficiency in TG clearance and progressively lead to aggravated steatosis in the ensuing fasted stage. In support of this notion, HFD-induced steatosis was almost completely alleviated by global or liver-specific ablation of G0S2. In obesity, peripheral lipotoxicity caused by the intracellular accumulation of FA-derived lipid metabolites is causally linked to insulin resistance. Although hepatic G0S2 deletion does not result in significant changes in plasma FFA levels in mice on HFD, it is plausible that enhanced FA oxidation in the absence of G0S2 may lead to a relief of lipotoxicity in the liver and thus the observed improvement in the whole-body glucose and insulin tolerance.
In summary, we have demonstrated that G0S2 is critical for coordinating adipose lipolysis, liver TG accumulation, ketogenesis, and glycogen breakdown during early fasting and is a major contributor to the development of hepatic steatosis in response to high-fat feeding. Our findings may open a new therapeutic strategy based on the modulation of hepatic G0S2 to alleviate steatosis and energy imbalance.
Article Information
Acknowledgments. The authors thank Drs. Zhouji Chen (Washington University), Xingyuan Yang (University of Cincinnati), and Tianna Stubblefield (Mayo Clinic Arizona) for their technical expertise and assistance, and Drs. Alan Cheng (University of Louisville) and Douglas Mashek (University of Minnesota) for helpful discussions. The authors also acknowledge the Vanderbilt University Mouse Metabolic Phenotyping Center (DK-59637) for their excellent support in lipid profiling experiments
Funding. This work was supported by research grants from the National Institutes of Health (DK-089178) and the American Diabetes Association (1-10-JF-30) to J.L.
Duality of Interest. No potential conflicts of interest relevant to this article were reported.
Author Contributions. X.Z. designed and performed research, analyzed data, and wrote the manuscript. X.X., B.L.H., and A.M.S. performed research and analyzed the data. T.A.C. contributed to the establishment of the liver-specific knockdown method. J.L. designed and supervised the study and wrote the manuscript. J.L. is the guarantor of this work and, as such, had full access to all the data in the study and takes responsibility for the integrity of the data and the accuracy of the data analysis.
Footnotes
See accompanying article, p. 847.
References
- 1.van den Berghe G. The role of the liver in metabolic homeostasis: implications for inborn errors of metabolism. J Inherit Metab Dis 1991;14:407–420 [DOI] [PubMed] [Google Scholar]
- 2.Cohen JC, Horton JD, Hobbs HH. Human fatty liver disease: old questions and new insights. Science 2011;332:1519–1523 [DOI] [PMC free article] [PubMed] [Google Scholar]
- 3.Lin X, Yue P, Chen Z, Schonfeld G. Hepatic triglyceride contents are genetically determined in mice: results of a strain survey. Am J Physiol Gastrointest Liver Physiol 2005;288:G1179–G1189 [DOI] [PubMed] [Google Scholar]
- 4.Guan HP, Goldstein JL, Brown MS, Liang G. Accelerated fatty acid oxidation in muscle averts fasting-induced hepatic steatosis in SJL/J mice. J Biol Chem 2009;284:24644–24652 [DOI] [PMC free article] [PubMed] [Google Scholar]
- 5.Nishikawa S, Doi K, Nakayama H, Uetsuka K. The effect of fasting on hepatic lipid accumulation and transcriptional regulation of lipid metabolism differs between C57BL/6J and BALB/cA mice fed a high-fat diet. Toxicol Pathol 2008;36:850–857 [DOI] [PubMed] [Google Scholar]
- 6.Kawano Y, Cohen DE. Mechanisms of hepatic triglyceride accumulation in non-alcoholic fatty liver disease. J Gastroenterol 2013;48:434–441 [DOI] [PMC free article] [PubMed] [Google Scholar]
- 7.Malhi H, Gores GJ. Molecular mechanisms of lipotoxicity in nonalcoholic fatty liver disease. Semin Liver Dis 2008;28:360–369 [DOI] [PMC free article] [PubMed] [Google Scholar]
- 8.Jensen MD. Role of body fat distribution and the metabolic complications of obesity. J Clin Endocrinol Metab 2008;93(Suppl. 1):S57–S63 [DOI] [PMC free article] [PubMed] [Google Scholar]
- 9.Lapenna S, Dinan L, Friz J, Hopfinger AJ, Liu J, Hormann RE. Semi-synthetic ecdysteroids as gene-switch actuators: synthesis, structure-activity relationships, and prospective ADME properties. ChemMedChem 2009;4:55–68 [DOI] [PubMed] [Google Scholar]
- 10.Girousse A, Langin D. Adipocyte lipases and lipid droplet-associated proteins: insight from transgenic mouse models. Int J Obes (Lond) 2012;36:581–594 [DOI] [PubMed] [Google Scholar]
- 11.Zechner R, Zimmermann R, Eichmann TO, et al. FAT SIGNALS—lipases and lipolysis in lipid metabolism and signaling. Cell Metab 2012;15:279–291 [DOI] [PMC free article] [PubMed] [Google Scholar]
- 12.Jenkins CM, Mancuso DJ, Yan W, Sims HF, Gibson B, Gross RW. Identification, cloning, expression, and purification of three novel human calcium-independent phospholipase A2 family members possessing triacylglycerol lipase and acylglycerol transacylase activities. J Biol Chem 2004;279:48968–48975 [DOI] [PubMed] [Google Scholar]
- 13.Villena JA, Roy S, Sarkadi-Nagy E, Kim KH, Sul HS. Desnutrin, an adipocyte gene encoding a novel patatin domain-containing protein, is induced by fasting and glucocorticoids: ectopic expression of desnutrin increases triglyceride hydrolysis. J Biol Chem 2004;279:47066–47075 [DOI] [PubMed] [Google Scholar]
- 14.Zechner R, Kienesberger PC, Haemmerle G, Zimmermann R, Lass A. Adipose triglyceride lipase and the lipolytic catabolism of cellular fat stores. J Lipid Res 2009;50:3–21 [DOI] [PubMed] [Google Scholar]
- 15.Ahmadian M, Abbott MJ, Tang T, et al. Desnutrin/ATGL is regulated by AMPK and is required for a brown adipose phenotype. Cell Metab 2011;13:739–748 [DOI] [PMC free article] [PubMed] [Google Scholar]
- 16.Wu JW, Wang SP, Casavant S, Moreau A, Yang GS, Mitchell GA. Fasting energy homeostasis in mice with adipose deficiency of desnutrin/adipose triglyceride lipase. Endocrinology 2012;153:2198–2207 [DOI] [PubMed] [Google Scholar]
- 17.Haemmerle G, Lass A, Zimmermann R, et al. Defective lipolysis and altered energy metabolism in mice lacking adipose triglyceride lipase. Science 2006;312:734–737 [DOI] [PubMed] [Google Scholar]
- 18.Ong KT, Mashek MT, Bu SY, Greenberg AS, Mashek DG. Adipose triglyceride lipase is a major hepatic lipase that regulates triacylglycerol turnover and fatty acid signaling and partitioning. Hepatology 2011;53:116–126 [DOI] [PMC free article] [PubMed] [Google Scholar]
- 19.Wu JW, Wang SP, Alvarez F, et al. Deficiency of liver adipose triglyceride lipase in mice causes progressive hepatic steatosis. Hepatology 2011;54:122–132 [DOI] [PubMed] [Google Scholar]
- 20.Ong KT, Mashek MT, Bu SY, Mashek DG. Hepatic ATGL knockdown uncouples glucose intolerance from liver TAG accumulation. FASEB J 2013;27:313–321 [DOI] [PMC free article] [PubMed] [Google Scholar]
- 21.Reid BN, Ables GP, Otlivanchik OA, et al. Hepatic overexpression of hormone-sensitive lipase and adipose triglyceride lipase promotes fatty acid oxidation, stimulates direct release of free fatty acids, and ameliorates steatosis. J Biol Chem 2008;283:13087–13099 [DOI] [PMC free article] [PubMed] [Google Scholar]
- 22.Turpin SM, Hoy AJ, Brown RD, et al. Adipose triacylglycerol lipase is a major regulator of hepatic lipid metabolism but not insulin sensitivity in mice. Diabetologia 2011;54:146–156 [DOI] [PubMed] [Google Scholar]
- 23.Lass A, Zimmermann R, Haemmerle G, et al. Adipose triglyceride lipase-mediated lipolysis of cellular fat stores is activated by CGI-58 and defective in Chanarin-Dorfman Syndrome. Cell Metab 2006;3:309–319 [DOI] [PubMed] [Google Scholar]
- 24.Yang X, Lu X, Lombès M, et al. The G(0)/G(1) switch gene 2 regulates adipose lipolysis through association with adipose triglyceride lipase. Cell Metab 2010;11:194–205 [DOI] [PMC free article] [PubMed] [Google Scholar]
- 25.Lu X, Yang X, Liu J. Differential control of ATGL-mediated lipid droplet degradation by CGI-58 and G0S2. Cell Cycle 2010;9:2719–2725 [DOI] [PMC free article] [PubMed] [Google Scholar]
- 26.Cornaciu I, Boeszoermenyi A, Lindermuth H, et al. The minimal domain of adipose triglyceride lipase (ATGL) ranges until leucine 254 and can be activated and inhibited by CGI-58 and G0S2, respectively. PLoS ONE 2011;6:e26349. [DOI] [PMC free article] [PubMed] [Google Scholar]
- 27.Zandbergen F, Mandard S, Escher P, et al. The G0/G1 switch gene 2 is a novel PPAR target gene. Biochem J 2005;392:313–324 [DOI] [PMC free article] [PubMed] [Google Scholar]
- 28.Nielsen TS, Vendelbo MH, Jessen N, et al. Fasting, but not exercise, increases adipose triglyceride lipase (ATGL) protein and reduces G(0)/G(1) switch gene 2 (G0S2) protein and mRNA content in human adipose tissue. J Clin Endocrinol Metab 2011;96:E1293–E1297 [DOI] [PubMed] [Google Scholar]
- 29.Oh SA, Suh Y, Pang MG, Lee K. Cloning of avian G(0)/G(1) switch gene 2 genes and developmental and nutritional regulation of G(0)/G(1) switch gene 2 in chicken adipose tissue. J Anim Sci 2011;89:367–375 [DOI] [PubMed] [Google Scholar]
- 30.Schweiger M, Paar M, Eder C, et al. G0/G1 switch gene-2 regulates human adipocyte lipolysis by affecting activity and localization of adipose triglyceride lipase. J Lipid Res 2012;53:2307–2317 [DOI] [PMC free article] [PubMed] [Google Scholar]
- 31.Moon A, Rhead WJ. Complementation analysis of fatty acid oxidation disorders. J Clin Invest 1987;79:59–64 [DOI] [PMC free article] [PubMed] [Google Scholar]
- 32.Chen Z, Fitzgerald RL, Averna MR, Schonfeld G. A targeted apolipoprotein B-38.9-producing mutation causes fatty livers in mice due to the reduced ability of apolipoprotein B-38.9 to transport triglycerides. J Biol Chem 2000;275:32807–32815 [DOI] [PubMed] [Google Scholar]
- 33.Chakrabarti P, English T, Karki S, et al. SIRT1 controls lipolysis in adipocytes via FOXO1-mediated expression of ATGL. J Lipid Res 2011;52:1693–1701 [DOI] [PMC free article] [PubMed] [Google Scholar]
- 34.Wang Y, Zhang Y, Qian H, et al. The g0/g1 switch gene 2 is an important regulator of hepatic triglyceride metabolism. PLoS ONE 2013;8:e72315. [DOI] [PMC free article] [PubMed] [Google Scholar]