

Abstract
The physiological role of the spliced form of X-box–binding protein 1 (XBP1s), a key transcription factor of the endoplasmic reticulum (ER) stress response, in adipose tissue remains largely unknown. In this study, we show that overexpression of XBP1s promotes adiponectin multimerization in adipocytes, thereby regulating systemic glucose homeostasis. Ectopic expression of XBP1s in adipocytes improves glucose tolerance and insulin sensitivity in both lean and obese (ob/ob) mice. The beneficial effect of adipocyte XBP1s on glucose homeostasis is associated with elevated serum levels of high-molecular-weight adiponectin and, indeed, is adiponectin-dependent. Mechanistically, XBP1s promotes adiponectin multimerization rather than activating its transcription, likely through a direct regulation of the expression of several ER chaperones involved in adiponectin maturation, including glucose-regulated protein 78 kDa, protein disulfide isomerase family A, member 6, ER protein 44, and disulfide bond oxidoreductase A–like protein. Thus, we conclude that XBP1s is an important regulator of adiponectin multimerization, which may lead to a new therapeutic approach for the treatment of type 2 diabetes and hypoadiponectinemia.
Introduction
Accumulation of misfolded proteins in the endoplasmic reticulum (ER) causes ER stress and leads to the activation of unfolded protein response (UPR). ER stress has been shown to play an important role in obesity-induced insulin resistance (1). Of the three branches of mammalian UPR, inositol-requiring enzyme-1α (IRE1α) and its downstream target X-box–binding protein 1 (XBP1) are most highly conserved from yeast to humans (2,3). Upon ER stress, IRE1α undergoes trans-autophosphorylation and activation and subsequently splices 26 nucleotides from Xbp1 mRNA, leading to a frame shift and the generation of an active b-ZIP transcription factor, spliced form of XBP1 (XBP1s), which translocates to the nucleus and activates gene transcription. As deficiency in either IRE1α or XBP1 are embryonic-lethal, several recent studies have used various tissue-specific gain- and loss-of-function animal models to demonstrate that the IRE1α–XBP1s pathway plays an important role in metabolic regulation, particularly in the liver (4–9). Its role in adipose tissue remains poorly characterized.
In vitro, we and others have shown that XBP1s is required (10–12), but not sufficient (13) for adipocyte differentiation (i.e., adipogenesis). In vivo, Xbp1+/− mice exhibit increased IRE1α activation in adipose tissue upon obesity, which subsequently attenuates insulin signaling by modulating the Jun NH2-terminal kinase–insulin receptor substrate-1 signaling axis (4). However, using adipocyte-specific XBP1 knockout mice, a recent study showed that loss of XBP1s in adipocytes has no profound effect on inflammation and metabolic homeostasis, suggesting a possible compensatory mechanism for the loss of XBP1s in adipocytes (11). To further characterize the role of XBP1s in adipose tissue, we generated an adipocyte-specific XBP1s gain-of-function mouse model in which we found a surprising link between XBP1s and adiponectin folding and maturation.
Adiponectin is a key insulin-sensitizing hormone, and its serum level is negatively correlated with obesity and insulin resistance (14). It circulates at extraordinarily high concentrations primarily in three forms: trimer, hexamer, and a high-molecular-weight (HMW) complex (15–17). HMW adiponectin is thought to possess the most potent insulin-sensitizing activity among the three forms (18,19). Defects in adiponectin multimerization are associated with hypoadiponectinemia and hyperglycemia (15). In humans, the causal link between adiponectin and insulin sensitization is less clear (20), but correlation studies have shown that the ratio of HMW to low-molecular-weight adiponectin is correlated with insulin sensitivity, and HMW adiponectin may mediate the insulin-sensitizing effects of thiazolidinedione in vivo (19,21–23). Interestingly, ∼50% of the newly synthesized adiponectin protein is retained in the ER and degraded by the proteasome (24,25), suggesting a critical role of ER homeostasis in its maturation. Indeed, the formation of HMW adiponectin requires complex posttranslational modifications as well as extensive chaperone activities in the ER (26), such as ER protein 44 (ERp44) (25), endoplasmic oxidoreductin-1–like (ERO1-Lα) (27), and disulfide bond oxidoreductase A–like protein (DsbA-L) (28).
In this study, we demonstrate that overexpression of XBP1s in adipocytes improves systemic glucose homeostasis in vivo, which is associated with elevated levels of HMW adiponectin in both the circulation and white adipose tissue (WAT). Indeed, XBP1s directly regulates the expression of a subset of ER chaperones including glucose-regulated protein 78 kDa (GRP78), protein disulfide isomerase family A, member 6 (PDIA6), ERp44, and DsbA-L in adipocytes, all of which are known to be involved in adiponectin multimerization. Thus, although undoubtedly XBP1s regulates other signaling pathways in vivo, XBP1s may act as an important regulator of adiponectin maturation in adipocytes.
Research Design and Methods
Mice
The XBP1s cDNA fragment with N-terminal 3× hemagglutinin (HA)-tag was ligated into the pWhere-aP2p vector, which contains a 5.4-kb aP2 promoter flanked by two H19 chromatin insulators to block position effect at the integration sites on the chromosome (29). Linearized construct by PacI was used to generate transgenic (TG) mice on the C57BL/6J background by the Transgenic Animal Facility at Cornell University. Adiponectin (Adipoq)−/− mice (stock 0028195) and ob/+ mice (stock 000632) on the C57BL/6J background were purchased from The Jackson Laboratory. XBP1s-TG ob/ob (hereafter TG-ob) mice and wild-type ob/ob (hereafter WT-ob) littermates were generated by initially breeding ob/+ with TG mice and then TG;ob/+ to WT;ob/+. TG-Adipoq−/− mice were generated by three generational crosses: initially Adipoq−/− with TG, then TG;Adipoq+/− with WT;Adipoq+/−, and finally TG;Adipoq−/− with WT;Adipoq−/−. The low-fat diet (LFD) consisting of 13% fat, 67% carbohydrate, and 20% protein (Teklad 2914; Harlan Teklad) was used throughout this study. All animal procedures were approved by the Cornell International Animal Care and Use Committee (#2007-0051).
RNA Extraction, RT-PCR, Quantitative PCR, and Microarray
RNA extraction from WAT, RT-PCR, and quantitative PCR (qPCR) were carried out as described (10). Primer sequences are listed in Supplementary Table 2. Microarray and data analysis were performed as described (30). The microarray data set has been submitted to the National Center for Biotechnology Information’s Gene Expression Omnibus (GSE36031).
Primary Adipocytes, Stromal Vascular Cells, and Macrophage Separation
Primary adipocytes and stromal vascular cells (SVCs) were isolated from WAT as previously described (30). Adipose-resident primary macrophages were purified from SVCs after incubating with anti–CD11b-biotin and streptavidin magnetic beads using the EasySep Magnet (Stem Cell Technologies). Isolated cells were resuspended in appropriate buffer for RNA or protein analysis, and the purity was confirmed by flow cytometry.
Protein Lysates, Immunoprecipitation, and Western Blot
Protein lysate, cytosol and nuclear protein extraction, immunoprecipitation, and Western blots were carried out as described (10,30). A total of 600 μg of total protein, 540 μg of cytosol protein, and 120 μg of nuclear protein from WAT of TG and TG-ob mice were subjected to immunoprecipitation with HA agarose. Eluted protein samples were analyzed by Western blot for HA-XBP1s using anti-XBP1 antibody (Santa Cruz Biotechnology). IRE1α phosphorylation was measured by the Phos-tag method as we recently described (10,31,32). Antibodies used in this study were listed in Supplementary Table 1. Quantitation of Western blots was performed using the ImageLab software on the ChemiDOC XRS+ system (Bio-Rad).
Transmission Electron Microscopy
Epididymal fat was fixed with 4% formaldehyde, 2.5% glutaraldehyde, and 0.02% picric acid in 100 mmol/L sodium cacodylate buffer for 3 h at room temperature. After washing with 100 mmol/L sodium cacodylate buffer, tissues were treated for 1 h with 1% osmium tetroxide and 1.5% potassium ferrocyanide and then for 1 h with 1.5% aqueous uranyl acetate. The rest steps were performed by Cornell Electron Microscopy and Histology and Optical Microscopy Core Facilities at Weill Cornell Medical College. Briefly, after dehydration in ethanol, tissues were treated through acetonitrile and then embedded in EMbed-812 resin (Electron Microscopy Sciences). Ultrathin sections were collected on EM grids, contrasted with lead citrate, and observed by using a JEOL 100 CX-II transmission electron microscope at an operating voltage of 80 kV (Jeol). Digital images were captured using a Veleta cooled CCD (SIS-Olympus).
Adipose Tissue Histology
Epididymal fat was fixed in 10% formaldehyde, embedded in paraffin, and sectioned by the Cornell Histology Core Facility. Hematoxylin and eosin–stained pictures were taken using the Axiovert 200M microscope (Zeiss). The cross-sectional area of each adipocyte in each field was measured using image analysis software NIS-Elements D (Nikon).
Metabolic Phenotyping
For glucose tolerance test (GTT), mice were injected intraperitoneally with 1 to 2 g glucose/kg body weight (BW) following an overnight fast; for insulin tolerance test (ITT), mice were injected intraperitoneally with 1–4 U insulin/kg BW following a 4-h fast. Blood glucose levels were measured using the One-Touch glucometer (LifeScan, Inc.) before injection and at 15, 30, 60, 90, and 120 min postinjection. Serum hormone levels were measured using the Bio-Plex Pro Diabetes 10-Plex Assay and Bio-Plex MAGPIX Multiplex Reader (Bio-Rad) per the manufacturer’s protocol. Serum adiponectin and leptin levels were measured using ELISA kits from Millipore and Crystal Chem, respectively, per the supplier’s protocol. Daily food intake was measured continuously for 6 days with mice individually housed and rested for 1 day.
Assays of Adiponectin Complexes
Sucrose sedimentation was carried out as described in (15). A total of 10 μl of serum or 400 μl of culture medium was loaded on 5–20% sucrose gradient in a total of 2 mL, which was spun at 55,000 rpm for 4 h at 4°C in a TLS55 rotor (Beckman Coulter). Fourteen gradient fractions were sequentially retrieved from the top of the gradient and analyzed by Western blot. Gel-filtration separation of adiponectin complexes in serum was carried out using a Superdex 200 10/30 column (GE Healthcare Biosciences) as previously described (28). Fractions (200 μl each) were collected and analyzed by Western blot for adiponectin.
Chromatin Immunoprecipitation
Chromatin immunoprecipitation assay was conducted as previously described with some modifications (10). Briefly, minced epididymal fat was cross-linked by 1% formaldehyde and stopped by the addition of glycine to a final concentration of 0.125 mol/L. Fat tissue was homogenized in buffer containing 25 mmol/L HEPES, 1.5 mmol/L MgCl2, 10 mmol/L KCl, 0.5% Nonidet P-40, 1 mmol/L dithiothreitol, and protease inhibitors (Sigma-Aldrich). Nuclei collected by centrifugation was resuspended in 50 mmol/L HEPES, 140 mmol/L NaCl, 1 mmol/L EDTA, 1% Triton X-100, 0.1% sodium deoxycholate, 0.1% SDS, and protease inhibitors. Samples were sonicated, precleared with protein A agarose (Invitrogen), and incubated with 2 μg of immunoglobulin G (IgG; Santa Cruz Biotechnology) or XBP1 antibody (sc-7160X; Santa Cruz Biotechnology). A total of 50 μl of 30% salmon sperm DNA–saturated protein A agarose (Invitrogen) was added to recover immune complexes for 2 h. Immunoprecipitates were washed and eluted. Cross-links were reversed, and samples were incubated in 0.5 mmol/L EDTA, 1 mmol/L Tris (pH 6.5), and 10 μg/mL proteinase K (Invitrogen) at 45°C for 1 h. Samples were purified using a PCR Purification Kit (Qiagen) and assayed by qPCR. Primer sequences are in Supplementary Table 2.
In Vitro 3T3-L1 Adipocyte Assays
3T3-L1 preadipocytes were maintained in DMEM supplemented with 10% FBS (HyClone) and 1% penicillin/streptomycin and differentiated as previously described (10). Plasmids encoding XBP1s (10) or small interfering RNA sequences for XBP1 (10) and DsbA-L (28) were introduced into fully differentiated 3T3-L1 adipocytes (day 7) by electroporation based on a standard protocol (33). Briefly, mature adipocytes were trypsinized and resuspended in Dulbecco's phosphate-buffered saline. A total of 5 × 10⁶ cells were transfected with 100–200 μg plasmid expressing enhanced green fluorescent protein or XBP1s via electroporation. Cells were plated into collagen I–coated six-well plates (Fisher Scientific) and incubated at 37°C in complete media for 16 h. After two washes with PBS, fresh DMEM with 0.5% BSA was added to the cell. Two hours later, medium was harvested for adiponectin complex analysis using sucrose gradient sedimentation, and cells were snap-frozen for qPCR or Western blot.
Luciferase Reporter Assay
Luciferase assays were performed as previously described (10). Promoters were cloned into the pGL3 vector (Promega) from mouse genomic DNA using Pfu polymerase (Clontech). The length of the promoter was decided based on the position of putative XBP1s binding site ACGT: pGL3–DsbA-Lp-luc (−300 to +1); pGL3–Erdj4p-luc (−200 to +35); and pGL3-Pdia6p-luc (−122 to +35). +1 is the transcription start site.
Statistical Analysis
Comparisons between groups were made using the Student t test. P < 0.05 was considered statistically significant. Regression analysis was performed using GraphPad Prism software (GraphPad).
Results
Generation of Fat-Specific XBP1s TG Mice
Both total Xbp1 and Xbp1s transcripts were significantly reduced in WAT of ob/ob mice compared with those in lean controls (Fig. 1A); this reduction was specific to adipocytes and not observed in adipose-derived SVCs (Fig. 1B). As a positive control, a key inflammatory gene Tnfa encoding tumor necrosis factor-α was increased in both adipocytes and SVCs of WAT with obesity (Fig. 1A and B). Similar data were obtained in the diet-induced obese model (Fig. 1C). Multiple attempts to detect protein levels of XBP1s in adipose tissues of lean or obese animals have failed, even with nuclear fractionation, in line with the notion that XBP1s is highly unstable (34).
Figure 1.
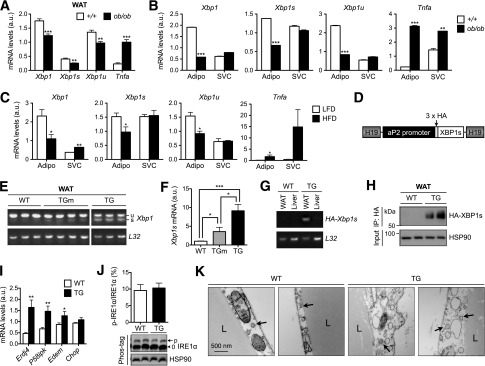
Generation of adipocyte-specific XBP1s TG mice. A: qPCR analysis in WAT of 20-week-old lean (+/+) and obese (ob/ob) female mice (n = 6). B: qPCR analysis in primary adipocytes (Adipo) and SVCs isolated from WAT of 18-week-old lean (+/+) and obese (ob/ob) male mice (representative of three independent experiments). C: qPCR analysis in Adipo and SVCs isolated from WAT of 25-week-old females fed LFD or high-fat diet (HFD) (n = 3 mice). D: The diagram of the transgene construct in which HA-XBP1s is driven by adipocyte-specific aP2 promoter flanked by the H19 chromatin insulators. E: RT-PCR analysis of Xbp1 transcripts in WAT. F: qPCR analysis in WAT of WT (n = 6), TGm (n = 3), and TG (n = 6) females. G: RT-PCR analysis of WAT and liver using transgene-specific primers to demonstrate tissue specificity. H: Western blot analysis of HA-XBP1s protein in WAT following immunoprecipitation (IP) with HA-agarose. I: qPCR analysis of XBP1s target genes Erdj4, P58ipk, and Edem and nontarget gene Chop in WAT of WT and TG mice (n = 6). J: Western blot analysis of phospho-IRE1α (p-IRE1α) using Phos-tag gel in WAT of 17-week-old males (n = 6) with quantitation shown at top. 0, nonphosphorylated IRE1α. K: Transmission electron microscopy images of WAT of WT and TG mice. Arrows point to the ER. Gene expression levels in qPCR analysis were normalized to ribosomal gene L32, which is also used as a loading control in the RT-PCR assay. Data are shown as mean ± SEM. *P < 0.05; **P < 0.01; ***P < 0.001 by Student t test. a.u., arbitrary unit; L, lipid droplet.
To further understand the role of XBP1s in adipose tissue, we generated adipocyte-specific XBP1s-TG mice by placing the XBP1s coding sequence under the control of an adipose-specific aP2/FABP4 promoter and flanked by the H19 chromatin insulators (Fig. 1D). We showed earlier that this targeting system with aP2 promoter effectively targets transgene expression in adipocytes with very little, if any, expression in macrophages (29) (Fig. 4B). Two TG lines were established with nine- and threefold more Xbp1s mRNA in WAT than WT littermates (Fig. 1E and F), termed TG and TGm (moderate expression), respectively. The tissue-specific expression was confirmed using RT-PCR with primers specific for the transgene (Fig. 1G). XBP1s protein level remained very low in WAT of TG mice, requiring immunoprecipitation to detect the protein (Fig. 1H). Pointing to the specificity of the transgene, known XBP1s target genes including ER-localized DnaJ homolog 4 (Erdj4), P58ipk, and Edem were upregulated in WAT of TG mice, but not Chop, a target of another UPR branch protein kinase RNA-like ER kinase (PERK) (Fig. 1I). Overexpression of XBP1s had no effect on IRE1α phosphorylation (Fig. 1J), suggesting that XBP1s overexpression does not affect ER stress in adipocytes. This was further confirmed by transmission electron microscopy analysis of epididymal adipocytes in which ER morphology seemed comparable between TG and WT mice (Fig. 1K).
Figure 4.

Improved glucose homeostasis and elevated HMW adiponectin in TG ob/ob mice. A: Western blot analysis of HA-XBP1s protein in whole-cell lysates (Total), cytosol (Cyt), and nucleus (Nuc) of WAT from 13-week-old TG and TG-ob males following immunoprecipitation (IP) with HA-agarose. Quantitation shown below with total and cytosol HA-XBP1s normalized to HSP90 and nuclear HA-XBP1s normalized to CREB. * indicates a nonspecific band. B: qPCR analysis in primary adipocytes (Adipo), SVCs, and macrophages (MΦ) isolated from WAT of 12-week-old females as determined by qPCR (n = 3). C: BWs of 9-week-old males (n = 5–8). D: GTT of mice in C with 1 g glucose/kg BW. Right: AUC analysis. E: BWs of 12-week-old females (n = 4). F: ITT of mice in E with 4 U insulin/kg BW and AUC analysis (right). G: Adipoq mRNA levels in WAT of 14-week-old females (n = 4–6 each). H: Nonreducing Western blots of adiponectin (ADPN) complexes in the serum following velocity-based sucrose-gradient fractionation with quantitation shown on the right (n = 3). Fractions were pooled together as indicated. I: Regression analysis of growth curves of males (left) and females (right) of WT-ob and TG-ob mice. J: Representative picture of mice at the age of 40 weeks. K: Daily food intake of 35-week-old WT-ob (n = 5) and TG-ob (n = 7) males. Data are shown as mean ± SEM. *P < 0.05; **P < 0.01; ***P < 0.001 by Student t test. a.u., arbitrary unit; l.e., longer exposure; LMW, low–molecular weight; wk, week.
Improved Systemic Glucose Homeostasis in TG Mice
Mice fed an LFD grew normally, and at the age of 16 weeks, two male cohorts exhibited no differences in body and epididymal WAT weights (Fig. 2A and B) with comparable adipocyte cell size (Fig. 2C). TG mice demonstrated improved systemic glucose tolerance and insulin sensitivity (Fig. 2D and F), while TGm mice with much lower XBP1s expression did not exhibit elevated expression of known XBP1s target genes nor significant improvement of glucose tolerance (Supplementary Fig. 1). Indeed, linear regression analysis suggested significant positive correlation of Xbp1s expression levels with glucose tolerance (Fig. 2E). This was further confirmed by analysis of insulin-stimulated AKT phosphorylation at serine 473, which was significantly enhanced in both the liver and WAT of TG mice, and to a lesser extent in skeletal muscle (Fig. 2G–I). These metabolic changes were uncoupled from pancreatic and gut hormones as serum levels of insulin, glucagon, ghrelin, gastric inhibitory polypeptide, and glucagon-like peptide 1 were comparable between the WT and TG littermates (Fig. 2J). Taken together, we conclude that adipocyte-specific XBP1s overexpression improves systemic glucose homeostasis and insulin sensitivity.
Figure 2.
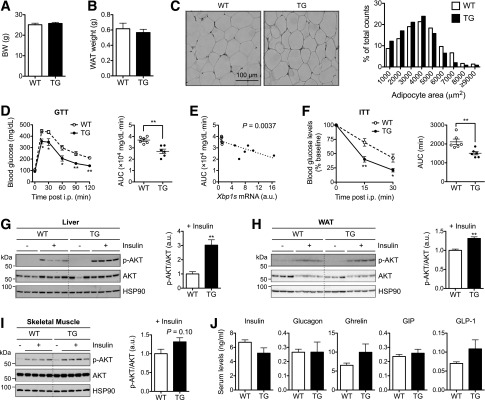
Improved glucose homeostasis in TG mice on LFD. BW (A) and epididymal WAT weight (B) of 16-week-old WT and TG male mice (n = 6). C: Representative hematoxylin and eosin images of WAT sections. Right: Quantitation of adipocyte cell size (n = 300 cells each). D: GTT in 16-week-old males (n = 6) with 1.5 g glucose/kg BW. Right: Area under the curve (AUC) analysis. E: Linear regression analysis of AUC in GTT (D) plotted to Xbp1s expression levels in WAT determined by qPCR (n = 6 each). F: ITT in 15-week-old WT and TG males (n = 6) with 1.5 U insulin/kg BW. Right: AUC analysis. Western blot analysis of phospho-AKT (p-AKT) (S473) in the liver (G), WAT (H), and skeletal muscle (I) of mice with or without intraperitoneal (i.p.) insulin (1 units/kg BW) for 30 min. HSP90 is a loading control. G–I, right: Quantitation of p-AKT/AKT with insulin injection (n = 4). J: Serum levels of pancreatic hormones (insulin and glucagon) and gut hormones (ghrelin, gastric inhibitory polypeptide [GIP], and glucagon-like peptide 1 [GLP-1]) determined by the multiplex assay (n = 4–5). Data are mean ± SEM. *P < 0.05; **P < 0.01 by Student t test. a.u., arbitrary unit.
Increased Circulating HMW Adiponectin in TG Mice
We reasoned that the systemic beneficial effect of adipocyte XBP1s is likely due to altered endocrine function of adipocytes. While leptin, resistin, and plasminogen activator inhibitor-1 (PAI-1) showed no significant changes (Fig. 3A), circulating adiponectin levels was significantly increased by ∼50% in TG mice (Fig. 3B). This increase was not due to the transcriptional upregulation of Adipoq mRNA (Fig. 3C). In line with this observation, overexpression of XBP1s in fully differentiated 3T3-L1 adipocytes did not increase Adipoq mRNA level (Fig. 3D), suggesting that Adipoq is not a direct transcriptional target of XBP1s.
Figure 3.
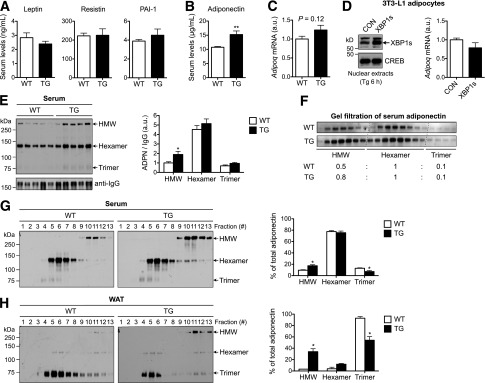
Elevated adiponectin multimerization in TG lean mice. A: Serum levels of adipokines leptin, resistin, and PAI-1. Leptin was measured in 12-week-old mice (n = 11–12), while resistin and PAI-1 levels were measured in 20-week-old mice (n = 4–5 mice). B: Serum adiponectin levels of 17-week-old males (n = 12 each). C: Adipoq mRNA levels in WAT of 17-week-old WT and TG males determined by qPCR (n = 11–12). D: Western blot analysis of XBP1s in 3T3-L1 adipocytes acutely overexpressing green fluorescent protein (CON) or XBP1s. To visualize XBP1s, cells were treated with thapsigargin (Tg) for 6 h. Right: qPCR analysis of Adipoq mRNA levels in 3T3-L1 adipocytes (without Tg treatment). E: Nonreducing Western blot analysis (left) and quantitation (right) of adiponectin (ADPN) complexes in the serum. Serum IgG levels were used as loading controls for normalization. F: Western blot analysis of adiponectin complexes in the serum following gel-filtration chromatography. Relative abundance of different forms of adiponectin shown at bottom. G: Nonreducing Western blots of adiponectin complexes in the serum following velocity-based sucrose-gradient fractionation (n = 5). Quantitation shown on the right. H: Representative nonreducing Western blots of adiponectin complexes in the WAT following velocity-based sucrose-gradient fractionation (n = 2). Data are shown as mean ± SEM. Gene expression levels in qPCR analysis were normalized to L32. *P < 0.05; **P < 0.01 by Student t test. a.u., arbitrary unit; CREB, cAMP-responsive element–binding protein.
In serum, adiponectin exists in different forms, with the HMW form being the most potent in insulin sensitization (14). We next determined the effect of XBP1s on the adiponectin complex using several complementary approaches, including nonreducing SDS-PAGE, gel-filtration chromatography, and sucrose-gradient–based velocity sedimentation followed by nonreducing SDS-PAGE. Indeed, all three methods consistently revealed that the HMW form of adiponectin was significantly elevated by ∼100% in the serum of TG mice (Fig. 3E–G). The increase in the serum HMW adiponectin form was correlated with the elevation in the HMW form of intracellular adiponectin in WAT of TG mice (Fig. 3H).
To further test the relationship between XBP1s and adiponectin, we analyzed adiponectin complex in XBP1s-expressing 3T3-L1 adipocytes. In line with the in vivo observations, acute expression of XBP1s increased HMW complex in the culture medium by >50% (Supplementary Fig. 2A). XBP1s had no effect on adipocyte differentiation as judged by Oil Red O staining (not shown) and measured by the mRNA level of adipocyte marker aP2 (Supplementary Fig. 2B). Taken together, these results suggest that ectopic expression XBP1s in adipocytes increases the formation of HMW adiponectin in lean mice.
Improved Glucose Homeostasis and Increased Circulating HMW Adiponectin in TG Obese Mice
To further study the role of adipocyte XBP1s in an obese model, we crossed TG mice onto the leptin-deficient background to generate adipocyte-specific TG-ob mice and their WT-ob littermates. Intriguingly, despite similar total protein levels, the amount of HA-XBP1s in the nuclear fraction was greatly reduced in the WAT of TG-ob mice compared with that of lean TG mice, indicating an impairment of nuclear translocation of XBP1s in WAT of obese mice (Fig. 4A). This observation is reminiscent of a previous report showing that nuclear translocation of XBP1s is reduced in the liver of obese mice (35).
Overexpression of XBP1s in TG-ob mice significantly increased the expression of its target genes (Erdj4, P58ipk, and Edem) specifically in adipocytes, but not in SVCs or purified adipose-resident CD11b+ macrophages (Fig. 4B), further confirming that the transgene expression is largely limited to adipocytes in WAT. At the age of 9–12 weeks, TG-ob mice had a similar BW to the WT-ob littermates, but exhibited improved glucose tolerance and insulin sensitivity (Fig. 4C–F). Adipoq mRNA level was increased in WAT of TG-ob compared with WT-ob mice, but remained 50% lower than that in WT lean mice (Fig. 4G). Serum levels of HMW adiponectin were increased by ∼50% in the serum of TG-ob compared with WT-ob mice, reaching a level similar to that of WT lean animals (Fig. 4H).
An earlier study showed that adiponectin-TG ob/ob mice gain more weight than ob/ob littermates (36). Consistently, both male and female TG-ob mice became more obese than WT-ob littermates starting at 20 weeks of age, gaining an average of 15% more BW (Fig. 4I and J). Some even reached 90–100 g in BW. This difference in BW was not due to food intake (Fig. 4K). Taken together, we conclude that adipocyte-specific XBP1s increases circulating HMW adiponectin in ob/ob mice.
Adipocyte XBP1s Promotes Glucose Homeostasis via Adiponectin
To provide direct evidence for the role of adiponectin in XBP1s effect in vivo, we crossed TG mice with adiponectin-deficient (Adipoq−/−) mice to generate TG-Adipoq−/− and WT-Adipoq−/− littermates (Fig. 5A). The BWs of WT-Adipoq−/− and TG-Adipoq−/− mice on LFDs were comparable at the age of 14 weeks (Fig. 5B). Strikingly, loss of adiponectin abolished the insulin-sensitizing effect of adipocyte XBP1s (Fig. 5C). Thus, the effect of adipocyte XBP1s on systemic glucose homeostasis is mediated by adiponectin.
Figure 5.
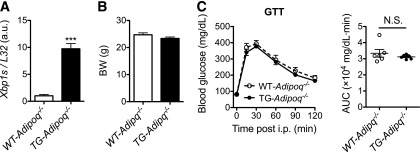
Adipocyte XBP1s affects systemic glucose tolerance via adiponectin. A: qPCR analysis of Xbp1s in WAT of 14-week-old males (n = 4). B: BWs of 14-week-old males (n = 6). C: GTT of mice in B with 1 g glucose/kg BW (left) and AUC analysis (right). Data are shown as mean ± SEM. ***P < 0.001; N.S., not significant by Student t test.
Global Transcriptional Profiling of XBP1s Targets in Adipocytes
We next performed nonbiased Affymetrix analyses of global gene expression in WAT. Out of >21,000 genes, ∼125 genes were significantly upregulated >1.5-fold (P < 0.01) in WAT of TG versus WT littermates. The Ingenuity Pathway Analysis revealed that two major categories of pathways were significantly upregulated: “response to unfolded protein” and “lipid metabolism” (Fig. 6A). Several genes involved in the ER folding process were modestly but significantly increased, including well-known ER chaperones and folding enzymes Erdj4, Pdia6, P58ipk/DnaJ homolog subfamily C, member 3, and Grp78/Hspa5 (Fig. 6B). In contrast, genes associated with the PERK pathway (Chop and Ero1l) were not altered. Thus, these data demonstrate that XBP1s regulates the expression of a subset of ER chaperones in adipocytes.
Figure 6.

XBP1s-mediated global transcriptional regulation in WAT. A: Gene ontology analysis of top 10 pathways that are upregulated by XBP1s in WAT of 16-week-old WT and TG males on LFD under ad libitum. B: Heat map showing changes in UPR genes organized by the ratio of signals in TG to signals in WT in each functional category with average level of WT signals set as 1. Genes increased over 1.2-fold in TG mice are shown. n = 4 mice/cohort. ERAD, ER-associated protein degradation.
XBP1s-Mediated Regulation of the Expression of ER Chaperones Involved in Adiponectin Maturation
Intriguingly, among the top genes identified by microarray analysis included a list of genes known to be involved in adiponectin maturation in the ER (26), such as Grp78, Pdia6, ERp44, and DsbA-L. Although XBP1s is known to control the transcription of Grp78 and Pdia6 in cultured cell lines (37), it was unknown whether these genes are bona fide targets of XBP1s in adipocytes. Indeed, qPCR and Western blot analyses confirmed that these chaperones were upregulated both at mRNA and protein levels in WAT of TG mice (Fig. 7A and B). A similar observation was made in TG-ob mice (Fig. 7C). The upregulation of these chaperones were limited in the adipocytes but not in SVCs or adipose-resident CD11b+ macrophages of TG-ob mice (Fig. 7D). Linear regression analyses showed the positive association of Xbp1s level with the expression levels of Grp78, Pdia6, ERp44, and DsbA-L in WAT (Fig. 7E). In vitro, acute expression of XBP1s in 3T3-L1 adipocytes also increased the expression of these chaperones (Supplementary Fig. 2C and D). Moreover, XBP1s was detected at the proximal promoters of Grp78, Pdia6, and ERp44 genes in WAT of TG mice (Fig. 7F) and activated reporter luciferase driven by the proximal promoters of Pdia6, ERp44, and DsbA-L genes in human embryonic kidney 293T cells (Fig. 7G). Lastly, as a proof-of-principle, reduction of DsbA-L using small interfering RNA attenuated the proportion of HMW adiponectin in XBP1s-expressing 3T3-L1 adipocytes (Supplementary Fig. 3), suggesting that XBP1s' effect on HMW adiponectin is mediated in part through the chaperone. Taken together, our data demonstrate that XBP1s directly regulates the expression of Grp78, Pdia6, ERp44, and DsbA-L, which are involved in adiponectin maturation in the ER.
Figure 7.
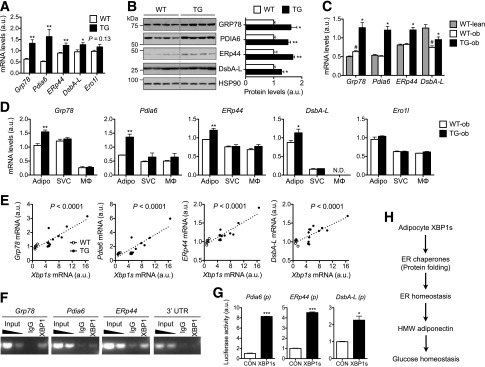
XBP1s regulates the expression of genes involved in adiponectin maturation. qPCR (A) and Western blot (B) analyses in WAT of 18-week-old WT and TG males (n = 6). B: Quantitation after normalization to HSP90 shown on right. C: qPCR analysis in WAT of 14-week-old females (n = 4–6). #P < 0.05 comparing WT-ob vs. WT-lean; *P < 0.05 comparing TG-ob vs. WT-ob. D: qPCR analysis in primary adipocytes (Adipo), SVCs, and macrophages (MΦ) purified from WAT of 12-week-old WT-ob and TG-ob females (n = 3). E: Linear regression analyses of mRNA levels plotted to Xbp1s expression levels in WAT as determined by qPCR. n = 6 for WT and 12 for TG mice. F: Chromatin immunoprecipitation–PCR analysis of XBP1s targets in WAT of TG mice using the anti-XBP1 antibody. Nonspecific IgG and 3′ untranslated region (UTR) were included as negative controls. G: Luciferase assays showing XBP1s-mediated transactivation of target gene promoters (p) in human embryonic kidney 293T cells. Gene expression levels in qPCR analysis were normalized to L32. Data are shown as mean ± SEM. H: The working model for XBP1s-mediated adiponectin multimerization and glucose homeostasis. *P < 0.05; **P < 0.01; ***P < 0.001 by Student t test. a.u., arbitrary unit; CON, control; N.D., not detected.
Discussion
Defects in the folding and secretion of HMW adiponectin are associated with hypoadiponectinemia and insulin resistance in humans (14). Extensive efforts are currently being made to elevate adiponectin levels to treat various human diseases (14,38). Our data demonstrate that XBP1s may act as an important regulator of adiponectin maturation into HMW complexes. This is the first study linking XBP1s to adiponectin maturation (Fig. 7H). Our conclusions are further supported by the phenotypes of adiponectin gain-of-function mouse models, in which hypoglycemia and insulin-sensitizing effects have been reported in several lean and obese models (24,36,39–42).
XBP1s, a potent transcription factor, is involved in diverse cellular functions and processes. It has been implicated in the ER expansion in differentiating plasma cells (43,44) and the pancreas and salivary glands (45), gluconeogenesis and lipogenesis in hepatocytes (5–7,46), adipogenesis (10–12), inflammation in macrophages (47) and Paneth cells (48), and control of autophagy in the nervous system (49). Our data further highlight an important role of XBP1s in adiponectin complex formation in adipocytes. In addition, as shown in Fig. 6A, XBP1s in adipocytes may have additional roles in energy metabolism, such as lipid metabolism and brown fat cell differentiation, all of which are interesting future directions and require further investigations.
It is important to note that in WAT of our TG animals, ER stress is not affected as judged by IRE1α phosphorylation and ER morphology. Additionally, the PERK pathway as measured by downstream target genes including Chop and Ero1l is not activated in TG mice. Thus, the conclusions from this study cannot be extrapolated to interpret situations under ER stress condition. Indeed, drug-induced ER stress activation reduces the secretion of all forms of adiponectin (50), largely due to the translational suppression by the PERK pathway.
A recent study showed that adipocyte-specific XBP1-deficient mice exhibit no obvious metabolic phenotypes under either LFD or high-fat diets (11). Total adiponectin levels in the serum are not changed but whether HMW adiponectin is altered in vivo remains unclear (11). The lack of dramatic phenotype in adipocyte-specific XBP1 knockout mice is surprising, given the dramatic phenotypes of XBP1 heterozygotic mice (4) as well as XBP1-deficient mice in other tissues or cell types such as B cells, hepatocytes, macrophages, and neurons (45–47,49,51). This points to a cell-type–specific requirement of XBP1s. Nonetheless, this does not mean that XBP1s or the IRE1α–XBP1s pathway of the UPR plays no metabolic function in adipocyte or adiponectin biology, rather we would argue that the loss of XBP1 in adipocytes may be well-tolerated in vivo likely due to the activation of other UPR branches or autophagy (49). Indeed, knockdown of XBP1 by 90% had no effect on chaperone gene expression, and the proportion of secreted HMW adiponectin in differentiated 3T3-L1 adipocytes (Supplementary Fig. 4). In contrast to the adipocyte-specific XBP1 knockout mice or cells, our gain-of-function mouse and cell models show that XBP1s is sufficient to promote adiponectin multimerization, leading to improved systemic glucose and insulin homeostasis in both lean and genetically obese animals. Our gain-of-function models are not contrived as XBP1 levels, both mRNA and protein, are highly responsive to hormones, cytokines, and ER stress (3,9,34,43,51–53). Hence, similar to several recent gain-of-function studies of XBP1s (5,8,35), our data may provide key insights into the pathophysiological role of XBP1 in mature adipocytes and as a drug target of small molecules in metabolic syndromes.
Speculatively, we propose that the effect of adipocyte XBP1s on adiponectin may be mediated collectively by changing the overall ER homeostasis and folding capacity. ER proteostasis in adipocytes may be important for adiponectin folding and thereby systemic insulin sensitivity. Targeting ER capacity in adipocytes as a whole, also known as proteostasis (54), in adipocytes may be a viable means to increase circulating adiponectin in human patients with hypoadiponectinemia and type 2 diabetes. Indeed, collapse of proteostasis is considered as a major pathophysiological paradigm that has recently emerged in cystic fibrosis, neurodegeneration, and aging (54). As several compounds that can enhance proteostasis (i.e., proteostasis regulators) have entered preclinical trials (54), understanding the physiological and pathological role of proteostasis in adipocytes will likely broaden our knowledge on the pathologies of metabolic syndrome and shed light on drug design for disease intervention.
Supplementary Material
Article Information
Acknowledgments. The authors thank Yin He for technical assistance and proofreading the manuscript, Hana Kim and Yewei Ji for technical assistance, and other members of the Qi laboratory for helpful discussion and assistance; and the Cornell Transgenic, Histology, and Electron Microscopy Core Facilities for assistance in processing samples.
Funding. H.S. is the recipient of a Genomics Scholarship from the Center for Vertebrate Genomics, Cornell University. L.Q. is a recipient of the American Diabetes Association Junior Faculty and Career Development Award. This study is supported by National Institutes of Health grant R01-DK-08852, American Diabetes Association grants 07-JF-48 and 1-12-CD-04, a seed grant from Center for Vertebrate Genomics (to L.Q.), grant R01-DK-76902 (to F.L.), and the Netherlands Nutrigenomics Centre (to S.K.).
Duality of Interest. No potential conflicts of interest relevant to this article were reported.
Author Contributions. H.S. designed the study and wrote the manuscript and researched data. L.Y., M.L., S.X., F.L., and S.K. researched data. Y.L. contributed to discussion. L.Q. designed the study and wrote the manuscript. L.Q. is the guarantor of this work and, as such, had full access to all the data in the study and takes responsibility for the integrity of the data and the accuracy of the data analysis.
Footnotes
This article contains Supplementary Data online at http://diabetes.diabetesjournals.org/lookup/suppl/doi:10.2337/db13-1067/-/DC1.
S.X. is currently affiliated with the Department of Immunology, School of Medical Science and Laboratory Medicine, Jiangsu University, Zhenjiang, China.
References
- 1.Hotamisligil GS. Endoplasmic reticulum stress and the inflammatory basis of metabolic disease. Cell 2010;140:900–917 [DOI] [PMC free article] [PubMed] [Google Scholar]
- 2.Walter P, Ron D. The unfolded protein response: from stress pathway to homeostatic regulation. Science 2011;334:1081–1086 [DOI] [PubMed] [Google Scholar]
- 3.Hetz C, Martinon F, Rodriguez D, Glimcher LH. The unfolded protein response: integrating stress signals through the stress sensor IRE1α. Physiol Rev 2011;91:1219–1243 [DOI] [PubMed] [Google Scholar]
- 4.Ozcan U, Cao Q, Yilmaz E, et al. Endoplasmic reticulum stress links obesity, insulin action, and type 2 diabetes. Science 2004;306:457–461 [DOI] [PubMed] [Google Scholar]
- 5.Zhou Y, Lee J, Reno CM, et al. Regulation of glucose homeostasis through a XBP-1-FoxO1 interaction. Nat Med 2011;17:356–365 [DOI] [PMC free article] [PubMed] [Google Scholar]
- 6.So JS, Hur KY, Tarrio M, et al. Silencing of lipid metabolism genes through IRE1α-mediated mRNA decay lowers plasma lipids in mice. Cell Metab 2012;16:487–499 [DOI] [PMC free article] [PubMed] [Google Scholar]
- 7.Wang S, Chen Z, Lam V, et al. IRE1α-XBP1s induces PDI expression to increase MTP activity for hepatic VLDL assembly and lipid homeostasis. Cell Metab 2012;16:473–486 [DOI] [PMC free article] [PubMed] [Google Scholar]
- 8.Deng Y, Wang ZV, Tao C, et al. The Xbp1s/GalE axis links ER stress to postprandial hepatic metabolism. J Clin Invest 2013;123:455–468 [DOI] [PMC free article] [PubMed] [Google Scholar]
- 9.Sha H, He Y, Yang L, Qi L. Stressed out about obesity: IRE1α-XBP1 in metabolic disorders. Trends Endocrinol Metab 2011;22:374–381 [DOI] [PMC free article] [PubMed] [Google Scholar]
- 10.Sha H, He Y, Chen H, et al. The IRE1alpha-XBP1 pathway of the unfolded protein response is required for adipogenesis. Cell Metab 2009;9:556–564 [DOI] [PMC free article] [PubMed] [Google Scholar]
- 11.Gregor MF, Misch ES, Yang L, et al. The role of adipocyte XBP1 in metabolic regulation during lactation. Cell Rep 2013;3:1340–1349 [DOI] [PMC free article] [PubMed] [Google Scholar]
- 12.Cho YM, Kim DH, Kwak SN, Jeong SW, Kwon OJ. X-box binding protein 1 enhances adipogenic differentiation of 3T3-L1 cells through the downregulation of Wnt10b expression. FEBS Lett 2013;587:1644–1649 [DOI] [PubMed] [Google Scholar]
- 13.Han J, Murthy R, Wood B, et al. ER stress signalling through eIF2α and CHOP, but not IRE1α, attenuates adipogenesis in mice. Diabetologia 2013;56:911–924 [DOI] [PMC free article] [PubMed] [Google Scholar]
- 14.Turer AT, Scherer PE. Adiponectin: mechanistic insights and clinical implications. Diabetologia 2012;55:2319–2326 [DOI] [PubMed] [Google Scholar]
- 15.Pajvani UB, Du X, Combs TP, et al. Structure-function studies of the adipocyte-secreted hormone Acrp30/adiponectin. Implications fpr metabolic regulation and bioactivity. J Biol Chem 2003;278:9073–9085 [DOI] [PubMed] [Google Scholar]
- 16.Tsao TS, Murrey HE, Hug C, Lee DH, Lodish HF. Oligomerization state-dependent activation of NF-kappa B signaling pathway by adipocyte complement-related protein of 30 kDa (Acrp30). J Biol Chem 2002;277:29359–29362 [DOI] [PubMed] [Google Scholar]
- 17.Waki H, Yamauchi T, Kamon J, et al. Impaired multimerization of human adiponectin mutants associated with diabetes. Molecular structure and multimer formation of adiponectin. J Biol Chem 2003;278:40352–40363 [DOI] [PubMed] [Google Scholar]
- 18.Fisher FM, Trujillo ME, Hanif W, et al. Serum high molecular weight complex of adiponectin correlates better with glucose tolerance than total serum adiponectin in Indo-Asian males. Diabetologia 2005;48:1084–1087 [DOI] [PubMed] [Google Scholar]
- 19.Pajvani UB, Hawkins M, Combs TP, et al. Complex distribution, not absolute amount of adiponectin, correlates with thiazolidinedione-mediated improvement in insulin sensitivity. J Biol Chem 2004;279:12152–12162 [DOI] [PubMed] [Google Scholar]
- 20.Ye R, Scherer PE. Adiponectin, driver or passenger on the road to insulin sensitivity? Mol Metab 2013;2:133–141 [DOI] [PMC free article] [PubMed] [Google Scholar]
- 21.Tonelli J, Li W, Kishore P, et al. Mechanisms of early insulin-sensitizing effects of thiazolidinediones in type 2 diabetes. Diabetes 2004;53:1621–1629 [DOI] [PubMed] [Google Scholar]
- 22.Basu R, Pajvani UB, Rizza RA, Scherer PE. Selective downregulation of the high molecular weight form of adiponectin in hyperinsulinemia and in type 2 diabetes: differential regulation from nondiabetic subjects. Diabetes 2007;56:2174–2177 [DOI] [PubMed] [Google Scholar]
- 23.Aso Y, Yamamoto R, Wakabayashi S, et al. Comparison of serum high-molecular weight (HMW) adiponectin with total adiponectin concentrations in type 2 diabetic patients with coronary artery disease using a novel enzyme-linked immunosorbent assay to detect HMW adiponectin. Diabetes 2006;55:1954–1960 [DOI] [PubMed] [Google Scholar]
- 24.Combs TP, Pajvani UB, Berg AH, et al. A transgenic mouse with a deletion in the collagenous domain of adiponectin displays elevated circulating adiponectin and improved insulin sensitivity. Endocrinology 2004;145:367–383 [DOI] [PubMed] [Google Scholar]
- 25.Wang ZV, Schraw TD, Kim JY, et al. Secretion of the adipocyte-specific secretory protein adiponectin critically depends on thiol-mediated protein retention. Mol Cell Biol 2007;27:3716–3731 [DOI] [PMC free article] [PubMed] [Google Scholar]
- 26.Wang ZV, Scherer PE. DsbA-L is a versatile player in adiponectin secretion. Proc Natl Acad Sci USA 2008;105:18077–18078 [DOI] [PMC free article] [PubMed] [Google Scholar]
- 27.Qiang L, Wang H, Farmer SR. Adiponectin secretion is regulated by SIRT1 and the endoplasmic reticulum oxidoreductase Ero1-L alpha. Mol Cell Biol 2007;27:4698–4707 [DOI] [PMC free article] [PubMed] [Google Scholar]
- 28.Liu M, Zhou L, Xu A, et al. A disulfide-bond A oxidoreductase-like protein (DsbA-L) regulates adiponectin multimerization. Proc Natl Acad Sci USA 2008;105:18302–18307 [DOI] [PMC free article] [PubMed] [Google Scholar]
- 29.Qi L, Saberi M, Zmuda E, et al. Adipocyte CREB promotes insulin resistance in obesity. Cell Metab 2009;9:277–286 [DOI] [PMC free article] [PubMed] [Google Scholar]
- 30.Sun S, Xia S, Ji Y, Kersten S, Qi L. The ATP-P2X7 signaling axis is dispensable for obesity-associated inflammasome activation in adipose tissue. Diabetes 2012;61:1471–1478 [DOI] [PMC free article] [PubMed] [Google Scholar]
- 31.Yang L, Xue Z, He Y, Sun S, Chen H, Qi L. A Phos-tag-based approach reveals the extent of physiological endoplasmic reticulum stress. PLoS ONE 2010;5:e11621. [DOI] [PMC free article] [PubMed] [Google Scholar]
- 32.Qi L, Yang L, Chen H. Detecting and quantitating physiological endoplasmic reticulum stress. Methods Enzymol 2011;490:137–146 [DOI] [PMC free article] [PubMed] [Google Scholar]
- 33.Okada S, Mori M, Pessin JE. Introduction of DNA into 3T3-L1 adipocytes by electroporation. Methods Mol Med 2003;83:93–96 [DOI] [PubMed] [Google Scholar]
- 34.Calfon M, Zeng H, Urano F, et al. IRE1 couples endoplasmic reticulum load to secretory capacity by processing the XBP-1 mRNA. Nature 2002;415:92–96 [DOI] [PubMed] [Google Scholar]
- 35.Park SW, Zhou Y, Lee J, et al. The regulatory subunits of PI3K, p85alpha and p85beta, interact with XBP-1 and increase its nuclear translocation. Nat Med 2010;16:429–437 [DOI] [PMC free article] [PubMed] [Google Scholar]
- 36.Kim JY, van de Wall E, Laplante M, et al. Obesity-associated improvements in metabolic profile through expansion of adipose tissue. J Clin Invest 2007;117:2621–2637 [DOI] [PMC free article] [PubMed] [Google Scholar]
- 37.Lee AH, Iwakoshi NN, Glimcher LH. XBP-1 regulates a subset of endoplasmic reticulum resident chaperone genes in the unfolded protein response. Mol Cell Biol 2003;23:7448–7459 [DOI] [PMC free article] [PubMed] [Google Scholar]
- 38.Phillips SA, Kung JT. Mechanisms of adiponectin regulation and use as a pharmacological target. Curr Opin Pharmacol 2010;10:676–683 [DOI] [PubMed] [Google Scholar]
- 39.Berg AH, Combs TP, Du X, Brownlee M, Scherer PE. The adipocyte-secreted protein Acrp30 enhances hepatic insulin action. Nat Med 2001;7:947–953 [DOI] [PubMed] [Google Scholar]
- 40.Combs TP, Berg AH, Obici S, Scherer PE, Rossetti L. Endogenous glucose production is inhibited by the adipose-derived protein Acrp30. J Clin Invest 2001;108:1875–1881 [DOI] [PMC free article] [PubMed] [Google Scholar]
- 41.Yamauchi T, Kamon J, Waki H, et al. Globular adiponectin protected ob/ob mice from diabetes and ApoE-deficient mice from atherosclerosis. J Biol Chem 2003;278:2461–2468 [DOI] [PubMed] [Google Scholar]
- 42.Yamauchi T, Kamon J, Waki H, et al. The fat-derived hormone adiponectin reverses insulin resistance associated with both lipoatrophy and obesity. Nat Med 2001;7:941–946 [DOI] [PubMed] [Google Scholar]
- 43.Iwakoshi NN, Lee AH, Vallabhajosyula P, Otipoby KL, Rajewsky K, Glimcher LH. Plasma cell differentiation and the unfolded protein response intersect at the transcription factor XBP-1. Nat Immunol 2003;4:321–329 [DOI] [PubMed] [Google Scholar]
- 44.Reimold AM, Iwakoshi NN, Manis J, et al. Plasma cell differentiation requires the transcription factor XBP-1. Nature 2001;412:300–307 [DOI] [PubMed] [Google Scholar]
- 45.Lee AH, Chu GC, Iwakoshi NN, Glimcher LH. XBP-1 is required for biogenesis of cellular secretory machinery of exocrine glands. EMBO J 2005;24:4368–4380 [DOI] [PMC free article] [PubMed] [Google Scholar]
- 46.Lee AH, Scapa EF, Cohen DE, Glimcher LH. Regulation of hepatic lipogenesis by the transcription factor XBP1. Science 2008;320:1492–1496 [DOI] [PMC free article] [PubMed] [Google Scholar]
- 47.Martinon F, Chen X, Lee AH, Glimcher LH. TLR activation of the transcription factor XBP1 regulates innate immune responses in macrophages. Nat Immunol 2010;11:411–418 [DOI] [PMC free article] [PubMed] [Google Scholar]
- 48.Kaser A, Lee AH, Franke A, et al. XBP1 links ER stress to intestinal inflammation and confers genetic risk for human inflammatory bowel disease. Cell 2008;134:743–756 [DOI] [PMC free article] [PubMed] [Google Scholar]
- 49.Hetz C, Thielen P, Matus S, et al. XBP-1 deficiency in the nervous system protects against amyotrophic lateral sclerosis by increasing autophagy. Genes Dev 2009;23:2294–2306 [DOI] [PMC free article] [PubMed] [Google Scholar]
- 50.Zhou L, Liu M, Zhang J, Chen H, Dong LQ, Liu F. DsbA-L alleviates endoplasmic reticulum stress-induced adiponectin downregulation. Diabetes 2010;59:2809–2816 [DOI] [PMC free article] [PubMed] [Google Scholar]
- 51.Hetz C. The unfolded protein response: controlling cell fate decisions under ER stress and beyond. Nat Rev Mol Cell Biol 2012;13:89–102 [DOI] [PubMed] [Google Scholar]
- 52.Yoshida H, Matsui T, Yamamoto A, Okada T, Mori K. XBP1 mRNA is induced by ATF6 and spliced by IRE1 in response to ER stress to produce a highly active transcription factor. Cell 2001;107:881–891 [DOI] [PubMed] [Google Scholar]
- 53.Christis C, Fullaondo A, Schildknegt D, Mkrtchian S, Heck AJ, Braakman I. Regulated increase in folding capacity prevents unfolded protein stress in the ER. J Cell Sci 2010;123:787–794 [DOI] [PMC free article] [PubMed] [Google Scholar]
- 54.Powers ET, Morimoto RI, Dillin A, Kelly JW, Balch WE. Biological and chemical approaches to diseases of proteostasis deficiency. Annu Rev Biochem 2009;78:959–991 [DOI] [PubMed] [Google Scholar]
Associated Data
This section collects any data citations, data availability statements, or supplementary materials included in this article.