Abstract
Endoplasmic reticulum (ER) stress is increased in obesity and is postulated to be a major contributor to many obesity-related pathologies. Little is known about what causes ER stress in obese people. Here, we show that insulin upregulated the unfolded protein response (UPR), an adaptive reaction to ER stress, in vitro in 3T3-L1 adipocytes and in vivo, in subcutaneous (sc) adipose tissue of nondiabetic subjects, where it increased the UPR dose dependently over the entire physiologic insulin range (from ∼35 to ∼1,450 pmol/L). The insulin-induced UPR was not due to increased glucose uptake/metabolism and oxidative stress. It was associated, however, with increased protein synthesis, with accumulation of ubiquitination associated proteins, and with multiple posttranslational protein modifications (acetylations, methylations, nitrosylations, succinylation, and ubiquitinations), some of which are potential causes for ER stress. These results reveal a new physiologic role of insulin and provide a putative mechanism for the development of ER stress in obesity. They may also have clinical and therapeutic implications, e.g., in diabetic patients treated with high doses of insulin.
Introduction
Obesity greatly increases the risk for several medical problems including type 2 diabetes, hypertension, atherogenic dyslipidemia, and nonalcoholic fatty liver disease, conditions collectively called the metabolic syndrome (1). Exactly how obesity leads to these problems remains incompletely understood. On one hand, it has been established that increased release of fatty acids and proinflammatory cytokines from the expanded and dysfunctional adipose tissue plays an important role (2). On the other hand, mounting evidence supports a major role for endoplasmic reticulum (ER) stress. In the ER, proteins are folded into their native confirmation and undergo posttranslational modifications, which are important for their structure and activity. When protein folding is disturbed, ER stress develops and several signal transduction pathways, collectively called the unfolded protein response (UPR), are activated to restored ER homeostasis (3). The evidence linking ER stress with obesity and obesity-related pathologies is strong and consists of 1) the fact that ER stress is increased in adipose tissue of obese rodents (4–6) and humans (7,8) and decreases with weight loss (9) and 2) the fact that ER stress has been associated with several obesity-related pathologies including insulin resistance, type 2 diabetes, hypertension, nonalcoholic fatty liver disease, and abnormalities in lipid metabolism (4–6,10–14). However, little is known about what causes ER stress in obesity. Hypoxia and inflammation have been proposed as possible causes because they are present in adipose tissue of obese rodents and people and both have been shown to develop together with ER stress in adipose tissue (15,16). Other suspects are excess nutrient intake, the main cause for obesity, and the associated hyperinsulinemia.
Surprisingly, there is currently no information on effects of insulin on ER stress in human subjects despite the fact that hyperinsulinemia and ER stress are both common in obesity and that insulin has been shown to produce ER stress in vitro in cultured murine macrophages (17) and in human neuroblastoma cells (18). The objective of the current study, therefore, was to examine the effects of insulin on ER stress responses in vivo in human subcutaneous (sc) adipose tissue from healthy subjects and in vitro in 3T3-L1 adipocytes.
Research Design and Methods
Forty-four healthy subjects (30 males/14 females) were studied. Their characteristics are shown in Table 1. Informed written consent was obtained from all subjects after explanation of the nature, purpose, and potential risks of these studies. The study protocol was approved by the institutional review board of Temple University Hospital. None of the subjects had a family history of diabetes or other endocrine disorders or were taking medications. Their body weights were stable for at least 2 months before the studies. Subjects were admitted to Temple University Hospital’s Clinical Research Center on the evening before the studies. The studies began at ∼8:00 a.m. after an overnight fast with the subjects reclining in bed. A short polyethylene catheter was inserted into an antecubital vein for infusion of test substances. Another catheter was placed into the contralateral forearm vein for blood sampling. This arm was wrapped with a heating blanket (∼70°C) to arterialize venous blood.
Table 1.
Studies and study subjects
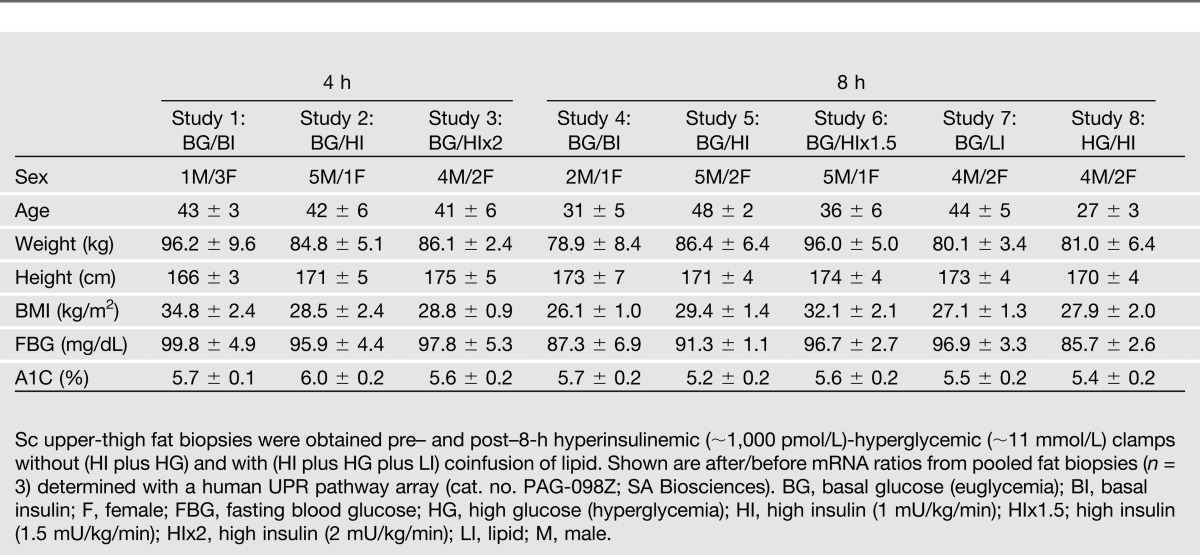
The following eight studies were performed (studies 1–3 were 4-h studies, and studies 4–8 were 8-h studies): 1) basal (postabsorptive) insulin (no insulin infusion)-euglycemic clamps (n = 4), 2) hyperinsulinemic (insulin infusion, 1 mU/kg min)-euglycemic clamps (n = 6), 3). hyperinsulinemic (insulin infusion, 2 mU/kg min)-euglycemic clamps (n = 6), 4) basal (postabsorptive) insulin (no insulin infusion)-euglycemic clamps (n = 3), 5) hyperinsulinemic (insulin infusion, 1 mU/kg min)-euglycemic clamps (n = 7), 6) hyperinsulinemic (insulin infusion, 1.5 mU/kg min)-euglycemic clamps (n = 6), 7) hypoinsulinemic-euglycemic clamps (n = 6), and 8) hyperinsulinemic (no insulin infusion)-hyperglycemic clamps (n = 6). In studies 1–6, euglycemia was maintained with variable-rate glucose infusions. In studies 1 and 4, basal insulin was maintained by euglycemia. Hypoinsulinemia in study 7 was produced by infusion of saline only, which resulted in a small decrease in blood glucose (from 5.1 to 4.6 mmol/L over 8 h) but a large decrease in plasma insulin (from 73 to 35 pmol/L). In study 8, endogenous hyperinsulinemia was the result of glucose infusions (to produce glucose levels of ∼14–16 mmol/L).
Fat Biopsies
Immediately before the infusions and again after 4 or 8 h, open sc fat biopsies were obtained from the lateral aspect of the upper thigh (∼15 cm. above the patella) under local anesthesia by a surgeon as previously described (7). The frozen fat was stored at −80°C until analyzed.
Real-Time PCR
Total RNA was isolated from frozen adipose tissues, and real-time PCR (RT-PCR) was performed with a SYBR Green One-Step qRT-PCR kit (cat. no. 75770; Affymetrix, Santa Clara, CA) and an Eppendorf Mastercycler ep realpex cycler as previously described (7). Primers used were human GRP78 sense gttggtggctcgactcgaat, antisense cgctacagcttcatctggg; human/mouse XBP1s sense ttgagaaccaggagttaa, antisense cctgcacctgctgcggact; human ATF4 sense ccacgttggatgacac, antisense ggcttcctatctccttcag; human CHOP sense ggagaaccaggaaacggaaac, antisense tcttcagctagctgtgccac; human PDIA3 sense ctgtggcatccatcttggct, antisense ggtgtggtcactgtaagaacct; human calreticulin (CRT) sense accctgagtacaagggtgag, antisense agatggtgccagacttgacc; human calnexin (CNX) sense cagaccagtggtatggagtat, antisense gactgacagtgccaccatct; human Nrf2 sense acacggtccacagctcatc, antisense tgcctccaaagaatgtcaatca; human HO-1 sense ctacttcccagaagagctgc, antisense ctgggcaatctttttgagcac; human vascular endothelial growth factor (VEGF)a sense cttccaggagtaccctgatg, antisense ctatgtgctggccttggtga; human CX3CL1 sense ccaccattctgccatctgac, antisense atgttgcatttcgtcacacc; human MCP-1 sense tcgcgagctatagaagaatca, antisense tgcttgtccaggtggtccat; human β-actin sense cagccatgtacgttgctatccagg, antisense aggtccagacgcaggatggcatg; human JNK1 (cat. no. PPH00720B; SuperArray); human IL-1β (cat. no. PPH00171B; SuperArray); TNF-1α (cat. no. PPH00341E; SuperArray); human/mouse 18S (cat. no. 5103G; Ambion); mouse ATF4 sense gagcttcctgaacagcgaagtg, antisense tggccacctccagatagtcatc; mouse GRP78 sense gcaaggattgaaattgagtccttc, antisense gagcggaacaggtccatgttca; mouse CHOP sense agtggcacagctagctgaag, antisense ctcagcatgtgcagtgcagt; and mouse INSIG sense tgcagatccagcggaatgt, antisense ccaggcggaggagaagatg. Triplicate samples were normalized with 18S or β-actin.
Western Blot Analysis
Proteins (30–80 µg) from adipose tissue lysates were separated by 10–14% gradient SDS-PAGE. The separated proteins were transferred to a nitrocellulose membrane in a semidry blotting chamber according to the manufacturer’s protocol (Bio-Rad, Hercules, CA).
Blots were blocked with 5% milk in Tris-buffered saline solution (pH 7.6) containing 0.05% Tween-20 and probed with a mouse antibody against human GRP78 from Bioscience (BD 610979) and the following rabbit anti-human antibodies from Santa Cruz Biotechnology (Santa Cruz, CA) at a concentration of 0.4 μg/mL: protein disulfide isomerase A3 (PDI) (cat. no. SC-20132), calreticulin CRT (cat. no. SC-11398), CNX (cat. no. SC-11397), and ATF4 (cat. no. SC-200); the mouse anti-human antibodies CHOP (cat. no. SC-7351), ATF6 (cat. no. SC-166659), and eIF2α (cat. no. SC-133132); the goat anti-human antibody p-eIF2α (cat. no. SC-12412), and the rabbit anti-human antibodies against JNK (cat. no. 9252; Cell Signaling) and against phospho-JNK (cat. no. 9251; Cell Signaling). Blots were incubated with primary antibody overnight at 4°C with gentle shaking and then incubated with a goat anti-rabbit or goat anti-mouse horseradish peroxidase–conjugated secondary antibody (1:10,000) for 1 h at room temperature. Blots were exposed using a chemiluminescent detection method (Immuno Cruz; Santa Cruz Biotechnology).
Proteomics Analysis
Cytoplasmic proteins from adipose tissue from subjects infused with and without insulin for 4 h were extracted under hypotonic conditions. These proteins were processed for gel electrophoresis–liquid chromatography–mass spectroscopy (GeLC-MS/MS) proteomics analysis as previously described (19).
Mass spectra data processing was performed using Mascot Distiller (version 2.4.3.3) with search and quantitation toolbox options. The generated deisotoped peak list was submitted to an in-house Mascot server 2.4 for searching against the Swiss-Prot database (version 2012_10 of 31 October 2012; 538,259 sequences and 189,901,164 residues). Mascot search parameters were set as follows: species Homo sapiens (20,255 sequences); enzyme, trypsin with maximal 2 missed cleavage; fixed modification, cysteine carbamidomethylation; variable modification, methionine oxidation; 0.60 Da mass tolerance for precursor peptide ions; and 0.4 Da for MS/MS fragment ions. All peptide matches were filtered using an ion score cutoff of 20. The results were analyzed with MS Data Miner. Label-free quantified proteins with >1.8-fold increases were selected and clustered by biological functions using ingenuity pathway analysis as recently described (20).
Posttranslational modifications were specifically analyzed using the following search parameters: maximal 4 missed cleavage with variable modification, acetyl (K), methyl (K), dimethyl (K), trimethyl (K), methyl (DE), methyl (C-term), carbamidomethyl (C), ubiquitinylation (GlyGly) (K), nitrosyl (C), methyl (R), dimethyl (R), oxidation (M), succinyl (K), phospho (ST), phospho (Y), ADP-Ribosyl (R), and deamidated (R); 0.90 Da mass tolerance for precursor peptide ions; and 0.6 Da for MS/MS fragment ions. Posttranslational modified peptides identified with score ≥35 were selected.
3T3-L1 Adipocyte Studies
Murine 3T3-L1 adipocytes were cultured and differentiated into adipocytes as previously described (21). Briefly, murine 3T3-L1 cells were grown to 100% confluence and then stimulated with FBS/Dulbecco’s modified Eagle’s medium (DMEM) containing 100 nmol/L insulin, 0.5 mmol/L 3-isobutyl-1-methyulxanthine, 0.25 μmol/L dexamethasone, and 1 μmol/L rosiglitazone for a 2-day differentiation. Cells were then maintained in FBS/DMEM with 100 nmol/L insulin for another 2 days, after which >90% of cells were mature adipocytes with accumulated fat droplets. Afterward, adipocytes were transferred to FBS/DMEM without insulin for a 40-h insulin washout period.
After, ∼106 mature 3T3-L1 adipocytes in each well of a sixwell plate were treated without or with 10 nmol/L human insulin (in DMEM with 0.2% BSA) for 6 h. Then, cells were homogenized with either Trizol or Roth lysis buffer, respectively, for mRNA or protein determination.
Analytical Procedures
Plasma glucose was measured with a glucose analyzer (YSI, Yellow Springs, OH). Insulin was determined in serum by RIA with a specific antibody that cross-reacts minimally (0.2%) with proinsulin (Linco, St. Charles, MO). 8-iso-prostaglandin-2α (8-iso-PGF-2α) was determined with a modification of the liquid chromatography–tandem mass spectrometry method described by Saenger et al. (22).
Statistical Analysis
All data are expressed as means ± SE. Post/prebiopsy ratios were compared using the paired two-tailed t test. Normality was tested with the Kolmogorov-Smirnov test. The Wilcoxon signed rank test was used to determine significance of the data that were not normally distributed.
Results
Raising Serum Insulin Increases UPR mRNA and Proteins
4-h Studies
For examination of effects of acute hyperinsulinemia on UPR markers, 4-h euglycemic (5.5 mmol/L) clamps were performed with three different insulin concentrations (basal ∼70 pmol/L, medium postprandial ∼480 pmol/L, and high postprandial ∼1,450 pmol/L) (Fig. 1A and B) in 16 healthy subjects (studies 1–3) (Table 1). UPR mRNA levels in sc fat biopsies, obtained before and after the clamps (post/pre mRNA ratios), did not change when basal insulin levels were maintained nor in response to medium postprandial hyperinsulinemia (∼480 pmol/L). However, GRP78, XBP1s, and ATF4 mRNA rose in response to high postprandial insulin levels (∼1,450 pmol/L) (Fig. 1C). Hyperinsulinemia had no significant effect on PDI-A3, CRT, or CNX mRNA levels.
Figure 1.
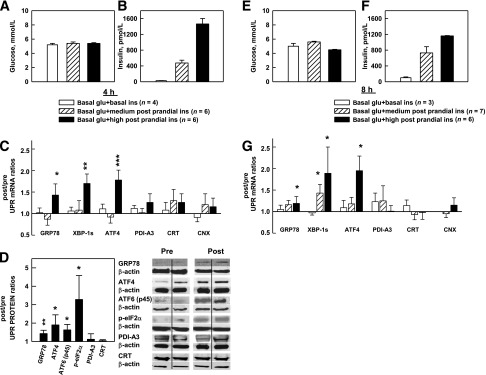
A–D: Effects of three levels of euglycemic-hyperinsulinemia for 4 h on UPR mRNA and proteins. A and B: Steady-state (120–240 min) plasma glucose and insulin concentrations in nondiabetic volunteers during three 4-h euglycemic clamp studies with three different steady-state insulin levels. C: Sc fat biopsies were obtained surgically immediately pre– and post–clamp studies. Shown are after/before mRNA ratios of six UPR markers in response to euglycemia associated with basal (n = 4, ∼70 pmol/L), medium postprandial (n = 6, ∼480 pmol/L), and high postprandial (n = 6, ∼1,450 pmol/L) insulin concentrations. Shown are the means ± SE of 18S normalized mRNA values. *P < 0.05, **P < 0.02, ***P < 0.01 compared with after/before ratios of 1.0. D: Mean of six after/before UPR protein ratios (left) and two representative Western blots each of the UPR proteins (right) in response to high postprandial insulin concentrations. Shown are means ± SE. *P < 0.05, **P < 0.02 compared with after/before ratios of 1.0 (paired Student t test). E–G: Effects of three levels of euglycemic-hyperinsulinemia for 8 h on UPR mRNA. E and F: Steady-state plasma glucose and insulin concentrations during three 8-h euglycemic clamp studies with three different steady-state insulin levels. G: Mean after/before mRNA ratios of 6 UPR markers in response to basal (n = 3), medium postprandial (n = 6), and high (n = 7) postprandial insulin concentrations. Shown are mean ± SE. *P < 0.05 compared with after/before ratios of 1.0 (paired Student t test). glu, glucose; ins, insulin.
Protein abundance (after/before ratios) of GRP78, ATF-4, ATF-6 (p45, the activated form), and phospho-eIF2α (the activated form of eIF2α) also rose in response to the high postprandial insulin levels (Fig. 1D).
8-h Studies
To examine effects of longer insulin infusions, we performed 8-h clamps in 16 healthy subjects (studies 4–6) (Table 1). Plasma glucose and insulin levels and mRNA responses were comparable with those in the 4-h studies.
Thus, acutely raising insulin for 4 h to high postprandial levels increased several UPR marker mRNAs and proteins. Prolonging exposure to insulin to 8 h had similar effects except for an increase in XBP1s mRNA at the medium postprandial insulin levels, which was not seen after 4 h. After/before mRNA ratios of the UPR markers measured were similar in 6 normal-weight (BMI <25 kg/m2), 13 overweight (BMI 25–30 kg/m2), and 12 obese (BMI >30 kg/m2) subjects receiving insulin infusions (data not shown).
Lowering Serum Insulin Decreases UPR mRNA and Proteins
To examine chronic effects of insulin on the UPR, we acutely lowered insulin in 6 healthy subjects (study 7) (Table 1). This was done by infusing saline for 8 h without supporting glucose levels. This resulted in a small decrease in plasma glucose (from 5.1 to 4.6 mmol/L, P < 0.01), which, although remaining within the normal range, nevertheless caused a >50% decline in basal serum insulin (from 75 to 35 pmol/L, P < 0.01) (Fig. 2A and B). In control studies (study 4) (Table 1), a decrease of plasma glucose and insulin was prevented, and basal levels of both were maintained by infusion of small amounts of glucose. The acute hypoinsulinemia resulted in a significant decrease in GRP78, XBP-1s, ATF-4, PDI-A3, and CRT after/before mRNA ratios (Fig. 2C), as well as similar decreases in after/before protein ratios (Fig. 2D).
Figure 2.
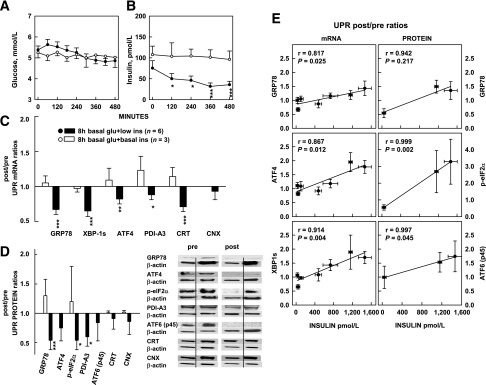
A–D: Effects of acute euglycemic-hypoinsulinemia on UPR mRNA and proteins. A and B: Plasma glucose and insulin concentrations during 8-h euglycemic-hypoinsulinemia and euglycemic-basal insulinemia. During the euglycemic-hypoinsulinemia studies, saline was infused without glucose. During the euglycemic-basal insulinemia studies, saline was infused with glucose. *P < 0.05, ***P < 0.01 compared with 0 min (paired Student t test). C: After/before mRNA ratios of six UPR markers in response to euglycemic-hypoinsulinemia and -basal insulinemia. *P < 0.05, **P < 0.02, ***P < 0.01 compared with the before and after ratios of 1.0. D: After/before protein ratios of UPR markers (left) in response to hypoinsulinemia (study 7) and basal insulinemia (study 4) and two representative Western blots (study 7) (right). Because of scarcity of tissue obtained from the euglycemic-basal insulin studies, only four of seven UPR protein measurements could be performed. Shown are means ± SE. *P < 0.05, ***P < 0.01 compared with after/before ratios of 1.0 (paired Student t test). E: Correlation between UPR mRNA or protein and serum insulin. Relationship between GRP78, ATF4, and XBP1s after/before mRNA ratios and serum insulin levels from seven euglycemic clamp studies (three 4-h and four 8-h studies) (left), and GRP 78, phospho-eIF2α, and ATF6 (p45) after/before protein ratios and serum insulin levels from three euglycemic clamp studies (one 4-h and two 8-h studies) (right). Shown are means ± SE of UPR makers (vertical bars) and insulin concentrations (horizontal bars). glu, glucose; ins, insulin.
Thus, acutely lowering insulin to below basal levels decreased UPR mRNA and proteins. These results showed that there had been postabsorptive UPR activity, which had been supported by basal insulin levels, and that lowering of this basal insulin support resulted in lowering of the UPR, thus providing evidence for long-term effects of insulin on the UPR. Combining results of the 4-h and 8-h studies revealed a close and dose-dependent relationship between insulin and UPR marker mRNA and proteins over the entire physiologic range of serum insulin concentrations (Fig. 2E).
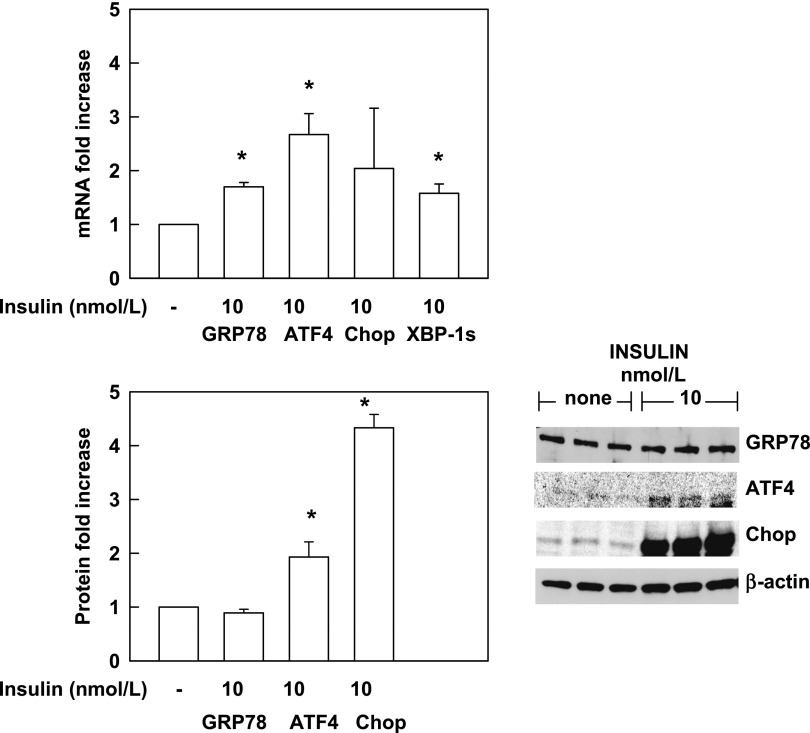
To confirm these in vivo insulin effects in an in vitro system, we incubated 3T3-L1 adipocytes without and with insulin (10 nmol/L) for 6 h. As seen in Fig. 3, insulin increased GRP78, ATF4, and XBP-1s mRNAs by 1.7-, 2.7-, and 1.6-fold, respectively (P < 0.001), and had similar effects on ATF4 and CHOP proteins, whereas GRP78 increased only with 100 nmol/L insulin (data not shown).
Figure 3.
Insulin increases UPR mRNA and proteins in 3T3-L1 adipocytes. Effect of 6-h incubations with insulin (10 nmol/L) or without insulin (-) on UPR mRNA (upper panel) and proteins (lower panel). Shown are means ± SE (n = 6). *P < 0.001 compared with no insulin.
Insulin Increased Protein Synthesis, Protein Ubiquitination, and Posttranslational Protein Modifications
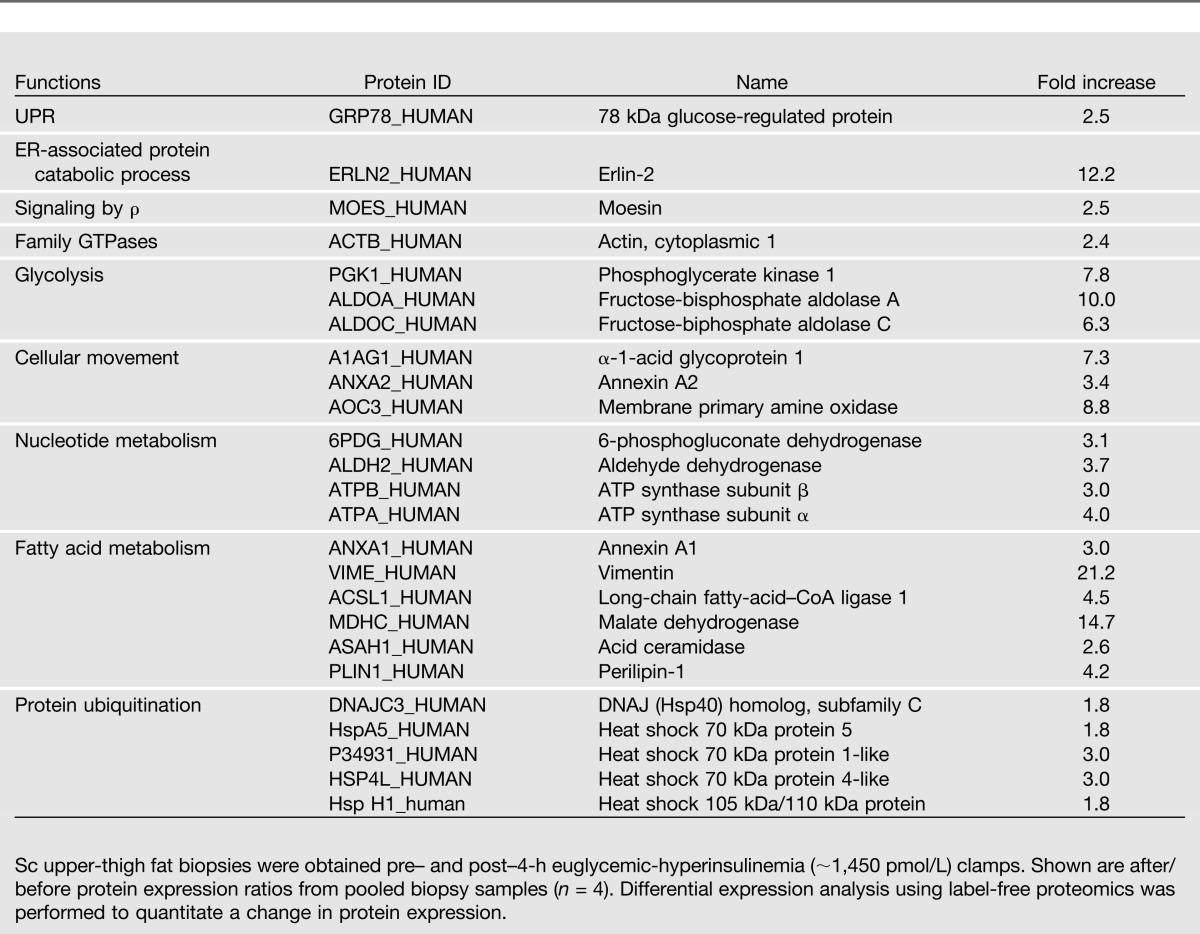
Insulin, by increasing protein synthesis, could have stimulated the UPR by generating an amount of nascent polypeptides large enough to exceed the ER folding capacity. This would produce ER stress via accumulation of unfolded/misfolded and ubiquitinated proteins. To test the effect of insulin on protein synthesis, we determined protein abundance by mass spectrometry in pooled fat biopsy samples taken pre- and post-exposure to 4 h of euglycemic-hyperinsulinemia from four of the six subjects in study 3 (Table 1). The results showed that 25 proteins increased from 1.8- to 21.2-fold in response to euglycemic-hyperinsulinemia. Among those proteins were five ubiquitination pathway proteins, which increased from 1.8- to 3.0-fold, suggesting accumulation of unfolded proteins (Table 2).
Table 2.
Increase in protein expression levels 4 h after insulin
To test for effects of insulin on ubiquitination of proteins, we performed immunoblots of fat biopsy samples obtained from four individual subjects before and after 4 h of euglycemic-hyperinsulinemia (∼1,500 pmol/L). The results showed that protein ubiquitination rose 3.4 ± 1.3-fold (P = 0.05) in response to insulin (Supplementary Fig. 1).
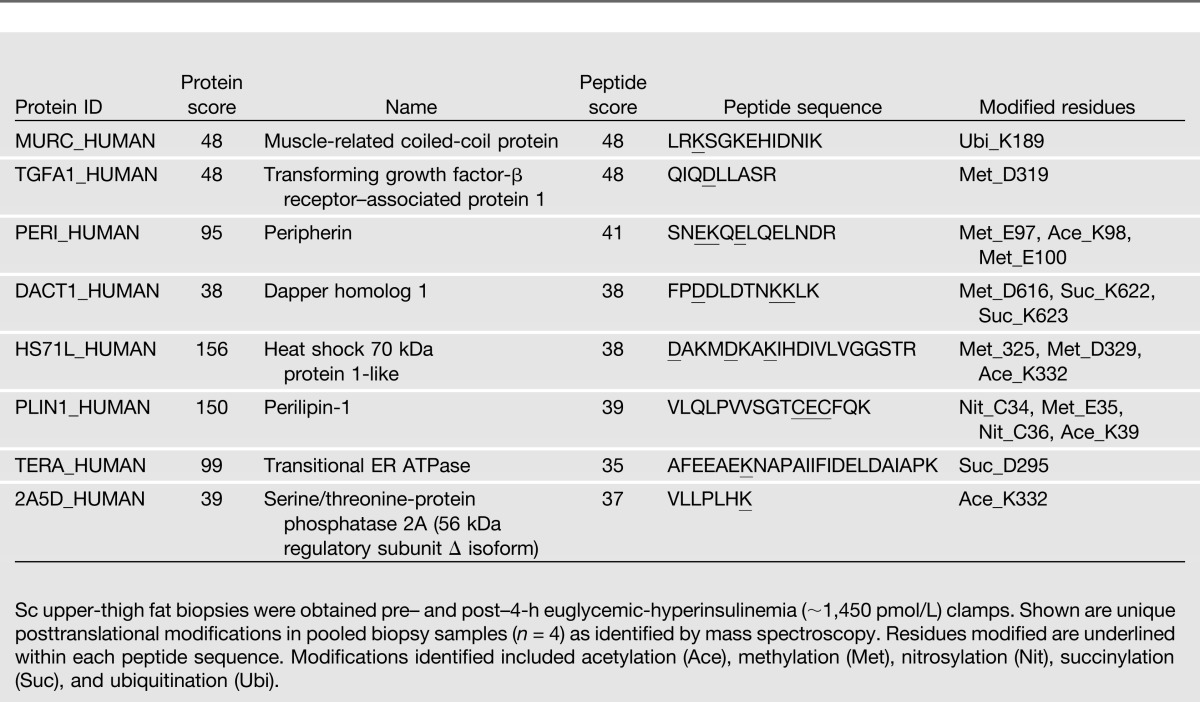
Using our mRNA and protein data, we performed a canonical pathway analysis with the Ingenuity Pathway Analysis program as recently described (20). This analysis showed a 13.5-fold increase in ER stress pathway activity (including increases in ERN1, XBP1, DNAJC3, ATF4, ATF6, Hsp A5, and eIF2α K3) and a 4.1-fold increase in the protein ubiquitination pathway (including increases in DNAJC3, Hsp A5, P34931, Hsp 1H, and Hsp A4L). Together, these results further support the concept of insulin stimulation of ER stress. In addition, we identified several insulin-induced posttranslational protein modifications including acetylations, methylations, nitrosylations, succinylations, and ubiquitinations in eight proteins (Table 3).
Table 3.
Insulin-induced protein posttranslational modifications
Insulin-Induced UPR Changes Were Not Associated With Changes in Glucose Uptake or Oxidation
Raising insulin increased glucose uptake as well as intracellular glucose metabolism. For instance, euglycemic-hyperinsulinemia (Fig. 4A and B) increased rates of glucose uptake by approximately ninefold (from ∼12 to ∼110 µmol/kg min) and carbohydrate oxidation rates by approximately fivefold (from ∼3 to ∼15 µmol/kg min). As an increase in glucose uptake/metabolism can produce ER stress via generation of reactive oxygen species (ROS) and changes in the intracellular redox state (23,24), we examined effects of glucose uptake on the UPR by comparing two studies with identical degrees of hyperinsulinemia but different rates of glucose uptake (studies 6 and 8) (Table 1) (Fig. 4B–D). Despite the large difference in glucose uptakes, however, there were no significant differences in UPR mRNA after/before ratios (Fig. 4E).
Figure 4.
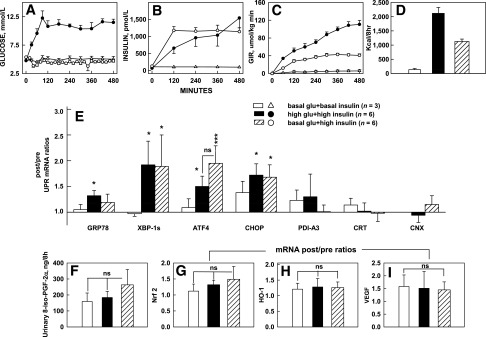
Effects of similar hyperinsulinemia but different glucose uptakes on UPR mRNA and oxidative stress markers. A–D: Plasma glucose and insulin concentrations, glucose infusion rates (GIR), and insulin-stimulated glucose uptakes (in kcal/8 h) during 8-h euglycemic-hyperinsulinemic and hyperglycemic-hyperinsulinemic clamps (studies 6 and 8) (Table 1) and euglycemic-basal insulinemic controls (study 4) (Table 1). Despite GIR and glucose uptakes, which were two times higher with hyperglycemic-hyperinsulinemia than with euglycemic-hyperinsulinemia, UPR mRNA levels were not different. E: After/before mRNA ratios of seven UPR markers. Shown are mean ± SE. *P < 0.05, ***P < 0.001 compared with after/before ratios of 1.0. F: Urinary excretion of 8-iso-PGF-2α. G–I: Adipose tissue after/before mRNA ratios of Nrf-2, HO-1, and VEGF. Shown are means ± SE. glu, glucose.
We also examined the effects of different rates of glucose uptakes on markers of ROS production and oxidative stress. Urinary excretion of 8-iso-PGF-2α, a sensitive and specific indicator of whole-body lipid peroxidation and oxidative stress (25), as well as adipose tissue Nrf-2, HO-1, and VEGF after/before mRNA ratios, all indicators of oxidative stress (26), also did not rise above basal in response to increased glucose uptakes in adipose tissue (Fig. 4F–I).
Since oxidative stress is known to activate the nuclear factor-κB (NF-κB) and JNK stress pathways (26), we examined effects of insulin-stimulated glucose uptake on adipose tissue mRNA expression of JNK1, phosphorylation (activation) of JNK1 to phospho-JNK1, and the NF-κB targets, TNF-α, IL-1β, MCP-1, and CX3CL1. Hyperinsulinemia induced a 10-fold increase in glucose uptake (from ∼100 to ∼1,000 kcal/8 h) but did not increase expression of any of these factors (Table 4).
Table 4.
Effect of hyperinsulinemia on inflammatory stress markers
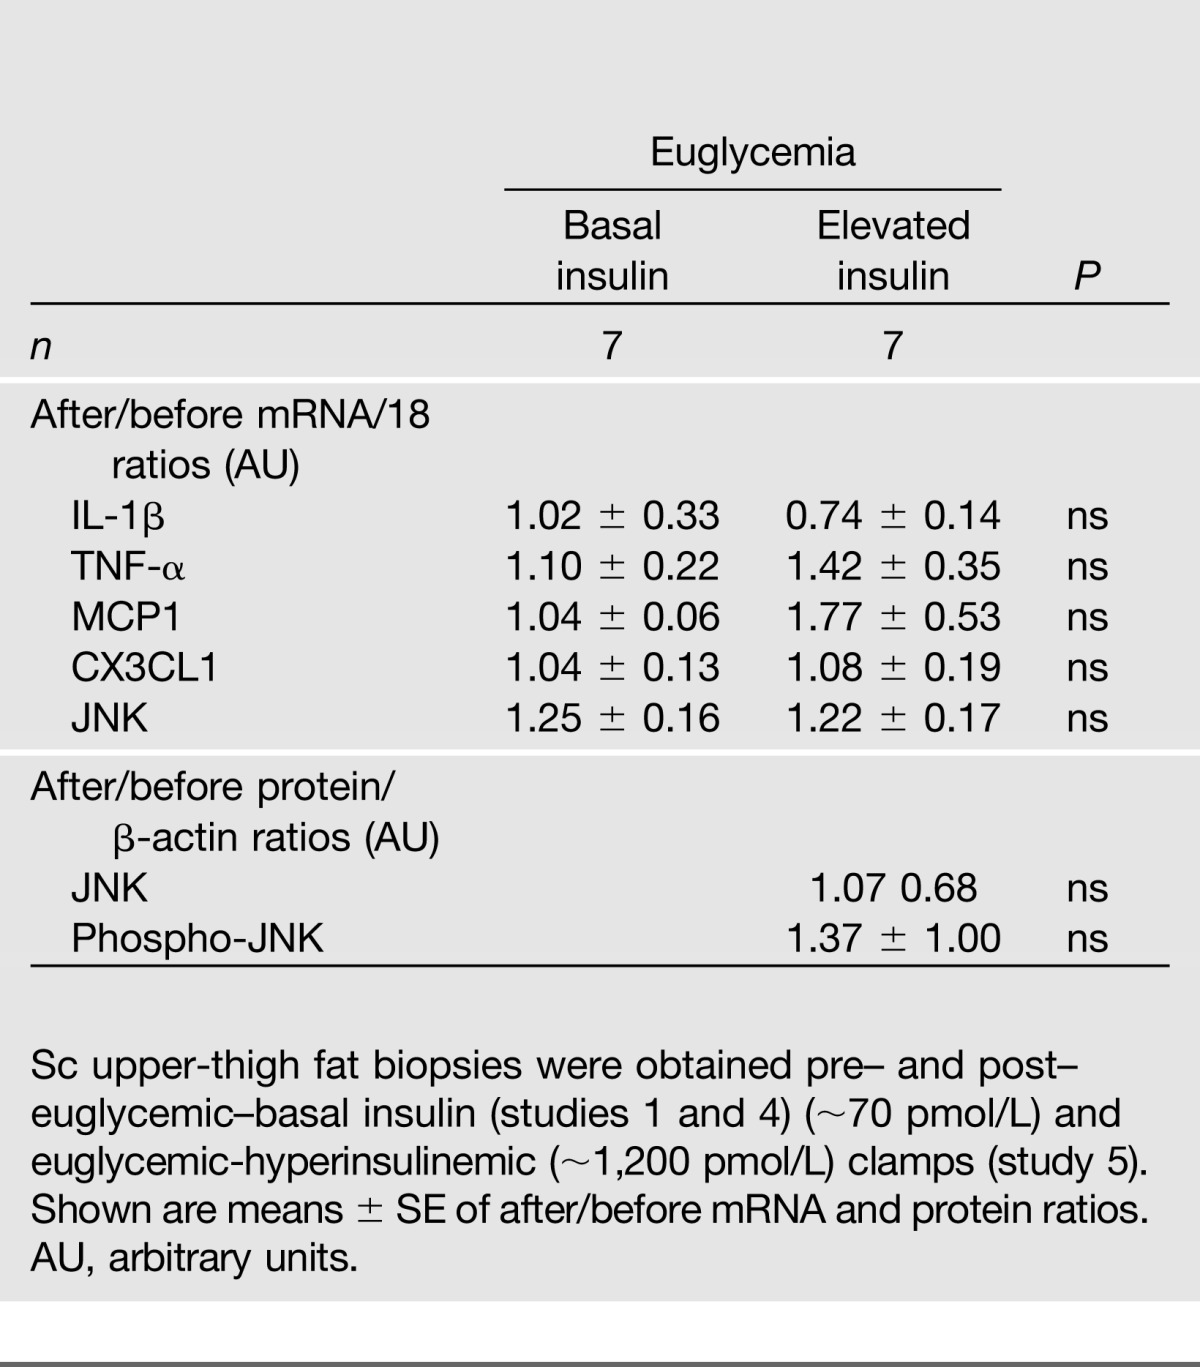
Thus, the observed insulin-induced increases in UPR mRNA and proteins in adipose tissue were unlikely to be associated with changes in glucose uptake or oxidative stress.
Discussion
Insulin Controls the UPR Dose Dependently
A main finding in this study was that insulin regulated several UPR marker mRNAs and proteins dose dependently over the entire range of physiologic serum insulin levels (from ∼35 to ∼1,450 pmol/L) in sc adipose tissue of nondiabetic subjects (Fig. 2E).
These results were supported by four studies showing that increasing serum insulin increased the UPR, by another study showing that lowering insulin action decreased the UPR, and by a canonical pathway analysis (with the Ingenuity Pathway Program [20]), using mRNA and protein data, which showed a 13.- fold increase in ER stress pathway activation (and a 4.1-fold increase in protein ubiquitination pathway activation [suggesting accumulation of unfolded or misfolded proteins]).
These UPR changes were caused by insulin rather than by other insulin-induced effects (e.g., changes in plasma free fatty acid levels), as evidenced by in vitro experiments, which showed that insulin increased UPR mRNA and proteins in 3T3-L1 adipocytes (Fig. 3).
Several other results of our in vivo studies are noteworthy: 1) the observation that UPR activity decreased when insulin was lowered to below basal levels indicated that basal (postabsorptive) UPR activity had been supported by basal insulin levels and, therefore, that insulin regulated the UPR long term as well as acutely; 2) the effect of insulin on UPR mRNA was fully established after 4 h and changed little after 8 h (Fig. 1); 3) insulin affected all three proximal ER stress sensor pathways (p-eIF2α and ATF4 for the PERK pathway, XBP-1s for IRE1, and ATF6 p45 for the ATF6 pathway); and 4) the responses were not uniform as CRT and CNX changed little or not at all, supporting the notion that the UPR is differentially regulated in response to variable metabolic demands (3).
We believe that these are the first data on in vivo effects of insulin on UPR markers in human subjects. They were obtained in adipose tissue, a tissue where ER stress was found in obese rodents to be very prominent, leading to its dysfunction and to many obesity-related pathologies (27). They are also in accord with a recent report from our laboratory that showed that insulin increased UPR markers in rat liver (28).
How Does Insulin Stimulate ER Stress Responses?
The dose-dependent UPR activation by insulin was accompanied by an equally dose-dependent stimulation of glucose uptake (and oxidation), which is known to increase intracellular ROS production and oxidative and ER stress (23,24,29). Thus, insulin could have increased ER stress and activated the UPR by increasing glucose uptake/metabolism and oxidative stress. However, when we compared changes in UPR markers during studies with similar hyperinsulinemia but markedly different rates of glucose uptake, higher glucose uptakes did not result in higher UPR mRNA (Fig. 4).
Other findings also did not support the notion that the observed insulin-induced UPR changes were caused by oxidative stress. Thus, higher insulin levels and glucose uptakes did not produce greater urinary excretion of 8-iso-PGF-2α, a sensitive and specific indicator of lipid peroxidation (25). They also did not increase Nrf-2, HO-1, or VEGF mRNA in adipose tissue, all indicators of oxidative stress (26), or increase expression of the NF-κB and JNK stress pathways (Table 4), which are known to be activated by oxidative stress (29,30). These findings are further supported by the lack of change of these proteins in our proteomic analysis.
Taken together, these results did not support a role for an insulin-stimulated increase in glucose uptake/metabolism as a cause for the increase in UPR in our studies. A likely reason for the absence of oxidative stress may be that the available antioxidant defenses were sufficient to prevent development of oxidative stress in response to the rather modest physiologic increases in glucose uptake (1,000–2,000 kcal/4–8 h).
On the other hand, our results support the notion that insulin caused ER stress by increasing protein synthesis, which could have resulted in an increase in un- or misfolded proteins and in accumulation of ubiquitinated proteins. Stimulation of protein synthesis and suppression of protein breakdown by insulin are well established (31,32). Here, we showed that insulin increased the abundance of a large number of proteins, including five involved in protein ubiquitination, between ∼2- and 21-fold (Table 2) and increased protein ubiquitination by ∼3-fold (Supplementary Fig. 1). Further, Ingenuity Pathway Analysis showed a 4.1-fold increase in ubiquitination pathway and a 13.5-fold increase in ER stress activity. Another new finding was that insulin produced multiple protein posttranslational modifications (Table 3). These results support the hypothesis that the synthesis of a large number of nascent polypeptides resulted in accumulation of un- or misfolded and ubiquitinated proteins and the presence of posttranslational protein modifications, some of which may have interfered with protein folding (3,33) and may have exceeded the ER folding capacity, initiating the UPR.
Our data do not rule out that insulin directly activated at least some part of the UPR. For instance, it has recently been reported that insulin can activate XBP1, i.e., the IRE1α sensor pathway of the ER (34,35). In that case, insulin would activate one part of the UPR proactively, i.e., even before the development of ER stress. This could occur in addition to the reactive, i.e., ER stress–initiated activation, shown in our studies. In fact, a combined proactive and reactive UPR activation would be of physiological advantage under conditions where a rise of insulin and insulin-induced ER stress are predictable, e.g., during a meal (36).
Another mechanism by which insulin could have increased ER stress may be inhibition of autophagy. Acute hyperinsulinemia, via mTorc1 activation, not only stimulates protein synthesis (Table 2) but also inhibits autophagy (37). Thus, by inhibiting an inhibitor of ER stress, insulin may have increased ER stress.
In summary, we have shown here that insulin in vivo and in vitro upregulated the UPR in human adipose tissue. The insulin-mediated UPR increase could not be explained by an increase in insulin-stimulated glucose uptake, oxidative stress, inflammation, or insulin resistance but was associated with an increase in protein synthesis, protein ubiquitination, and various posttranslational protein modifications. We conclude that acute physiological increases in circulating insulin produced a modest degree of ER stress and resulted in an increase in UPR, which, presumably, was sufficient to relieve the ER stress and prevented development of insulin resistance and inflammation. The effect on ER stress and the UPR of severe or long-lasting hyperinsulinemia, e.g., due to chronic excessive caloric intake or in diabetic patients who are treated with very high doses of insulin, remains to be explored. Under these conditions, the UPR may not be able to relieve the more severe ER stress, which then may result in chronically unrelieved ER stress and insulin resistance.
Supplementary Material
Article Information
Acknowledgments. The authors thank Maria Mozzoli, Karen Kresge, and Yan Chen (all Temple University School of Medicine) for excellent technical assistance; and Constance Harris Crews (Temple University School of Medicine) for typing the manuscript.
Funding. This work was supported by grants from the National Institutes of Health (R01-DK-58895 and DK-090588 to G.B.), a grant from the American Diabetes Association (1-10-Ct-06 to G.B.), and a grant from the Department of Defense (W81XWH-08-1-0729 to T.P.S.).
Duality of Interest. No potential conflicts of interest relevant to this article were reported.
Author Contributions. G.B. conceived all studies and wrote the manuscript. P.C., S.S., and T.P.S. performed and analyzed serum, urine, and biopsy samples and contributed to discussion. C.H., C.L.-J., and S.J. performed human studies, analyzed results, and contributed to discussion. K.J.W. and M.-L.L. performed and analyzed the in vitro studies and contributed to discussion. C.A.B. and S.M. performed and analyzed proteomic studies and contributed to discussion. G.B. is the guarantor of this work and, as such, had full access to all the data in the study and takes responsibility for the integrity of the data and the accuracy of the data analysis.
Footnotes
This article contains Supplementary Data online at http://diabetes.diabetesjournals.org/lookup/suppl/doi:10.2337/db13-0906/-/DC1.
See accompanying article, p. 841.
References
- 1.Reaven GM. Banting lecture 1988. Role of insulin resistance in human disease. Diabetes 1988;37:1595–1607 [DOI] [PubMed] [Google Scholar]
- 2.Boden G. Obesity, insulin resistance and free fatty acids. Curr Opin Endocrinol Diabetes Obes 2011;18:139–143 [DOI] [PMC free article] [PubMed] [Google Scholar]
- 3.Schröder M, Kaufman RJ. The mammalian unfolded protein response. Annu Rev Biochem 2005;74:739–789 [DOI] [PubMed] [Google Scholar]
- 4.Ozcan U, Cao Q, Yilmaz E, et al. Endoplasmic reticulum stress links obesity, insulin action, and type 2 diabetes. Science 2004;306:457–461 [DOI] [PubMed] [Google Scholar]
- 5.Hirosumi J, Tuncman G, Chang L, et al. A central role for JNK in obesity and insulin resistance. Nature 2002;420:333–336 [DOI] [PubMed] [Google Scholar]
- 6.Nakatani Y, Kaneto H, Kawamori D, et al. Involvement of endoplasmic reticulum stress in insulin resistance and diabetes. J Biol Chem 2005;280:847–851 [DOI] [PubMed] [Google Scholar]
- 7.Boden G, Duan X, Homko C, et al. Increase in endoplasmic reticulum stress-related proteins and genes in adipose tissue of obese, insulin-resistant individuals. Diabetes 2008;57:2438–2444 [DOI] [PMC free article] [PubMed] [Google Scholar]
- 8.Sharma NK, Das SK, Mondal AK, et al. Endoplasmic reticulum stress markers are associated with obesity in nondiabetic subjects. J Clin Endocrinol Metab 2008;93:4532–4541 [DOI] [PMC free article] [PubMed] [Google Scholar]
- 9.Gregor MF, Yang L, Fabbrini E, et al. Endoplasmic reticulum stress is reduced in tissues of obese subjects after weight loss. Diabetes 2009;58:693–700 [DOI] [PMC free article] [PubMed] [Google Scholar]
- 10.Lee AH, Scapa EF, Cohen DE, Glimcher LH. Regulation of hepatic lipogenesis by the transcription factor XBP1. Science 2008;320:1492–1496 [DOI] [PMC free article] [PubMed] [Google Scholar]
- 11.Flamment M, Kammoun HL, Hainault I, Ferré P, Foufelle F. Endoplasmic reticulum stress: a new actor in the development of hepatic steatosis. Curr Opin Lipidol 2010;21:239–246 [DOI] [PubMed] [Google Scholar]
- 12.Deng Y, Wang ZV, Tao C, et al. The Xbp1s/GalE axis links ER stress to postprandial hepatic metabolism. J Clin Invest 2013;123:455–468 [DOI] [PMC free article] [PubMed] [Google Scholar]
- 13.So J-S, Hur KY, Tarrio M, et al. Silencing of lipid metabolism genes through IRE1α-mediated mRNA decay lowers plasma lipids in mice. Cell Metab 2012;16:487–499 [DOI] [PMC free article] [PubMed] [Google Scholar]
- 14.Hasty AH, Harrison DG. Endoplasmic reticulum stress and hypertension - a new paradigm? J Clin Invest 2012;122:3859–3861 [DOI] [PMC free article] [PubMed] [Google Scholar]
- 15.Hosogai N, Fukuhara A, Oshima K, et al. Adipose tissue hypoxia in obesity and its impact on adipocytokine dysregulation. Diabetes 2007;56:901–911 [DOI] [PubMed] [Google Scholar]
- 16.Boden G, Silviera M, Smith B, Cheung P, Homko C. Acute tissue injury caused by subcutaneous fat biopsies produces endoplasmic reticulum stress. J Clin Endocrinol Metab 2010;95:349–352 [DOI] [PMC free article] [PubMed] [Google Scholar]
- 17.Misra UK, Pizzo SV. Up-regulation of GRP78 and antiapoptotic signaling in murine peritoneal macrophages exposed to insulin. J Leukoc Biol 2005;78:187–194 [DOI] [PMC free article] [PubMed] [Google Scholar]
- 18.Inageda K. Insulin modulates induction of glucose-regulated protein 78 during endoplasmic reticulum stress via augmentation of ATF4 expression in human neuroblastoma cells. FEBS Lett 2010;584:3649–3654 [DOI] [PubMed] [Google Scholar]
- 19.Han Z, Liang CG, Cheng Y, et al. Oocyte spindle proteomics analysis leading to rescue of chromosome congression defects in cloned embryos. J Proteome Res 2010;9:6025–6032 [DOI] [PMC free article] [PubMed] [Google Scholar]
- 20.Barrero CA, Datta PK, Sen S, et al. HIV-1 Vpr modulates macrophage metabolic pathways: a SILAC-based quantitative analysis. PLoS ONE 2013;8:e68376. [DOI] [PMC free article] [PubMed] [Google Scholar]
- 21.Gagnon A, Sorisky A. The effect of glucose concentration on insulin-induced 3T3-L1 adipose cell differentiation. Obes Res 1998;6:157–163 [DOI] [PubMed] [Google Scholar]
- 22.Saenger AK, Laha TJ, Edenfield MJ, Sadrzadeh SM. Quantification of urinary 8-iso-PGF2α using liquid chromatography-tandem mass spectrometry and association with elevated troponin levels. Clin Biochem 2007;40:1297–1304 [DOI] [PubMed] [Google Scholar]
- 23.Santos CX, Tanaka LY, Wosniak J, Laurindo FRM. Mechanisms and implications of reactive oxygen species generation during the unfolded protein response: roles of endoplasmic reticulum oxidoreductases, mitochondrial electron transport, and NADPH oxidase. Antioxid Redox Signal 2009;11:2409–2427 [DOI] [PubMed] [Google Scholar]
- 24.Goldstein BJ, Mahadev K, Wu X. Redox paradox: insulin action is facilitated by insulin-stimulated reactive oxygen species with multiple potential signaling targets. Diabetes 2005;54:311–321 [DOI] [PMC free article] [PubMed] [Google Scholar]
- 25.Milne GL, Yin H, Hardy KD, Davies SS, Roberts LJ., 2nd Isoprostane generation and function. Chem Rev 2011;111:5973–5996 [DOI] [PMC free article] [PubMed] [Google Scholar]
- 26.Malhotra D, Thimmulappa R, Navas-Acien A, et al. Decline in NRF2-regulated antioxidants in chronic obstructive pulmonary disease lungs due to loss of its positive regulator, DJ-1. Am J Respir Crit Care Med 2008;178:592–604 [DOI] [PMC free article] [PubMed] [Google Scholar] [Retracted]
- 27.Gregor MF, Hotamisligil GS. Thematic review series: Adipocyte Biology. Adipocyte stress: the endoplasmic reticulum and metabolic disease. J Lipid Res 2007;48:1905–1914 [DOI] [PubMed] [Google Scholar]
- 28.Boden G, Song W, Duan X, et al. Infusion of glucose and lipids at physiological rates causes acute endoplasmic reticulum stress in rat liver. Obesity (Silver Spring) 2011;19:1366–1373 [DOI] [PubMed] [Google Scholar]
- 29.Evans JL, Goldfine ID, Maddux BA, Grodsky GM. Oxidative stress and stress-activated signaling pathways: a unifying hypothesis of type 2 diabetes. Endocr Rev 2002;23:599–622 [DOI] [PubMed] [Google Scholar]
- 30.Urano F, Wang X, Bertolotti A, et al. Coupling of stress in the ER to activation of JNK protein kinases by transmembrane protein kinase IRE1. Science 2000;287:664–666 [DOI] [PubMed] [Google Scholar]
- 31.Proud CG. Regulation of protein synthesis by insulin. Biochem Soc Trans 2006;34:213–216 [DOI] [PubMed] [Google Scholar]
- 32.Fukagawa NK, Minaker KL, Rowe JW, et al. Insulin-mediated reduction of whole body protein breakdown. Dose-response effects on leucine metabolism in postabsorptive men. J Clin Invest 1985;76:2306–2311 [DOI] [PMC free article] [PubMed] [Google Scholar]
- 33.Zhou QG, Zhou M, Hou FF, Peng X. Asymmetrical dimethylarginine triggers lipolysis and inflammatory response via induction of endoplasmic reticulum stress in cultured adipocytes. Am J Physiol Endocrinol Metab 2009;296:E869–E878 [DOI] [PubMed] [Google Scholar]
- 34.Winnary JN, Boucher J, Mori MA, Ueki K, Kahn CR. Regulatory subunit of phosphosinositide 3-kinase increases the nuclear accumulation of X-box-binding protein-1 to modulate the unfolded protein response. Nat Med 2012;4:438–445 [DOI] [PMC free article] [PubMed] [Google Scholar]
- 35.Park SW, Zhou Y, Lee J, et al. The regulatory subunits of PI3K, p85α and p85β, interact with XBP-1 and increase its nuclear translocation. Nat Med 2010;16:429–437 [DOI] [PMC free article] [PubMed] [Google Scholar]
- 36.Rutkowski DT, Hegde RS. Regulation of basal cellular physiology by the homeostatic unfolded protein response. J Cell Biol 2010;189:783–794 [DOI] [PMC free article] [PubMed] [Google Scholar]
- 37.Codogno P, Meijer AJ. Autophagy: a potential link between obesity and insulin resistance. Cell Metab 2010;11:449–451 [DOI] [PubMed] [Google Scholar]
Associated Data
This section collects any data citations, data availability statements, or supplementary materials included in this article.


