

Abstract
Microporous membranes are widely utilized in cell biology to study cell-cell signaling and cell migration. However, the thickness and low porosity of commercial track-etched membranes limit the quality of cell imaging and the degree of cell-cell contact that can be achieved on such devices. We employ photolithography-based microfabrication to achieve porous membranes with pore diameter as small as 0.9 μm, up to 40% porosity, and less than 5% variation in pore size. Through the use of a soap release layer, membranes as thin as 1 μm can be achieved. The thin membranes minimally disrupt contrast enhancement optics, thus allowing good quality imaging of unlabeled cells under white light, unlike commercial membranes. In addition, the polymer membrane materials display low autofluorescence even after patterning, facilitating high quality fluorescence microscopy. Finally, confocal imaging suggests that substantial cell-cell contact is possible through the pores of these thin membranes. This membrane technology can enhance existing uses of porous membranes in cell biology as well as enable new types of experiments.
Keywords: microporous, cell biology
1. Introduction
Membranes with pore sizes on the order of 1–10 μm are useful in cell biology for studying cell-cell signaling [1], cell migration [2, 3], and cell filtration [4]. A common configuration is to suspend a population of cells on a porous membrane about a millimeter above the bottom of a tissue culture well. Soluble paracrine factors can then diffuse through the membrane pores to facilitate communication between the suspended population and cells cultured on the bottom of the well. Cell migration through the membrane is typically blocked for pore diameters around 1 μm, allowing two cell populations to interact while remaining unmixed [1, 5]. Lack of mixing is important for studies in which each population needs to be analyzed separately, for example to assay cell-specific changes in gene or protein expression. Alternatively, pore diameters of roughly 10 μm are utilized for studies of cell migration through the membrane [1].
Commercial cell culture membranes are typically made from polyethylene terephthalate (PET) or polycarbonate (PC) by using a track-etching process [6, 7]. High-energy particles from radioactive decay leave a trail of damage as they fly through the polymer, and the damaged material is later removed by chemical etching to create long and narrow pores. While pore diameter is well controlled in this process, the placement of pores is random. This leads to several disadvantages: local pore density is not uniform, and membrane porosity must be kept fairly low in order to minimize the overlapping of pores (Fig. 1). Additionally, commercially available track-etched membranes have thicknesses of around 10 μm [8]. While such membranes are well suited for transmitting diffusible paracrine signals, the same is not true for juxtacrine cell-cell signaling, which requires direct membrane-to-membrane contact between cells. If small pores are utilized to block migration, cells on opposite sides of the membrane must reach through long and narrow tunnels in order to contact one another [5, 9]. Juxtacrine signaling could be considerably improved with membranes that are significantly thinner and higher in porosity [8].
Figure 1.
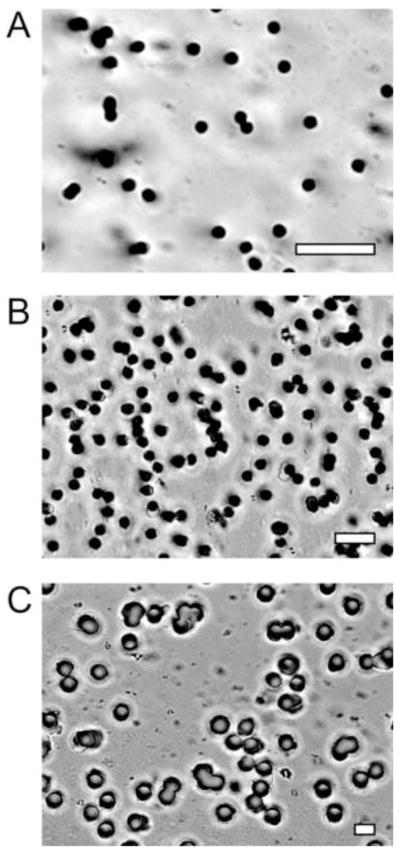
Commercial porous cell-culture membranes (PET) imaged by 60× optical microscopy. Imperfections include regional variations in pore density and fused pores with larger-than-desired pore diameter. a. 1-μm pores, 1.6% porosity. b. 3-μm pores, 14% porosity. c. 8-μm pores, 10% porosity. All scale bars are 10 μm.
Porous membranes for cell culture have also been produced by microfabrication. This approach can achieve similar pore sizes to track etching, but pores can be placed precisely rather than randomly, thus allowing high porosity without pore overlap. Electron beam lithography has been utilized to produce silicon-nitride membranes with pore sizes down to 0.3 μm and 0.5 μm in thickness [8]. While these dimensions are excellent, the cost of semiconductor processing is high and electron beam lithography is a serial writing process, making the production of large-area membranes impractical (<1 mm2 in the cited work). Photolithographic patterning of polymer materials enables cheaper and larger-area membranes. For example, membranes have been fabricated in poly(para-xylylene) polymers (Parylene) [4] or polydimethylsiloxane (PDMS) [10] at sizes on the order of 1 cm2, which is comparable in area to commercial cell culture membranes and holds adequate cell numbers for standard protein and nucleic acid quantification assays. However, the minimum achievable dimensions are not as small as with electron beam lithography, with typical pore sizes on the order of 10 μm and thicknesses of roughly 10 μm. Recently, a high-resolution porous membrane process was reported in a photocrosslinkable polymer known as SU-8 [11]. Minimum pore size and membrane thickness were quoted as <1 μm; however, the presented data only showed pores down to ~4 μm. Also, the variability of the pores was not discussed but appeared to be considerable in the images provided.
Cell culture membranes should facilitate clear imaging by both white light and fluorescence microscopy. Although commercial PET and PC membranes are fairly transparent, imaging of unlabeled cells by white light microscopy is poor. The thick and inhomogeneous membranes appear to disrupt the effectiveness of contrast enhancement optics such as phase contrast, Hoffman modulation, or differential interference contrast, suggesting that a thinner membrane could be advantageous. Fluorescent imaging of cells on PC and PET membranes is much better than white light imaging, but it is still important to minimize autofluorescence in order to reduce background noise. For microfabricated membranes, it has been shown that Parylene HT is superior to Parylene C in terms of autofluorescence [12]. Additionally, the photocrosslinkable polymer 1002F was developed specifically to provide a low-autofluorescence alternative to SU-8 [13].
In this work, we investigate the resolution limits of photolithographically defined polymer cell culture membranes. Two different fabrication processes are studied: a positive patterning process in which pores are etched out of a sheet of Parylene HT, and a negative patterning process in which 1002F is crosslinked around a pore pattern. We introduce the use of a soap release layer, which allows delicate membranes to be floated off gently from a support substrate. Thus, we achieve simple and low cost fabrication of membranes down to 1 μm in pore size and thickness, up to 40% porosity, and less than 5% variation in pore size. We demonstrate the culture of mammalian cells on these microfabricated membranes and show that the cells can be imaged clearly by both white light and fluorescence microscopy.
2. Experimental
2.1 Materials
Cell culture membranes of polyethylene terephthalate (PET, Millicell Cell Culture Inserts, Millipore) and polycarbonate (PC, Transwell Inserts, Corning) were purchased commercially.
Positive resist reagents: Microposit S1808 positive photoresist and Microposit MF-319 developer were purchased from MicroChem. 1002F negative resist reagents: EPON 1002F resin (phenol, 4,4′-(1-methylethylidene)bis-, polymer with 2,2′-((1-methylethylidene)bis(cyclohexane-4,1-diyloxymethylene))bisoxirane) was obtained from Miller-Stephenson. UVI-6976 photoinitiator (triarylsulfonium hexafluoroantimonate salts in propylene carbonate) was purchased from Dow Chemical. Propylene glycol methyl ether acetate (PGMEA) and γ-butyrolactone (GBL) were acquired from Sigma Aldrich.
2.2 Preparation of photomasks
Photomasks were designed using the open source Kic layout editor (version 2.4.b, www.wrcad.com/freestuff.html) and printed at Photronics by electron beam lithography on 5″×5″ chromium-quartz substrates. Due to the differences in photoresist polarity, a brightfield mask was used for Parylene patterning, and the inverse darkfield mask was used for 1002F patterning. The mask features were scaled for 1:1 exposure.
The mask contained 16 membrane designs on one 4-inch wafer. Each of the 16 membranes consisted of different pore sizes (0.8 μm, 1.2 μm, 2 μm, and 4 μm) and porosities (5% to 40%). Porosity was calculated by dividing the area of the holes by the total area on the membrane. Since the computer-aided design (CAD) software and mask printer utilized Manhattan geometry (rectangular patterns), the pores were drawn as overlapping squares (Supplemental Fig. S1), which rounded out into circular shapes during the photolithography process. Membranes were patterned as 15-mm diameter circles with a 6.5 × 6.5 mm2 porous region.
A lower-resolution dark field photomask (100-μm pores, 125-μm center-to-center spacing) was printed on Mylar film at Fine Line Imaging for patterning an optional structural support lattice in 1002F.
2.3 Fabrication of Parylene membranes
The following process flow is illustrated in Fig. 2a. Test-grade four-inch silicon wafers (University Wafer) were first treated with 2% Micro-90 (International Products, Burlington, NJ) by spin coating for 30 s at 4000 revolutions per minute (rpm). Micro-90 is a soap solution that is used for coating the walls of the Parylene deposition chamber to facilitate Parylene removal during cleaning. Here, we employed it as a sacrificial layer to assist eventual release of the membranes from the substrate. The thickness of the deposited soap layer was measured to be about 10 nm (refer to 2.6). The treated wafers were sent to Specialty Coating Systems for deposition of a 1-μm film of Parylene HT.
Figure 2.

Fabrication processes. a. The Parylene process begins with sequentially depositing layers of soap, Parylene HT, titanium, and photoresist. The photoresist is exposed through a positive photomask and developed. The patterned photoresist then serves as a mask for a titanium plasma etch, and the titanium in turn serves as a hard mask for a Parylene plasma etch. After attaching adhesive reinforcement labels, the exposed titanium is removed by wet etching; this also dissolves the soap layer to release the membrane. b. The 1002F process begins with depositing layers of soap and 1002F by spin coating. The 1002F is exposed through a negative photomask and developed. After attaching adhesive reinforcement labels, the soap layer is dissolved in water to release the membrane.
After the wafers were coated with Parylene, the target thickness was verified via spectral reflectometry (F40-NSR, Filmetrics). Then, a 1000-angstrom layer of titanium (Ti) was deposited via electron beam evaporation (Mark 50, CHA Industries). The Ti layer was necessary as a hard mask for pattern transfer since the oxygen plasma used to etch Parylene also etches photoresist. Microposit S1808 positive photoresist was deposited by spin coating at 500 rpm for 10 s to spread the resist, and then at 5000 rpm for 30 s to obtain a target thickness of 0.8 μm. Next, the wafers were baked for 5 min at 90 °C.
The photoresist was patterned by ultraviolet (UV) light exposure (10 mW/cm2, 5 s) using a Karl Suss MA6 mask aligner (Suss MicroTec) in low-vacuum contact mode. After exposure, patterns were developed for 20 s with Microposit MF-319 developer and rinsed in deionized (DI) water for 1 min. The wafers were then baked for 20 min at 120 °C for dehydration.
Parylene etching was accomplished by reactive ion etching (Minilock-Phantom II, Trion Technology). First, the Ti hard mask was etched using 45 standard cubic centimeters per minute (sccm) of tetrafluoromethane (CF4) with 2 sccm of oxygen (O2) for 180 s at a pressure of 6.7 Pa and 100 W of power. Next, 50 sccm of O2 was flowed for 60 s to purge residual CF4 from the chamber. Finally, the Parylene was etched using 50 sccm O2 at 20 Pa and 100 W for 120 s. The photoresist layer was also etched away during the Parylene etch step, thus eliminating the need to strip away the resist with acetone. In order to prime the etching system, the process was run twice on a dummy wafer before loading the actual samples.
Prior to removal of the completed Parylene membranes from the wafer, standard adhesive notebook reinforcement labels (Avery Dennison) were carefully applied to hold each membrane taut. The wafer was then placed into DI water to dissolve the Micro-90 layer and release the membranes. Next, the membranes were dipped in 0.5% HF to remove the remaining Ti hard mask. Membranes were rinsed 3 times in DI water after the HF etch and then air-dried.
2.4 Fabrication of 1002F membranes
1002F-50 photoresist was prepared as previously described [13]. Briefly, EPON 1002F resin and UVI-9676 photoinitiator were dissolved in GBL solvent at a ratio of 61% resin, 6.1% photoinitiator, and 32.9% solvent (weight %). Since 1002F-50 typically results in a photoresist layer around 50 μm in thickness, it was further diluted 1:1 in GBL to achieve a thickness of 1 μm after spin coating.
The following process flow is illustrated in Fig. 2b. Four-inch silicon wafers were first plasma cleaned (2 min, O2, 13.3 Pa) using a Harrick PDC-001 Plasma Cleaner (Harrick Scientific Products) to promote even photoresist adhesion to the substrate. Next, the wafers were coated with 2% Micro-90 by spin coating for 30 s at 4000 rpm. Diluted 1002F-50 was spin coated for 10 s at 500 rpm followed by 40 s at 5000 rpm to achieve a 1-μm coating and soft-baked for 10 min at 65 °C, then 20 min at 95 °C.
Once the wafers cooled to room temperature, they were patterned by UV exposure (10 mW/cm2, 6.5 s) on a MA6 aligner in low-vacuum contact mode. A post-exposure bake was performed for 10 min at 65 °C, then 20 min at 95 °C. After cooling, the 1002F was developed in PGMEA for 30 s followed by an isopropanol (IPA) rinse. Finally, notebook reinforcement labels were applied to each membrane, and the membranes were released by dissolving the Micro-90 in DI water.
2.5 Fabrication of membranes with integrated support lattice
For the 1002F membranes, it was possible to add a structural reinforcement layer to provide mechanical support for the delicate 1–μm membranes (Fig. 7). The fabrication process began initially as described above. However, following UV exposure and the post-exposure bake, the wafers were not developed. Instead, an additional 50-μm layer of 1002F photoresist was coated on top (undiluted 1002F-50, 500 rpm for 10 s, then 2000 rpm for 40 s). The wafers were then baked for 10 min at 65 °C, and then 20 min at 95 °C. After cooling, the wafers were patterned by UV flood exposure (14 mW/cm2, 25 s) through the lower-resolution dark field mask. The wafers were baked once more for 10 min at 65 °C, then 20 min at 95 °C. The patterns were developed in PGMEA for 30 s and rinsed with IPA. Finally, the membranes were released in DI water without the need for adhesive label reinforcement.
Figure 7.

Multilayer process allows integration of structural support layer. a. After depositing the soap layer, a thin (1 μm) layer of 1002F is spin coated and exposed to define the membrane pores. A second thick (50 μm) layer of 1002F is then spin coated and exposed to define the support layer. Both layers are developed together, and the soap layer is dissolved in water to release the membrane. With the integrated support layer, adhesive reinforcement labels are not necessary. Scale bar is 50 μm.
2.6 Micro-90 layer thickness measurements
The thickness of the Micro-90 soap layer was measured using ellipsometry (Auto ELIII, Rudolph Instruments), spectral reflectrometry (F40-NSR, Filmetrics), and profilometry (Dektak XT, Bruker Corporation). The film thickness was uneven, with measured values ranging from 2–15 nm. For the profilometry measurements, Micro-90 was spin coated onto a 4″ Si wafer that was partially masked with a 250 μm-thick polydimethylsiloxane (PDMS) membrane. The PDMS was then removed, creating a clean soap-coating edge for measurement.
2.7 Characterization of membrane porosity and pore sizes
Membrane pore sizes and porosity were measured using scanning electron microscopy (SEM). Samples were mounted onto standard SEM stubs using carbon tape and were sputter-coated with a thin layer of iridium using a Model IBS/e Ion Beam Sputter Depositing and Etching System (South Bay Technology, San Clemente, CA). Images were captured at various magnifications using a Magellan 400 XHR SEM (FEI, Hillsboro, OR). A custom MATLAB (MathWorks) program was used to quantify pore size and porosity from the SEM images. For visualizing the pore sidewalls, samples were mounted at roughly a 45° angle.
2.8 Characterization of autofluorescence
Membrane samples were placed onto a glass slide and illuminated using a 100 W mercury arc lamp source (Osram) through the following filters: UV-2E/C (DAPI channel, excitation [ex]: 340 – 380 nm, emission [em]: 435 – 485 nm), B-2E/C (FITC channel, ex: 465 – 495 nm, em: 515 – 555 nm), and G-2E/C (TRITC channel, ex: 528 – 553 nm, em: 590 – 650 nm) on a Nikon Eclipse TE200 microscope through a 40× objective. Images were collected using the open source microscopy software Micro-Manager (http://valelab.ucsf.edu/~MM/MMwiki/) with a QIClick CCD camera (QImaging) with the following exposure times: 500 ms for DAPI, 5 s for TRITC, and 5 s for FITC. The PET membrane sample was imaged for only 70 ms in the DAPI channel due to oversaturation at 500 ms; the measured values were scaled for plotting assuming a linear relationship between signal and imaging time. Fluorescence intensity values were normalized to a blank glass slide.
2.9 Membrane preparation for cell culture
Microfabricated membranes were mounted onto commercial Millicell Cell Culture Inserts (Fig. 6A). The commercial PET membranes were removed, and microfabricated membranes were adhered to the hanging insert by using super glue. Membranes were allowed to dry for at least one hour after gluing. Next, the membranes were treated with air plasma (45 s, high RF power, 40 Pa, Harrick PDC-001 Plasma Cleaner/Sterilizer), followed by UV-sterilization in a biosafety cabinet for 15 min. The membranes were rinsed twice in sterile DI water to remove any dust particles, placed into a sterile 100 mm × 25 mm dish, and treated with 200 μl of 5μg/ml human fibronectin (FN, Gibco) in 1× phosphate buffered saline (PBS) for 3 h at 37 °C. Excess FN was aspirated and membranes were rinsed once with sterile 1× PBS.
Figure 6.

Imaging of fluorescently stained cells on various porous membranes. a. Released microfabricated membrane. The adhesive reinforcement label is clearly visible around the edge of the membrane. b. Microfabricated membrane mounted on a hanging culture insert suspended in a tissue culture well. NIH 3T3 cells were stained with Hoechst (nucleus), phalloidin (actin fibers), and anti-vinculin (focal adhesions) prior to culture on porous membranes made out of (c) Parylene HT, (d) 1002F, and (e) PET. Exposure times were identical on all three materials. The low autofluorescence of the parylene and 1002F membranes results in lower background signal and clearer imaging. Scale bars are 20 μm.
Cells could be seeded either to just one side of the membrane, or to both sides. To add cells to the underside of the membranes, membranes were flipped upside down and cells were seeded in a 200 μl liquid bubble for 2 h. The membranes were then flipped over and transferred to a 12-well plate for seeding cells onto the top side.
2.10 Cell culture and immunocytochemistry
NIH 3T3 murine fibroblast cells were seeded onto membranes and cultured in Dulbecco’s Modified Eagle Medium (DMEM, Caisson Labs) supplemented with 10% bovine calf serum (BCS, Thermo Scientific Hyclone) for 24 h. Cells were fixed in 2% paraformaldehyde (PFA), permeabilized with 0.1% Triton-X and blocked with 5% bovine serum albumin (BSA) before probing with anti-Vinculin antibody (1:200, clone VIIF9, Chemicon) for 1 h at 4 °C. Samples were then incubated with rhodamine-conjugated Phalloidin (Molecular Probes), Hoescht 33342 (Molecular Probes), and fluorescein isothiocyanate (FITC) conjugated goat anti-mouse secondary antibody (1:1000, Jackson ImmunoResearch Laboratories) and imaged using a Nikon Eclipse TE200 microscope. Membrane culture inserts were transferred to glass-bottomed dishes prior to imaging.
2.11 Cell viability measurements
NIH 3T3 cells were seeded onto 12-well polystyrene plates, commercial PET membranes, or microfabricated Parylene membranes and cultured overnight in DMEM with 10% BCS. Cells were rinsed twice with 1× Hank’s Buffered Saline Solution (HBSS, Gibco) and incubated for 30 minutes in 2 μM calcein AM and 4 μM ethidium homodimer-1 using a Live/Dead Viability/Cytotoxicity Kit (Molecular Probes). The cells were then imaged using a Nikon Eclipse TE200 microscope, and images were analyzed using ImageJ software (National Institutes of Health).
2.12 Confocal imaging
Human FN was conjugated to Alexa Fluor 594 using amine-reactive Alexa Fluor 594 carboxylic acid, succinimidyl ester (Molecular Probes), and fabricated membranes were treated and labeled with 20 μg/ml of fluorescent FN. NIH 3T3 cells were labeled either with CellMask Deep Red Plasma Membrane Dye (Molecular Probes) or Vybrant DiO Cell Labeling Solution (Molecular Probes) and seeded onto opposite sides of labeled membranes. After overnight culture, Hoescht 33342 was added to label nuclei, and cells were fixed in 2% PFA.
Membranes were carefully cut from the plastic hanging insert using an X-Acto knife and mounted onto a microscope slide using Fluoromount-G (Southern Biotech) and a No. 1 coverslip (Fisher). Samples were imaged using an LSM 710 (Zeiss) with a Plan-Apochromat 63×/1.4 Oil DIC M27 objective (Zeiss). Images were deconvoluted and rendered in 3D using Volocity Image Analysis Software (Version 6.3, PerkinElmer).
3. Results and discussion
3.1 Microporous membranes can be precisely fabricated by simple photolithographic processes
Commercial track-etched cell-culture membranes exhibit significant variations in pore size and local pore density as a result of the fabrication process. Since pores are randomly placed, they can cluster locally or overlap to create larger pores (Fig. 1). In contrast, with photolithographic processes, each pore location is specifically determined. In this work, we examined both positive and negative resist processes. For the positive process (Fig. 2a), Parylene HT was deposited onto a silicon wafer substrate and coated with a layer of evaporated Ti. Positive resist was then applied and photopatterned with a dark-field mask to define the pores. The photoresist pattern was transferred to the Ti layer by a plasma etch, which served as a hard mask to subsequently pattern the Parylene layer via a different plasma etch. Previous reports have employed a wet-etched aluminum or chromium hard mask [4, 14]; however, we found that higher resolution patterns could be achieved with a dry-etched Ti hard mask. Thus, the porous membrane was defined using a single unaligned photopatterning step, followed by two plasma etches. The negative process was even simpler (Fig. 2b), entailing only the spin coating of 1002F onto a silicon wafer substrate followed by direct photopatterning with a light-field mask. Here, the porous membrane is defined solely by an unaligned photopatterning step with no etching required.
Patterned membranes were fragile, as they were fabricated at only 1-μm thickness and porosity up to 40%, and thus they could not be peeled off of the substrate without damage, unlike previously reported thicker membranes [15–17]. Release of delicate membranes has been previously accomplished by using a photoresist sacrificial layer [4], but we found that photoresist was chemically incompatible with 1002F. Others have resorted to dissolving the supporting substrate entirely [8]. Our solution was the use of a soap coating as a sacrificial layer. Each process began with application of Micro-90 soap solution to the silicon substrate, prior to coating and patterning Parylene HT or 1002F as described above. After patterning, the wafers were simply soaked in water to dissolve the soap layer and release the membranes.
In order to test the resolution limits of our photolithographic processes, we designed a photomask containing a variety of membrane designs, with nominal pore sizes of 0.8 μm, 1.2 μm, 2 μm, and 4 μm and porosity ranging from 5% to 40% (Supplemental Fig. S1). Fig. 3a shows SEM images of the highest porosity membranes that could be successfully fabricated at each pore size. Pattern uniformity can be seen to be superior to commercial track-etched membranes (Fig. 1). Furthermore, pore size uniformity is superior due to the lack of overlapping pores. As shown in Table 1, the standard deviation of pore diameter across an entire membrane was less than 5%.
Figure 3.

Microfabricated membranes imaged by scanning electron microscopy. a. Pore diameters and porosities are nominal values based on the mask design. Actual measured values are reported in Table 1. For each pore size, the highest porosity that was successfully achieved is shown. Scale bars are 10 μm on the wide-field images, and 1 μm on the insets. b. Pore sidewall profiles visualized by angled SEM imaging. Imaging was performed from both the top side and bottom side in order to characterize the anisotropy of the etch process. Scale bars are 1 μm.
Table 1.
Precision and accuracy of pore fabrication. The average and standard deviation of membrane pore diameters are reported for different Parylene and 1002F membrane designs. Measurements were taken from five different regions of a single membrane. Each reported value is compiled from measurements of at least 300 individual pores.
| Mask Pore Size | Measured Pore Size (Parylene HT) | Measured Pore Size (1002F) |
|---|---|---|
| 0.8 μm | 0.91 ± .02 μm | 1.04 ± .03 μm |
| 1.2 μm | 1.27 ± .04 μm | 1.35 ± .04 μm |
| 2 μm | 2.15 ± .01 μm | 2.00 ± .09 μm |
| 4 μm | 4.31 ± .05 μm | 3.91 ± .03 μm |
Membranes were imaged from both the top side and the bottom side in order to verify that the pores penetrated through the entire membrane (Fig. 3b). The imaging was performed at an angle in order to visualize the sidewall profile. Since the Parylene etching process was not perfectly anisotropic, the pores tended to be slightly larger on top (e.g. 1.98 μm from the top and 1.95 μm from the bottom, with 2-μm mask; 1.05 μm from the top and 0.85 μm from the bottom, with 0.8-μm mask).
Fabrication of 0.8-μm, 20% porosity membranes was near the resolution limit of our lithographic processes. The minimum pore diameters that could be achieved were 0.9 μm in Parylene HT and 1.0 μm in 1002F. Furthermore, we observed that from time to time the 0.8/20% design would not pattern correctly, producing distorted patterns (Supplemental Fig. S2). 0.8-μm designs with porosity below 20% did not display the same issues. Additionally, well-rounded 0.8-μm pores could not be fabricated in 1002F at any porosity (see inset in Fig. 3). In general, fabrication of pores at around 1 μm was only reliable in the Parylene HT process. However, the 1002F process was reliable for pores of 2 μm and above, and thus 1002F is preferable at these dimensions due to the simpler fabrication process.
3.2 Cell imaging is superior on microfabricated membranes
Previous studies have shown that both Parylene and 1002F are cell-culture compatible, though some surface treatment is necessary to optimize cell adhesion [13, 18–20]. For our cell culture studies, membranes were released (Fig. 6A) and mounted onto polystyrene cell culture hanging inserts (Fig. 6B). We found that treating the surfaces with air plasma followed by incubation in 5 μg/ml fibronectin provided the best amount of cell adhesion in comparison to coating with other extracellular matrix proteins, such as gelatin, collagen, and laminin. No significant difference in cell viability was measured between microfabricated membranes (97.8% ± 1.4%, Parylene HT), commercial membranes (99.3% ± 0.3%, PET), and standard tissue culture plastic (99.3% ± 0.2%, polystyrene) (Supplemental Fig. S3).
A critical aspect of cell culture devices is imaging compatibility. Living cells and the structures contained within them tend to be transparent, displaying little difference in contrast from their surroundings. In order to enable the visualization of cell structures, contrast enhancing optical techniques or fluorescent probe labeling is required. It is important that cell culture devices do not interfere with the effectiveness of these strategies.
Optical contrast enhancement techniques are critical for white light imaging of unlabeled cells. However, these strategies appear to be compromised by commercial cell culture membranes, which are 10-μm thick and inhomogeneous. As shown in Fig. 4, unlabeled NIH 3T3 cells cultured on PET and PC membranes are very difficult to visualize by white light microscopy. On the other hand, cells cultured on our 1-μm thick microfabricated membranes are readily imaged. We observed similar image quality on Parylene and 1002F membranes, with smaller pores and lower porosity generally producing better clarity (Supplemental Fig. S4). The substantial improvement in white light imaging quality is a major advantage of our microfabricated membranes over commercial microporous cell culture membranes.
Figure 4.

Contrast-enhanced white light cell imaging is superior on microfabricated porous membranes compared to commercial membranes. NIH 3T3 cells were imaged at 10× with phase contrast and Hoffman modulation contrast on microfabricated Parylene HT (0.8 μm pores, 5% porosity) and 1002F (4 μm pores, 40% porosity) membranes, as well as commercial track-etched PET (1 μm pores, 1.6% porosity) and PC (3 μm pores, 14% porosity) membranes. Cell image quality was markedly improved on the microfabricated membranes. Scale bars are 50 μm.
Fluorescent microscopy is a powerful imaging technique that allows individual proteins to be tagged with different colors with great specificity. It is important that the cell culture substrate exhibit low autofluorescence in order to limit the level of background noise. Previous reports have indicated that Parylene HT [12] and 1002F [13, 18] have low autofluorescence, but processing steps, such as plasma exposure, may alter autofluorescence [12]. Thus, we measured the autofluorescence of our microfabricated membranes in three common fluorescence channels (DAPI, FITC, TRITC) and compared the results to commercial cell culture substrates made of polystyrene (PS), polyethylene terephthalate (PET), and polycarbonate (PC) (Fig. 5). We found that the Parylene HT and 1002F membranes exhibited significantly lower autofluorescence than the PET and PS substrates in all three channels. Note that in Fig. 5, the thickness of each substrate material is not the same (1 μm for Parylene HT and 1002F, 10 μm for PET and PC, and 670 μm for PS), thus the measurements do not represent the intrinsic autofluorescence of each material. However, the thicknesses are those of the actual cell culture devices, thus the autofluorescence measurements properly reflect the background noise that would be expected in practice.
Figure 5.

Microfabricated membranes exhibit low autofluorescence. Relative autofluorescence of porous membranes made of Parylene HT (1 μm), 1002F (1 μm), polyethylene terephthalate (PET, 9 μm), and polycarbonate (PC, 10 μm). Intensity values were normalized to the autofluorescence of a glass slide. A standard polystyrene dish (PS, 670 μm) is also included for comparison. The readings do not indicate the inherent autofluorescence of these materials since the thicknesses are not the same. Practically speaking, the readings do indicate the observed autofluorescence when imaging cells on these substrates. Note that the Parylene and 1002F membranes are comparable to commercial PC membranes and significantly better than the PET and PS substrates in terms of autofluorescence.
To demonstrate fluorescent imaging, we seeded NIH 3T3 cells for 24 h on Parylene HT, 1002F, and PET membranes and then stained with anti-vinculin (focal adhesions), phalloidin (actin filaments), and Hoescht (nuclei) fluorescent labels (Fig. 6C–E). Similar cell spreading and morphology were observed across all three substrates, but our microfabricated membranes facilitated clearer imaging than commercial PET membranes due to lower autofluorescence. Besides NIH 3T3 cells, additional immortalized (HT-1080 human fibrosarcoma) and primary (human umbilical vein endothelial cells, human adipose stem cells) cell lines have been successfully cultured on Parylene HT and 1002F membranes for up to 2 weeks.
3.3 1002F membranes can be fabricated with integrated structural support
Since we reduced the thickness of our membranes to only 1 μm, they were very delicate and required the addition of a reinforcement label for mechanical stability (Fig. 6A). In response, we designed an alternative fabrication method for 1002F membranes that integrated a structural support layer into the membrane itself (Fig. 7). After UV exposure of the 1-μm membrane layer, but prior to development, an additional 50-μm layer of 1002F was spun on top. The thicker 1002F was then patterned with a photomask consisting of 100-μm pores with 125-μm center-to-center spacing, creating a thin high-resolution membrane integrated with a thicker lower-resolution support layer. This approach was not successful with Parylene membranes, due to poor adhesion between the Parylene and 1002F.
3.4 Confocal imaging suggests significant cell-cell contact through membranes
In order to investigate the potential for cells to contact one another through the pores of microfabricated membranes, fluorescently labeled NIH 3T3 cells were seeded on opposite sides of a Parylene membrane (1.2 μm, 20% porosity) and imaged using confocal microscopy (Fig. 8). Membrane imaging was facilitated by labeling with fluorescently conjugated fibronectin. As shown in Fig. 8b, cells appeared to be capable of reaching through the pores and contacting other cells on the opposite side of the membrane. Furthermore, examination of the membrane channel alone revealed that the membrane remained intact and was not torn or damaged by the cells. While further functional studies are required, this imaging data suggests that significant levels of cell-cell contact may be possible through microfabricated membranes.
Figure 8.
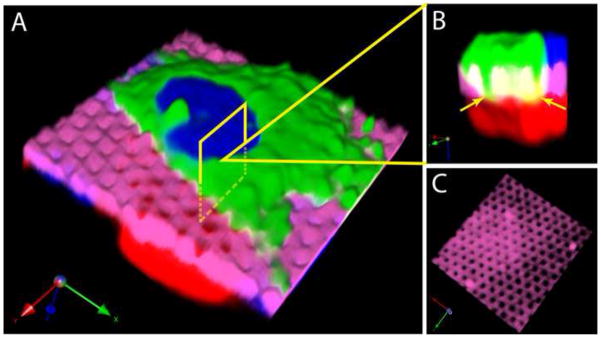
Confocal imaging suggests cell-cell contact through a microfabricated membrane. a. NIH 3T3 cells (red and green) are visible on opposite sides of a membrane (pink), with nuclei labeled blue. b. A magnified cross section shows the green cell reaching through the membrane pores, with regions of green/red overlap shown in yellow (arrowheads). c. Visualization of the membrane channel alone shows that the pores are intact and undamaged.
4. Conclusions
Through the use of photopatterning, we were able to achieve porous membranes with better uniformity and higher porosity than available from commercial track-etched cell culture membranes. While there may be an impression that microfabrication is an expensive technology, our processes are similar in complexity to track etching processes, which require irradiation and chemical etching. The 1002F process is particularly simple and amenable to production, thus this work could make the precision of microfabricated membranes more widely accessible. Previously, the realization of microfabricated membranes with tight control of pore diameter enabled new applications in the selective filtration of blood cells [4]; we have achieved similar control of pore variation at a pore size that is an order of magnitude smaller, which may open up new applications such as the selective filtering of bacteria. Through the use of a soap release layer, we achieved a membrane thickness of only 1 μm. This allowed white light cell imaging on biological microscopes without fluorescence labeling, overcoming a significant drawback of current commercial membranes. Finally, we have achieved a membrane pore size, porosity, and thickness that should enable high degrees of contact-dependent cell-cell signaling between populations that are isolated on opposites of a membrane, although this still needs further investigation. Previously, such a capability has been restricted to small membranes fabricated by electron beam lithography [8], but our process should now enable the study of larger cell populations that are amenable to standard biological assays for nucleic acid and protein quantification, thus enabling new types of cell-cell interaction studies.
Supplementary Material
Highlights.
Microporous membranes for cell biology were fabricated by photopatterning.
Superior porosity and pore size variation than commercial options.
Thinner than commercial options.
Superior cell imaging than commercial options.
Simple and reproducible fabrication process.
Acknowledgments
1002F reagents were generously provided by Mark Bachman. This research was supported by the Micro/Nano Fluidics Fundamentals Focus (MF3) Center under the DARPA N/MEMS S&T Fundamentals Program (N66001-1-4003), the American Cancer Society (ACS/IRG 98-279-07), and the National Science Foundation (LifeChips IGERT 0549479). This work utilized shared resources at UC Irvine including the Integrated Nanosystems Research Facility, the Laboratory for Electron and X-ray Instrumentation, the Laboratory for Fluorescence Dynamics (LFD), and the Optical Biology Core (OBC). The LFD is supported jointly by NIH grants 5P41RR003155-27 and 8P41GM103540. The OBC is a resource of the Chao Family Comprehensive Cancer Center (P30CA062203) and the Center for Complex Biological Systems (GM-076516).
Footnotes
Publisher's Disclaimer: This is a PDF file of an unedited manuscript that has been accepted for publication. As a service to our customers we are providing this early version of the manuscript. The manuscript will undergo copyediting, typesetting, and review of the resulting proof before it is published in its final citable form. Please note that during the production process errors may be discovered which could affect the content, and all legal disclaimers that apply to the journal pertain.
References
- 1.Sheridan SD, Gil S, Wilgo M, Pitt A. Microporous membrane growth substrates for embryonic stem cell culture and differentiation. Methods in cell biology. 2008;86:29–57. doi: 10.1016/S0091-679X(08)00003-4. [DOI] [PubMed] [Google Scholar]
- 2.Boyden S. The chemotactic effect of mixtures of antibody and antigen on polymorphonuclear leucocytes. The Journal of experimental medicine. 1962;115:453–466. doi: 10.1084/jem.115.3.453. [DOI] [PMC free article] [PubMed] [Google Scholar]
- 3.Zigmond SH, Hirsch JG. Leukocyte locomotion and chemotaxis. New methods for evaluation, and demonstration of a cell-derived chemotactic factor. The Journal of experimental medicine. 1973;137:387–410. doi: 10.1084/jem.137.2.387. [DOI] [PMC free article] [PubMed] [Google Scholar]
- 4.Zheng S, Lin H, Liu JQ, Balic M, Datar R, Cote RJ, Tai YC. Membrane microfilter device for selective capture, electrolysis and genomic analysis of human circulating tumor cells. Journal of chromatography A. 2007;1162:154–161. doi: 10.1016/j.chroma.2007.05.064. [DOI] [PubMed] [Google Scholar]
- 5.Saunders KB, D’Amore PA. An in vitro model for cell-cell interactions. In vitro cellular & developmental biology : journal of the Tissue Culture Association. 1992;28A:521–528. doi: 10.1007/BF02634136. [DOI] [PubMed] [Google Scholar]
- 6.Fleischer RL, Alter HW, Furman SC, Price PB, Walker RM. Particle track etching. Science. 1972;178:255–263. doi: 10.1126/science.178.4058.255. [DOI] [PubMed] [Google Scholar]
- 7.Apel P. Track etching technique in membrane technology. Radiat Meas. 2001;34:559–566. [Google Scholar]
- 8.Ma SH, Lepak LA, Hussain RJ, Shain W, Shuler ML. An endothelial and astrocyte co-culture model of the blood-brain barrier utilizing an ultra-thin, nanofabricated silicon nitride membrane. Lab on a chip. 2005;5:74–85. doi: 10.1039/b405713a. [DOI] [PubMed] [Google Scholar]
- 9.Hastings NE, Simmers MB, McDonald OG, Wamhoff BR, Blackman BR. Atherosclerosis-prone hemodynamics differentially regulates endothelial and smooth muscle cell phenotypes and promotes pro-inflammatory priming. American Journal of Physiology - Cell Physiology. 2007;293:C1824–C1833. doi: 10.1152/ajpcell.00385.2007. [DOI] [PubMed] [Google Scholar]
- 10.Huh D, Matthews BD, Mammoto A, Montoya-Zavala M, Hsin HY, Ingber DE. Reconstituting organ-level lung functions on a chip. Science. 2010;328:1662–1668. doi: 10.1126/science.1188302. [DOI] [PMC free article] [PubMed] [Google Scholar]
- 11.Esch MB, Sung JH, Yang J, Yu C, Yu J, March JC, Shuler ML. On chip porous polymer membranes for integration of gastrointestinal tract epithelium with microfluidic ‘body-on-a-chip’ devices. Biomedical microdevices. 2012;14:895–906. doi: 10.1007/s10544-012-9669-0. [DOI] [PubMed] [Google Scholar]
- 12.Lu B, Zheng S, Quach BQ, Tai YC. A study of the autofluorescence of parylene materials for microTAS applications. Lab on a chip. 2010;10:1826–1834. doi: 10.1039/b924855b. [DOI] [PubMed] [Google Scholar]
- 13.Pai JH, Wang Y, Salazar GT, Sims CE, Bachman M, Li GP, Allbritton NL. Photoresist with low fluorescence for bioanalytical applications. Analytical chemistry. 2007;79:8774–8780. doi: 10.1021/ac071528q. [DOI] [PMC free article] [PubMed] [Google Scholar]
- 14.Wright D, Rajalingam B, Selvarasah S, Dokmeci MR, Khademhosseini A. Generation of static and dynamic patterned co-cultures using microfabricated parylene-C stencils. Lab on a chip. 2007;7:1272–1279. doi: 10.1039/b706081e. [DOI] [PubMed] [Google Scholar]
- 15.Jinno S, Moeller HC, Chen CL, Rajalingam B, Chung BG, Dokmeci MR, Khademhosseini A. Microfabricated multilayer parylene-C stencils for the generation of patterned dynamic co-cultures. J Biomed Mater Res A. 2008;86:278–288. doi: 10.1002/jbm.a.32030. [DOI] [PubMed] [Google Scholar]
- 16.Lu B, Zhu DH, Hinton D, Humayun MS, Tai YC. Mesh-supported submicron parylene-C membranes for culturing retinal pigment epithelial cells. Biomedical microdevices. 2012;14:659–667. doi: 10.1007/s10544-012-9645-8. [DOI] [PubMed] [Google Scholar]
- 17.Wright D, Rajalingam B, Karp JM, Selvarasah S, Ling YB, Yeh J, Langer R, Dokmeci MR, Khademhosseini A. Reusable, reversibly sealable parylene membranes for cell and protein patterning. J Biomed Mater Res A. 2008;85A:530–538. doi: 10.1002/jbm.a.31281. [DOI] [PMC free article] [PubMed] [Google Scholar]
- 18.McPherson AL, Walker GM. A photo-defined membrane for precisely patterned cellular and microparticle arrays. Aip Adv. 2012;2 [Google Scholar]
- 19.Chang TY, Yadav VG, De Leo S, Mohedas A, Rajalingam B, Chen CL, Selvarasah S, Dokmeci MR, Khademhosseini A. Cell and protein compatibility of parylene-C surfaces. Langmuir : the ACS journal of surfaces and colloids. 2007;23:11718–11725. doi: 10.1021/la7017049. [DOI] [PubMed] [Google Scholar]
- 20.Gunn NM, Bachman M, Li GP, Nelson EL. Fabrication and biological evaluation of uniform extracellular matrix coatings on discontinuous photolithography generated micropallet arrays. J Biomed Mater Res A. 2010;95:401–412. doi: 10.1002/jbm.a.32854. [DOI] [PMC free article] [PubMed] [Google Scholar]
Associated Data
This section collects any data citations, data availability statements, or supplementary materials included in this article.