

Abstract
Recent work showed that unsupervised learning of a complex environment activates synaptic proteins essential for the stabilization of long-term potentiation (LTP). The present study used automated methods to construct maps of excitatory synapses associated with high concentrations of one of these LTP-related proteins [CaMKII phosphorylated at T286/287, (pCaMKII)]. Labeling patterns across 42 sampling zones covering entire cross sections through rostral hippocampus were assessed for two groups of rats that explored a novel two-room arena for 30 min, with or without a response contingency involving mildly aversive cues. The number of pCaMKII-immunopositive (+) synapses was highly correlated between the two groups for the 21 sampling zones covering the dentate gyrus, CA3c/hilus, and apical dendrites of field CA1, but not for the remainder of the cross section. The distribution of pCaMKII+ synapses in the large uncorrelated segment differed markedly between the groups. Subtracting home-cage values removed high scores (i.e., sampling zones with a high percentage of pCaMKII+ contacts) in the negative contingency group, but not in the free-exploration animals. Three sites in the latter had values that were markedly elevated above other fields. These mapping results suggest that encoding of a form of memory that is dependent upon rostral hippocampus reliably occurs at high levels in discrete anatomical zones, and that this regionally differentiated response is blocked when animals are inhibited from freely exploring the environment by the introduction of a mildly aversive stimulus.
Keywords: CaMKII, engram, exploration, long-term potentiation, plasticity, postsynaptic density
Introduction
The construction of detailed maps localizing sites associated with memory encoding (“engrams”) is a long-standing goal of behavioral neuroscience (Thompson, 1976; Swain and Thompson, 1993; Lynch et al., 2010; Sakaguchi and Hayashi, 2012). This project inevitably required means for identifying synapses that had recently undergone learning-related modifications. The discovery of long-term potentiation (LTP; Bliss and Lomo, 1973), and the subsequent evidence linking it to long-term memory (Morris et al., 1986; Roman et al., 1987; Abraham and Williams, 2003), suggested a route to find such markers. Recent work using newly developed imaging methods for identifying actin signaling cascades involved in LTP stabilization provided several candidate markers for recently potentiated synapses (Lamprecht et al., 2006; Chen et al., 2007; Patterson and Yasuda, 2011; Babayan et al., 2012; Seese et al., 2012). The techniques used in some of these in vitro studies proved applicable to analyses of LTP-related changes associated with learning. Three experiments of this type have been reported. The first demonstrated that 30 min of free exploration in a complex, open field increased the percentage of synapses associated with phosphorylated (p) cofilin (Fedulov et al., 2007), a protein critical to actin polymerization and LTP consolidation (Rex et al., 2009), in hippocampal field CA1. The cofilin effect was blocked by an NMDA receptor antagonist as it was in LTP experiments. Similar results were obtained in tests of whether complex unsupervised learning activates synaptic TrkB receptors for the neurotrophin BDNF (Chen et al., 2010a). Importantly, follow-on work showed that the learning-associated increases in pTrkB were present in dorsal but not ventral hippocampus (Chen et al., 2010b).
Here we report evidence that behaviorally dependent, regionally discrete differences in the percentage of excitatory synapses associated with dense concentrations of the LTP marker protein pCaMKII can be reliably detected in contiguous sampling zones covering an entire cross section of dorsal hippocampus. pCaMKII was selected as the synaptic marker because it (1) is concentrated at postsynaptic densities (PSDs) of excitatory synapses (Kennedy, 1997), (2) is activated via autophosphorylation at T286/287 at synapses following chemically induced response facilitation (Otmakhov et al., 2004), and (3) contributes importantly to LTP (Lisman et al., 2012). Although CaMKII is only transiently activated following single-spine glutamate uncaging (Patterson and Yasuda, 2011), other studies show CaMKII T286/287 phosphorylation is longer lasting (Barria et al., 1997; Lisman et al., 2002), possibly due to association with the NMDA receptor (Mullasseril et al., 2007; Cheriyan et al., 2011). Missing from the literature are data showing that LTP induction in adult brain by naturalistic patterns of afferent stimulation is accompanied by long-lasting activation of synaptic CaMKII; experiments directed at the point are described here. Finally, it should be noted that CaMKII phosphorylation could occur with forms of plasticity other than LTP (Rose et al., 2009; Sajikumar et al., 2009), although analysis of this at mature synapses using learning-related stimulation is lacking.
The present studies used a simple behavioral paradigm in which rats were given free exploration of a two-compartment environment in the presence or absence of a mildly aversive cue triggered by a particular movement. These conditions resulted in two groups with comparable levels of activity and a similar degree of habituation, but that behaved in different ways: free exploration of the entire spatial environment versus adjusting to a specific response contingency that interfered with such exploration. The results suggest that the former condition elicits high levels of synaptic change in surprisingly few sites in dorsal hippocampus, a region critical to spatial learning, and that this regional pattern does not occur when a disruptive condition is added.
Materials and Methods
All animal procedures were conducted in accordance with the National Institutes of Health Guide for the Care and Use of Laboratory Animals and with protocols approved by the Institutional Animal Care and Use Committee of the University of California at Irvine.
Groups and behavior.
Adult (8–9-week-old) male Long–Evans rats (Harlan Laboratories) were divided into three treatment groups: “contingency” (n = 8), unsupervised exploration (n = 8), and home-cage controls (n = 7). All rats were handled twice daily for 6 d, and on the following day were given behavioral testing or left in home cages. The testing apparatus (length, 36 inches; width, 18 inches; height, 18 inches) was divided into two equal-sized compartments distinguished by either black-and-white stripes or square dots on one wall, with a 4-square-inch connecting passage; one compartment had a strobe light (3W LED) and a toy siren alarm fixed above. Rats in the contingency group were placed into the apparatus and allowed 5 min of exploration, after which any further entries into the “strobe” compartment activated the strobe light and alarm as long as the animal remained there; this strobe contingency period lasted 25 min. Rats in the unsupervised learning group were given 30 min to explore the compartments with no strobe or alarm activation. Home-cage controls did not have behavioral testing. On removal from the test apparatus (or home cage), each rat was anesthetized with isoflurane and decapitated; brains were removed and fast frozen for later immunofluorescence. One additional adult rat was killed by overdose with euthasol and sections through rostral hippocampus were processed for both the Timm's stain for heavy metals (Haug, 1974) and Nissl staining to illustrate hippocampal sample fields relative to afferent lamina and major cell layers, respectively.
Immunohistochemistry.
Brains were cryostat-sectioned into evenly spaced series (20 μm thick, coronal; 200 μm between sections). Sections were methanol-fixed and processed for dual immunofluorescence localization of the excitatory synapse, PSD scaffold protein PSD-95 (Kennedy, 1997) and pCaMKII (T286/287) as described previously (Chen et al., 2007). This entailed overnight incubation at room temperature in a primary antisera mixture containing mouse anti-PSD-95 (1:1000; #MA1-045, Thermo Fisher Scientific) and rabbit anti-pCaMKII T286/287 (1:200; #06-881, Millipore), 1.5 h incubation in secondary antisera mixture containing AlexaFluor594 anti-rabbit IgG and AlexaFluor488 anti-mouse IgG (1:1000; Invitrogen; Fig. 1A), and coverslipping with Vectashield containing DAPI (Vector Laboratories) to label cell nuclei. Some sections were similarly processed but with individual primary antisera omitted to verify that no species cross-reactivity of secondary antisera, or channel bleed-through, occurred.
Figure 1.

Dual immunofluorescence localization of PSD-95 and pCaMKII T286/287 was used to map colocalization across 42 sample zones in rostral hippocampus. A, Representative images show immunolabeling for pCaMKII alone (left, red), and for pCaMKII plus PSD-95 (right, red and green, respectively) in stratum radiatum (SR) of field CA1b. Scale bar, 2 μm. Note, both antigens are exclusively and densely localized to small puncta, some of which were double labeled (arrows, 2 examples of colocalization). B, Plot shows the immunofluorescence intensity frequency distribution for pCaMKII+ labeling colocalized with PSD-95 (mean values from 3 representative cases). The vertical line marks the intensity value above which labeling was considered intense; elements with this pCaMKII immunolabeling intensity, or higher, were counted as being double labeled in calculations of the percentage PSD-95+ synapses enriched in pCaMKII. C, PSD sizes were distributed according to a Poisson curve (R2 = 0.84). The intensity of pCaMKII labeling colocalized with PSDs did not correlate with PSD size (R2 = 0.0018, p = 0.74). D, Photomicrograph of a rostral hippocampal section processed for the Timm's stain for heavy metals (brown to black) and Nissl staining (violet) to illuminate major lamina and cellular layers, respectively. Sampling zones used for automated counting of pCaMKII+ and PSD-95+ elements are indicated with dotted lines. Each of the major hippocampal subdivisions (CA1, CA3ab, CA3c, DG) were divided into 4–6 zones as illustrated for CA1 SR: these numbered zones (1–5) extended across the three lamina in fields CA1 and CA3. Numbering within CA3 and the DG molecular layer began with CA3a and the lateral aspect of the upper leaf, respectively. LM, Lacunosum-moleculare; SO, stratum oriens; UL, upper leaf of the DG molecular layer; LL, lower leaf of the DG molecular layer.
Image collection and automated object counts.
Coronal sections through rostral hippocampus (∼−3.24 mm from bregma) were selected for analysis (Paxinos and Watson, 2007); low-power imaging was used to exclude cases in which immunostaining was not evenly distributed. The mean (±SEM) number of sections evaluated per animal was 3.1 ± 0.3 for the unsupervised learning group, and 3.3 ± 0.2 for the contingency animals (p > 0.70). Digital images of immunolabeling were captured using a 63× (Plan Apo; numerical aperture, 1.4) objective, a Leica DM6000B epifluorescence microscope with Hamamatsu Orca ER camera and Leica MM AF v1.6.0 software (with MetaMorph). Optimal synaptic immunostaining is generally observed through a depth of ∼5 μm from the tissue surface (Chen et al., 2007). To use the autofocus function of MM AF, overlap of synaptic labeling on the green and red channels was verified, then the center of the focal plane for the red (pCaMKII) channel was established for field CA1 stratum radiatum. Starting from this plane, the Image Autofocus function and Directional Average algorithm were used to optimize focus for images that were automatically collected at 63× from contiguous sample fields (105 × 136 μm each) covering an entire hippocampal cross section (∼12 million PSDs). Individual images were then stitched together to generate a composite image of each entire hippocampal cross section.
In-house software (Chen et al., 2007; Rex et al., 2009) was used to normalize background intensities and then immunolabeled puncta within the size and eccentricity constraints of synaptic elements were identified using multiple intensity thresholds, with erosion and dilation filters, to exclude nonsynaptic objects. The size and fluorescence labeling intensity of the objects thus identified as synapses were automatically measured and counted as being labeled in the green channel only, the red channel only, or in both channels (i.e., synapses double-labeled for PSD-95 and pCaMKII). Finally, intensity frequency distributions for pCaMKII immunolabeling associated with PSDs were constructed for each section and only elements labeled with intensities that exceeded a fixed threshold were used to calculate the percentage double-labeled values for that section (Fig. 1B). The results are thus described as percentage of total PSD-95+ synapses associated with high concentrations of pCaMKII. As expected from work suggesting that pCaMKII moves into and out of the postsynaptic density depending on circumstances (Lisman et al., 2012), numerous pCaMKII clusters were not colocalized with PSD-95 (Fig. 1A).
The mean size for PSDs was 0.19 ± 0.17 μm2 (mean ± SD); sizes were distributed in a Poisson manner (Fig. 1C), an observation that agrees with ultrastructural results (Schikorski and Stevens, 1997). By testing for a correlation between the two variables, we evaluated the possibility that the intensity of pCaMKII immunolabeling was biased toward clusters located on large PSDs. A relationship could not be detected in comparisons involving millions of contacts (R2 = 0.0018, p = 0.74).
To evaluate the regional distribution of pCaMKII+ synapses, the hippocampal image was divided into 42 zones that conformed to local cytoarchitectonic and laminar boundaries (Fig. 1D). Contiguous sampling blocks were then used to subdivide each lamina within a particular pyramidal cell field; the dentate gyrus (DG) was not separated into different layers. It was then possible to define a particular sampling zone as falling within or straddling the a–c divisions of CA1 and CA3. The stratum lacunosum/moleculare of CA3 presented a problem because it is not extended along the coronal plane; we therefore arbitrarily divided it into medial and lateral segments, each with an inner and outer segment. Automated methods described above were then used to calculate the percentage of double-labeled PSDs within each zone. To avoid potential contributions of differences in immunostaining intensity between tissue sections, we normalized the “percentage double-labeled” values for each zone to the mean value for that entire section (Z-scores). This step revealed that field CA3c had slightly (∼10%), but reliably, more pCaMKII+ PSDs than did other fields in both the unsupervised exploration and contingency groups (p < 0.01 for both groups). We therefore recalculated Z-scores for the CA3c sampling zones independently of zones covering the rest of the cross section. The use of Z-scores to normalize counts (percentage double labeled) across sections and animals results in occasional high values, usually on sections with low variability across the 42 sampling fields. The resultant distribution of Z-scores for a group of animals thus had long rightward tail. This can introduce serious distortions to the group mean for a set of eight rats. We therefore contracted the scale by assigning each of the 42 sampling fields, on a single tissue section, one of three double-label scores: 0 (Z < 1), 1.0 (1 ≥ Z < 1.5), or 2.0 (Z ≥ 1.5) or by recalculating the Z-values in terms of a sigmoidal (exponential; y = 1/(1+ e−x) fit. Finally, we summed the categorized or exponential values, for each sampling field, across rostrocaudal sections for each animal and then calculated a group mean score. These procedures were intended to identify pCaMKII “hot spots” that did or did not extend across multiple tissue sections and to assign higher single animal scores to the latter. Subsequent treatment of the data addressed two questions: (1) Do either of the two behavioral paradigms result in statistically reliable regional differences in the hot spot scores, as assessed by one-way repeated-measures ANOVA? and (2) Do such patterns differ between the two groups (two-way ANOVA)?
Stability of LTP-related changes in the percentage of synapses associated with high concentrations of pCaMKII.
We investigated the duration of increases in CaMKII phosphorylation at synapses, as assessed with methods comparable to those described above, following induction of LTP in hippocampal slices. Briefly, adult male rats were killed and slices were collected from the rostral hippocampus. Slices were placed in an interface recording chamber. Recording began 60 min later (Rex et al., 2009; Babayan et al., 2012). Stimulation electrodes were placed in stratum radiatum of fields CA1a and CA1c and field EPSPs were recorded from field CA1b stratum radiatum. Potentiation was induced by theta burst stimulation (TBS; 10 bursts of four pulses at 100 Hz with 200 ms between bursts) applied via both stimulating electrodes (30 s delay) with voltage set at twice the level used to assess baseline responses; two electrodes and higher currents were used to increase the number of stimulated synapses. Slices used for microscopic analysis were harvested 7–90 min after TBS and fixed in 4% paraformaldehyde in 0.1 m sodium phosphate buffer, pH 7.2. Fixed slices were sectioned at 20 μm and the slide-mounted tissue was processed for double-labeling immunofluorescence as above. High-power image z-stacks (0.2 μm steps) were collected at 63× objective magnification using widefield epifluorescence microscopy and processed for restorative deconvolution (Volocity 4.1, PerkinElmer; Rex et al., 2009; Chen et al., 2010a). Immunolabeled synaptic elements were measured (counted, volume and intensities assessed) from a sample field (136 × 105 × 3 μm) within the CA1 stratum radiatum zone of physiological recording in 3–5 tissue sections, situated 20–80 μm below the surface of each slice. Image intensity normalization and volumetric object identification and measurements were performed as described previously (Rex et al., 2009; Chen et al., 2010a). Notably, the mean length of synapses in slices, as measured with electron microscopy, is very similar to that found in in vivo (Lee et al., 1981). Results are expressed as the number of densely labeled contacts (Fig. 1B) relative to the value found in slices, from the same animal, given three stimulation pulses per minute (no TBS).
Results
The behavioral paradigms used in the present studies were intended to minimize activity differences between two groups that did (contingency) or did not (unsupervised exploration) interact with a response-related negative cue. Preliminary studies identified mildly aversive operant cues that did not produce freezing or other signs of abnormal behavior. Nonetheless, while the free-exploration rats distributed their time equally between the two compartments (Fig. 2A), the rats exposed to the sound/light avoided the pertinent room (Fig. 2B). This pattern was observed for each of the eight rats in the two groups (Fig. 2C). Importantly, the contingency animals periodically triggered the signals with short moves into the room throughout the trial (data not shown). Exploratory activity, as assessed by total distance traveled during the session, tended to be slightly lower in the contingency group (63.9 ± 9.4 m) than in the unsupervised group (79.6 ± 7.8 m), but this difference did not approach statistical significance (p > 0.20; two-tailed t test). Reductions in activity over time in the test chamber (habituation), a measure of short-term memory, occurred at similar rates in the two groups: the mean of the individual slopes for the exploration group was −0.56 ± 0.05 while the corresponding values for the contingency animals were −0.55 ± 0.08 (p > 0.76; Fig. 2D), a result suggesting that stress and arousal levels were not greatly different between groups.
Figure 2.

Behavioral analyses demonstrate differences in exploratory behavior between experimental groups. One group (contingency) explored freely for 5 min, after which entry into one compartment (Room 1) triggered a flashing light and a buzzer over the remaining 25 min; the second (unsupervised “exploration”) group was allowed explore both rooms with no contingencies for 30 min. A, B, Heat maps show the time spent at different locations over 30 min in the two compartments by representative rats from each group (red > yellow > green > blue). C, Quantification of time spent in Room 1 for each group, in 5 min time segments over the 30 min session (n = 8/group). Note the steep drop after minute 5 for the contingency group. D, Distance traveled, in both compartments, by unsupervised “exploration” and response “contingency” groups demonstrates similar habituation curves. E, Comparison of distance traveled per 5 min bin in a separate group (n = 8) of unsupervised exploration rats tested on 2 consecutive days. The between-day difference in these habituation curves was highly significant, as was the total distance traveled over 30 min (p < 0.0001, 2-way ANOVA and t test respectively). F, Same curves as in E but for contingency rats (n = 8; separate set from those in C and D); there were no detectable differences between days 1 and 2.
We ran additional groups (n = 8) to test whether 30 min of experience sufficed to produce long-term memory in unsupervised, free-exploration rats. Habituation and overall activity on day 1 were comparable to that in the day 1 group used for synaptic mapping. However, day 2 activity was greatly reduced relative to day 1 (p < 0.0001, two-way ANOVA for group effects) and, on day 2, the rate of habituation was accelerated (p = 0.028; Fig. 2E). Interpretation of activity patterns for the contingency group, which experienced the strobe/light combination on day 1, is complicated by the difference in the environment (no aversive cues) on day 2. There was, however, no difference in overall activity or habituation rates between days 1 and 2 for these animals (Fig. 2F). This was largely due to a disproportionate exploration of the room that had contained the mildly aversive cues on day 1 (p = 0.005 vs the previously no-cue room). We conclude from these results that a single 30 min exploration session produces robust long-term memory of the total test arena and that introduction of a mildly negative response contingency substantially modifies this effect.
In parallel with tests of whether free exploration produces regionally differentiated increases in synapses colocalized with high concentrations of pCaMKII, we used hippocampal slices to re-examine the argument that the phosphorylated state of the kinase is a stable marker for LTP. TBS was applied to two electrodes activating synapses in the proximal apical dendrites of field CA1b. Slices were collected at 0.5, 7, or 60–90 min poststimulation and processed for dual immunofluorescence localization of pCaMKII T286/287 and PSD-95. Immunolabeling for PSD-95 was used as a marker for excitatory synapses as prior studies have shown that this integral synaptic scaffold protein is densely and exclusively concentrated at asymmetric (excitatory) synapses in the hippocampal molecular layers (Kennedy, 1997; Aoki et al., 2001). The number of contacts colabeled for dense concentrations of pCaMKII in the target field was not increased relative to values in yoked control slices (no TBS) at the earliest time point but was clearly elevated at 7 min; critically, the same magnitude of increase was evident 1 h later (Fig. 3). These results, the first using physiologically realistic patterns of afferent stimulation and single synapse measurements, indicate that CaMKII phosphorylation persists long enough to be detectable after a 30 min training session.
Figure 3.
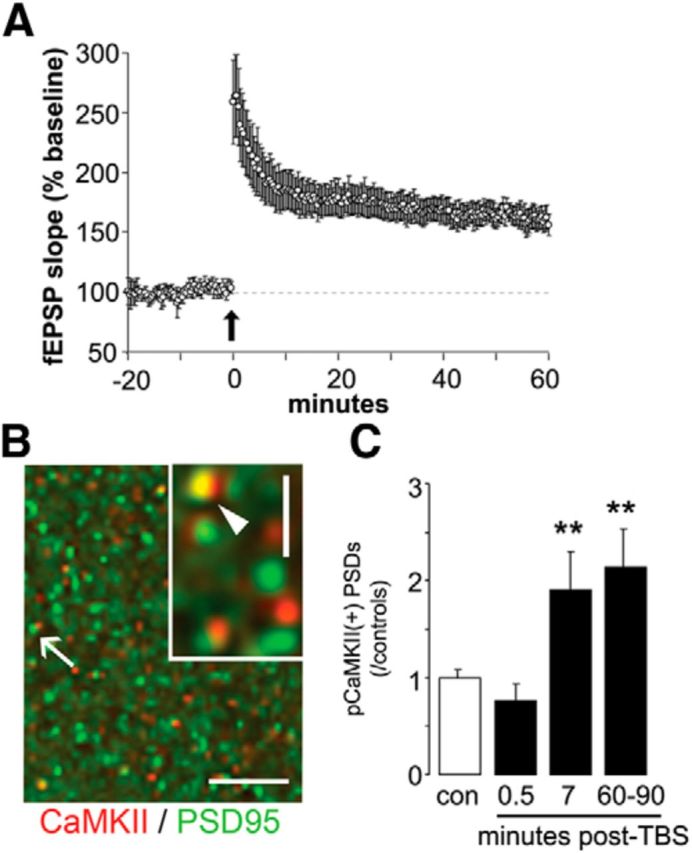
Induction of LTP is accompanied by long-lasting phosphorylation of CaMKII in a subpopulation of hippocampal synapses. A, Plot summarizes the mean field EPSP slopes for a group of slices receiving TBS and recorded for the following 60 min. Arrow indicates the delivery of TBS. B, Double-immunofluorescence localization of total (phosphorylated and unphosphorylated) CaMKII-positive (red) and PSD-95-positive (green) elements in CA1 stratum radiatum of an adult hippocampal slice. The higher resolution inset describes a densely labeled contact (arrow). Scale bar, 10 μm; inset scale bar, 1 μm. C, Blind automated counting shows that TBS increased the number of pCaMKII+ synapses (mean ± SEM) in slices collected at 7 or 60–90 min after stimulation (**p < 0.01, t test vs control slices (con)).
The first experimental question addressed by the present study was whether unsupervised exploration of a novel environment causes consistent regional accumulations (“hot spots”) of pCaMKII+ synapses that are detectable with sample fields of the size used here. The second question involved the prediction that such spatial distributions would be disrupted by addition of a response contingency that interferes with free exploration. As in slice studies described above, dual immunofluorescence was used to quantify number of PSD-95+ synapses associated with pCaMKII T286/287. The mean percentage of double-labeled synapses did not differ between the two groups (free exploration: 15.4 ± 2.5%; contingency: 16.0 ± 2.5%, means ± SDs).
We explored the possibility that the percentage of double-labeled synapses within any given sampling field varies in an orderly manner across 3–4 closely spaced, septotemporal (S-T) levels for that field. However, tests of the idea proved negative: the mean R2 value across regions was 0.01 and the highest values for an individual sampling zone (from 42 regions) within a group did not approach statistical significance. The absence of a relationship between percentage of double-labeled synapses and S-T position suggested that it would be useful to calculate the means and SDs for the raw Z-score data from all sections for each of the sampling fields. Regional variations in the incidence of pCaMKII+ synapses across the 42 anatomical zones were highly significant for both groups (ANOVA: p < 0.0001), indicating that doubled-labeled contacts are not homogeneously distributed. The mean scores for the fields were positively correlated between the two groups (r2 = 0.34, p < 0.0001). Surprisingly, the regional agreements were not randomly distributed across the hippocampal cross section but instead were restricted to two large blocks of contiguous sampling zones: the DG/CA3c complex and the apical dendrites of field CA1 (Fig. 4A,B, gray). Between-group correlations for the 21 subfields were very high for these three blocks (r2 = 0.68, p < 0.0001), but were not at all present for the intervening, contiguous block composed of the basal dendrites of CA1 and the entire CA3a,b region (r2 = 0.001). The striking similarity in the distribution of scores across half of the hippocampus provides evidence for the reliability of the automated sampling methods used in these studies.
Figure 4.

Mean Z-score values for doubled-labeled synapses across 42 sampling zones demonstrate broad regions with values that are correlated between unsupervised exploration and contingency groups. Values (Z-score means ± SEM) were calculated from all sections collected from eight rats per group. The dashed line indicates the mean of positive values for both experimental groups; the height of the gray boxes equals 1 SD above that mean. The gray boxes highlight areas (21 zones) for which the scores in the two groups were strongly correlated. Patterns in the remaining areas were not correlated and were statistically different (p = 0.005). See Figure 1 for abbreviations identifying the lamina.
As suggested by results presented in Figure 4, the distribution of subfields with high numbers of pCaMKII+ synapses clearly differed between the two groups in the middle (uncorrelated) region of hippocampus (p = 0.012). In all, free exploration, resulting in long-term memory of a novel environment, generated a regional profile of modified synapses in one large segment of hippocampus that was similar to that found in animals with restricted exploration, and a very different pattern in a second segment.
Next, we searched for regional patterns on an animal-by-animal basis. Because of variations in immunostaining intensity between sections, the percentage double-labeled values for each section were converted into Z-scores. The resultant distribution was rightward skewed because of occasional high values, typically on sections with low between-site variability (see Materials and Methods). We therefore contracted the scale by categorizing the Z-scores as 0 (Z < 1.0), 1 (Z from 1.0–1.49), or 2 (Z ≥ 1.5; calculating the Z values as exponentials was also used; see below). The thresholded scores were then summed across sections to provide a value for each zone for each rat. The plots in Figure 5A,B describe the mean values for the eight rats in each of the two groups. Multiple hot spots were evident in the unsupervised exploration group and the overall variation in values between zones was significant (p < 0.0001; ANOVA). The contingency group also had a highly differentiated regional distribution (p < 0.0001) but one that was more centered on field CA3a,b. Spatial patterns differed between the two groups (p = 0.02, two-way ANOVA), indicating that free exploration concentrates LTP-related synaptic modifications in a manner that is not seen when free access to a large part of the environment is restricted by a contingency.
Figure 5.

Distribution of sample zones containing a high percentage of PSDs associated with dense concentrations of pCaMKII T286/287. Z-scores for each section were assigned to one of three numerical categories (0, 1, 2) and then values for each sampling zone were summed across sections from individual rats, thereby generating a “hot spot” value for each animal. Plots show means (±SEM) for the Exploration (A) and Contingency (B) groups (n = 8 each). In each plot, the dashed line represents the mean value across all sampling zones for both groups; the height of the gray boxes is 1 SD above that mean. The z-score distributions were correlated between the experimental groups for two collections of contiguous zones (gray boxes) but not for the intervening zone. The overall distributions were statistically distinct between groups with the major differences being in regions without the gray highlight (Fig. 1, abbreviations). Line drawings of hippocampal cross sections at the bottom of each panel illustrate, with color fill, the distribution of sample zones with hot spot scores >1 SD from the overall mean score; the gray fill indicates zones with correlated labeling patterns between the two experimental groups.
Thresholding of the Z-scores for individual rats weakened, but did not entirely eliminate, the between-group correlations for scores across sampling zones (r2 = 0.12, p = 0.024). Notably, as in Figure 4, the correspondences were restricted to two blocks of contiguous subfields (Fig. 5, gray boxes in plots; r2 = 0.38, p = 0.003). Values for the large intervening area were again not correlated between groups (r2 = 0.01) and the two distributions in this zone were distinctly different (p = 0.017). This analysis confirms the assumption that the majority of animals had hot spots at a relatively small number of sites and that the distribution of these differed between groups.
Repeating the analysis using a logistic function produced the same general pattern of results as obtained with thresholds. Double labeling was not homogeneously distributed in either group (p < 0.0001) and a strong correlation between the two groups was found for the DG, CA3c, and apical CA1 (21 sampling sites: r2 = 0.73), but not for the remainder of the hippocampus (r2 = 0.0004). The pattern in the latter zone was different for the free exploration versus contingency animals (p < 0.021).
The overlap in the patterns exhibited by the two groups could reflect the fact that both were trained in the same apparatus and so, presumably, had some learning in common. However, it is possible that the similarities reflect regional variations in “baseline” percentage of PSDs associated with high concentrations of pCaMKII. We investigated this by processing brains for seven home-cage control rats using the same immunostaining and analytical methods used for the learning groups. Interestingly, the mean percentage of synapses associated with dense concentrations of phosphorylated kinase (13.6 ± 3.2%, mean ± SD) was lower than that found for either the exploration (−12%: p = 0.025, two-tailed t test) or contingency (−15%: p = 0.009) groups. The pCaMKII+ PSDs were not homogeneously distributed in these controls (p = 0.005), indicating that significant baseline effects were likely present in the two learning groups. Tests for this produced a striking result: the scores for the home-cage control rats correlated across regions with those for the contingency group (r2 = 0.39, p < 0.0001), but not with the scores for the unsupervised exploration group (r2 = 0.07). Moreover, the good agreement between home-cage control and contingency animals was restricted to that segment of hippocampus in which regional agreements were not found in the two learning groups (home cage vs contingency: CA3a,b and basal dendrites of CA1, r2 = 0.58, p < 0.0001; DG/CA3c and apical dendrites of CA1, r2 = 0.26, p > 0.25). The corresponding values for comparisons between home-cage control and exploration rats were r2 = 0.07 and r2 = 0.02. In accord with these correlations, the regional distribution of thresholded scores across all 42 sampling areas was distinctly different between home-cage control and exploration groups (p = 0.003) but not between home-cage and contingency groups (p = 0.648).
These results strongly suggest that many of the elevated hot spot scores in the negative contingency group in field CA3a,b are not due to experience in the testing chamber but instead reflect baseline variations in the percentage of double-labeled synapses. Conversely, scores in the free-exploration animals are not related to controls (or operants) and thus can be reasonably ascribed to unsupervised learning of a novel environment.
We further examined the contributions of baseline variations by subtracting the mean home-cage control value for each of the sample zones from values determined for individual unsupervised exploration and contingency rats (Fig. 6A,B). The correlation between the two learning groups for the DG/CA3c and apical dendrites of CA1 (gray boxes) was still in place after this subtraction (r2 = 0.66). Overall, the two regional distributions were different (p = 0.02) with most of the effect being due to values in the noncorrelated region (p = 0.004); importantly, as is evident from Figure 6, clear positive peaks (e.g., 1 SD greater than the mean for all positive sites) were eliminated from the contingency group. In unsupervised exploration animals, four regions meeting this criterion were present and the mean of all positive values was greater than that for the contingency group (p = 0.031). Three zones (indicated by x's in Fig. 6) in the unsupervised exploration group differed from ≥2 other areas in that same group by p < 0.001 in post hoc tests after one-way ANOVA. There were no zones of this type in the contingency group. We interpret these results as indicating that unsupervised learning of an open field reliably causes large LTP-related synaptic changes in a surprisingly small number of sites, and that this does not occur if behavior is channeled by the introduction of a response contingency.
Figure 6.

”Hot spot” scores for unsupervised Exploration and Contingency groups following subtraction of mean values from home-cage animals. As previously, the dotted line is the mean of positive values for the two groups and the height of the gray boxes is 1 SD above that mean. Subtracting home-cage scores reduced several strongly positive values in the exploration animals, mainly in stratum oriens (SO) of CA3a,b, thereby increasing the relative sizes of the remaining hot spots. The same subtraction procedure eliminated all values >1 SD above the mean in the contingency group; despite this, the 21 sampling fields within the gray boxes were highly correlated with the corresponding sites in the unsupervised exploration group. The overall patterns were statistically different between the groups, particularly in the noncorrelated region between the gray boxes. The x's indicate three regions that were robustly different (p < 0.001) than ≥2 of the remaining sampling zones in the same Exploration group.
Discussion
The above results indicate that regional differences in the percentage of synapses associated with high levels of pCaMKII are reproducible across animals. This finding establishes the feasibility of using quantitative, dual immunostaining methods to create distinct maps of LTP-related synaptic changes following different types of learning. The present studies describe a first map of this kind using rats learning a simple spatial environment.
The regional distribution of synapses containing high concentrations of the LTP marker was highly differentiated in rostral hippocampus following a 30 min unsupervised exploration session with only a small number of anatomical regions containing high values. If the latter constitute memory-encoding sites for spatial information, an operation known to be dependent on the sampled rostral aspect of hippocampus (Moser et al., 1993; Fanselow and Dong, 2010; Barrett et al., 2011), then they should not be present in animals for which free exploration was spatially restricted. We tested this with rats placed in the same environment, but with a mildly negative stimulus that was activated by movement into one-half of the test arena. Comparison of the regional patterns found in the two conditions produced an unexpected result: between-group agreement in two large areas of contiguous sampling fields but no correlation in the remainder. Importantly, the regional distribution of pCaMKII+ PSDs in the latter, broad region clearly differed between the unsupervised exploration versus response contingency groups. In all, exploration triggers an increase in synapses containing an LTP marker at discrete sites in rostral hippocampus and the introduction of a contingency disrupts the resultant regional pattern.
An analysis based on individual animals and using thresholded Z-scores, or Z-scores expressed as sigmoidal values, produced results comparable to those just described for all sections in a group. It also demonstrated that the regional pattern in the contingency rats correlated with that in animals that had not been placed in the test apparatus, something that did not hold for the unsupervised exploration group. Subtracting the baseline, control values from zone scores for the two learning groups did not strongly affect the agreement between them for the DG/CA3c and apical dendrites of CA1 (Fig. 6, gray areas), but eliminated what had seemed to be “hot spots” from the contingency rats. We propose that learning by the contingency rats likely caused deviations from the baseline pattern, and thus the correlation with the unsupervised group across two large segments of hippocampus, but the magnitude of these at any single sampling zone was too small to be detected with the group sizes used here. Free exploration, on the other hand, reliably resulted in a regional distribution of synapses associated with the LTP marker that is not related to the pattern found in home-cage control rats and includes sampling sites containing clearly elevated percentages of pCaMKII+ synapses (medial CA1a stratum oriens, medial CA3 stratum lacunosum-moleculare, medial CA3c stratum oriens; Fig. 7).
Figure 7.

Schematic summarizing effects of learning on numbers of pCaMKII+ PSDs in the different hippocampal subfields. As in schematics within Figure 4, zones with gray shading exhibited numbers of pCaMKII+ PSDs that were correlated between the unsupervised exploration and contingency groups (i.e., same regions plotted over gray backdrop in Figs. 3–5). For areas highlighted in rose color, numbers of densely pCaMKII+ PSDs were, in free-exploration rats only, both >1 SD from the mean value for the two learning groups and significantly >1 SD from the mean in ≥2 other sample zones in the same group. Hot spots meeting these same criteria were not present in the contingency group. Abbreviations as in Figure 1; DG ML, DG molecular layer.
The presence of hot spots in the free-exploration group cannot be taken as evidence for the absence of encoding at other regions in individual rats; it does indicate, however, that large changes at particular sites outside the hot regions do not occur in a sizable percentage of the unsupervised learning group.
Learning that may be encoded at further, more temporal sites in the hippocampus (for instance, learning by the contingency rats of the negative contingency itself) is not addressed here and remains to be investigated.
How such spatially isolated hot spots are generated is unclear. Activation of synaptic markers for LTP appears in a spatially restricted population of synapses shortly after delivery of TBS to a group of adjacent fibers (Chen et al., 2007), many of which form connections with the target site. While it is very unlikely that this degree of input focusing occurs during behavior, there is evidence that adjacent cells in hippocampus innervate local neighborhoods of spines (Brivanlou et al., 2004; Takahashi et al., 2012) and that potentiated synapses tend to occur in microclusters following LTP induction (Govindarajan et al., 2006; Kramár et al., 2012). But anatomical work indicates that single axons form connections throughout much of the mediolateral extent of a given lamina, as well as across a relatively broad span of the longitudinal axis of hippocampus (Li et al., 1994; Wittner et al., 2007). Such an arrangement does not easily lend itself to the generation of a high concentration of double-labeled synapses in, for example, a mediolaterally restricted patch of the CA1 basal dendrites (Fig. 7). A possible explanation for this outcome is that axons do not form synapses at uniform density throughout the serial fields they innervate; different neurons within a subzone (e.g., CA3a) could under these circumstances give rise to efferents that converge on spatially restricted portions of a target lamina. A similar “hidden” mosaic argument could be made for the cells in medial entorhinal cortex that project to the prominent hot spot in stratum lacunosum/moleculare of field CA3a,b (Figs. 6, 7). These hypotheses make the testable prediction that discrete injections of retrograde tracers into a hot spot will uncover a different pattern of afferents than would be identified with injections into the areas surrounding that spot.
Whatever their anatomical origins, the results described here speak to the long-standing question of whether encoding sites for a particular instance of learning are localized or evenly dispersed within a brain region, an issue of evident importance to hypotheses about how memories are organized and retrieved. The highly differentiated distribution of pCaMKII-enriched synapses we have found raises the possibility that particular subfields are predisposed to capture particular types information. Further work mapping potentiated synapses, using different types of spatial environments, and other forms of unsupervised learning dependent upon rostral hippocampus (e.g., object location memory) will serve to test the idea that storage locales are related to types of encoded environmental data. Beyond this lies the very challenging problem of how the material represented by scattered hot spots becomes integrated into recognizable output to the cortex. Regarding this point, it is of interest that the most prominent concentration of pCaMKII-enriched synapses in the present study occurred in the efferent stage of hippocampal circuitry (field CA1) and in stratum oriens, a lamina containing synapses that potently activate local pyramidal cells.
Footnotes
This work was supported by Office of Naval Research Grant N00014-10-1-007 (G.L.), National Science Foundation Grants #1146708 (G.L.) and DGE-0808392 (C.D.C.), and National Institutes of Health Grant NS045260 (C.M.G., G.L.).
The authors declare no competing financial interests.
References
- Abraham WC, Williams JM. Properties and mechanisms of LTP maintenance. Neuroscientist. 2003;9:463–474. doi: 10.1177/1073858403259119. [DOI] [PubMed] [Google Scholar]
- Aoki C, Miko I, Oviedo H, Mikeladze-Dvali T, Alexandre L, Sweeney N, Bredt DS. Electron microscopic immunocytochemical detection of PSD-95, PSD-93, SAP-102, and SAP-97 at postsynaptic, presynaptic, and nonsynaptic sites of adult and neonatal rat visual cortex. Synapse. 2001;40:239–257. doi: 10.1002/syn.1047. [DOI] [PubMed] [Google Scholar]
- Babayan AH, Kramár EA, Barrett RM, Jafari M, Häettig J, Chen LY, Rex CS, Lauterborn JC, Wood MA, Gall CM, Lynch G. Integrin dynamics produce a delayed stage of long-term potentiation and memory consolidation. J Neurosci. 2012;32:12854–12861. doi: 10.1523/JNEUROSCI.2024-12.2012. [DOI] [PMC free article] [PubMed] [Google Scholar]
- Barrett RM, Malvaez M, Kramar E, Matheos DP, Arrizon A, Cabrera SM, Lynch G, Greene RW, Wood MA. Hippocampal focal knockout of CBP affects specific histone modifications, long-term potentiation, and long-term memory. Neuropsychopharmacology. 2011;36:1545–1556. doi: 10.1038/npp.2011.61. [DOI] [PMC free article] [PubMed] [Google Scholar]
- Barria A, Muller D, Derkach V, Griffith LC, Soderling TR. Regulatory phosphorylation of AMPA-type glutamate receptors by CaM-KII during long-term potentiation. Science. 1997;276:2042–2045. doi: 10.1126/science.276.5321.2042. [DOI] [PubMed] [Google Scholar]
- Bliss TVP, Lomo T. Long-lasting potentiation of synaptic transmission in the dentate area of the anesthetized rabbit following stimulation of the perforant path. J Physiol. 1973;232:334–356. doi: 10.1113/jphysiol.1973.sp010273. [DOI] [PMC free article] [PubMed] [Google Scholar]
- Brivanlou IH, Dantzker JL, Stevens CF, Callaway EM. Topographic specificity of functional connections from hippocampal CA3 to CA1. Proc Natl Acad Sci U S A. 2004;101:2560–2565. doi: 10.1073/pnas.0308577100. [DOI] [PMC free article] [PubMed] [Google Scholar]
- Chen LY, Rex CS, Casale MS, Gall CM, Lynch G. Changes in synaptic morphology accompany actin signaling during LTP. J Neurosci. 2007;27:5363–5372. doi: 10.1523/JNEUROSCI.0164-07.2007. [DOI] [PMC free article] [PubMed] [Google Scholar]
- Chen LY, Rex CS, Sanaiha Y, Lynch G, Gall CM. Learning induces neurotrophin signaling at hippocampal synapses. Proc Natl Acad Sci U S A. 2010a;107:7030–7035. doi: 10.1073/pnas.0912973107. [DOI] [PMC free article] [PubMed] [Google Scholar]
- Chen LY, Rex CS, Pham DT, Lynch G, Gall CM. BDNF signaling during learning is regionally differentiated within hippocampus. J Neurosci. 2010b;30:15097–15101. doi: 10.1523/JNEUROSCI.3549-10.2010. [DOI] [PMC free article] [PubMed] [Google Scholar]
- Cheriyan J, Kumar P, Mayadevi M, Surolia A, Omkumar RV. Calcium/calmodulin dependent protein kinase II bound to NMDA receptor 2B subunit exhibits increased ATP affinity and attenuated dephosphorylation. PLoS One. 2011;6:e16495. doi: 10.1371/journal.pone.0016495. [DOI] [PMC free article] [PubMed] [Google Scholar]
- Fanselow MS, Dong HW. Are the dorsal and ventral hippocampus functionally distinct structures? Neuron. 2010;65:7–19. doi: 10.1016/j.neuron.2009.11.031. [DOI] [PMC free article] [PubMed] [Google Scholar]
- Fedulov V, Rex CS, Simmons DA, Palmer L, Gall CM, Lynch G. Evidence that long-term potentiation occurs within individual hippocampal synapses during learning. J Neurosci. 2007;27:8031–8039. doi: 10.1523/JNEUROSCI.2003-07.2007. [DOI] [PMC free article] [PubMed] [Google Scholar]
- Govindarajan A, Kelleher RJ, Tonegawa S. A clustered plasticity model of long-term memory engrams. Nat Rev Neurosci. 2006;7:575–583. doi: 10.1038/nrn1937. [DOI] [PubMed] [Google Scholar]
- Haug FM. Light microscopical mapping of the hippocampal region, the pyriform cortex and the corticomedial amygdaloid nuclei of the rat with Timm's sulphide silver method. I. Area dentata, hippocampus and subiculum. Z Anat Entwicklungsgesch. 1974;145:1–27. doi: 10.1007/BF00519123. [DOI] [PubMed] [Google Scholar]
- Kennedy MB. The postsynaptic density at glutamatergic synapses. Trends Neurosci. 1997;20:264–268. doi: 10.1016/s0166-2236(96)01033-8. [DOI] [PubMed] [Google Scholar]
- Kramár EA, Babayan AH, Gavin CF, Cox CD, Jafari M, Gall CM, Rumbaugh G, Lynch G. Synaptic evidence for the efficacy of spaced learning. Proc Natl Acad Sci U S A. 2012;109:5121–5126. doi: 10.1073/pnas.1120700109. [DOI] [PMC free article] [PubMed] [Google Scholar]
- Lamprecht R, Farb CR, Rodrigues SM, LeDoux JE. Fear conditioning drives profilin into amygdala dendritic spines. Nat Neurosci. 2006;9:481–483. doi: 10.1038/nn1672. [DOI] [PubMed] [Google Scholar]
- Lee KS, Oliver M, Schottler G, Lynch G. Electron microscopic studies in brain slices: the effects of high-frequency stimulation of dendritic ultrastructure. In: Kerkut GA, Wheal HV, editors. Electrophysiology of isolated mammalian CNS preparations. New York: Academic; 1981. pp. 189–211. [Google Scholar]
- Li XG, Somogyi P, Ylinen A, Buzsáki G. The hippocampal CA3 network: an in vivo intracellular labeling study. J Comp Neurol. 1994;339:181–208. doi: 10.1002/cne.903390204. [DOI] [PubMed] [Google Scholar]
- Lisman J, Schulman H, Cline H. The molecular basis of CaMKII function in synaptic and behavioural memory. Nat Rev Neurosci. 2002;3:175–190. doi: 10.1038/nrn753. [DOI] [PubMed] [Google Scholar]
- Lisman J, Yasuda R, Raghavachari S. Mechanisms of CaMKII action in long-term potentiation. Nat Rev Neurosci. 2012;13:169–182. doi: 10.1038/nrn3192. [DOI] [PMC free article] [PubMed] [Google Scholar]
- Lynch G, Rex CS, Chen LY, Gall CM. Synaptic mechanisms for encoding memory. In: Koob G, Thompson RF, Le Moal M, Shors T, editors. Encyclopedia of behavioral neuroscience. London: Academic; 2010. pp. 356–364. [Google Scholar]
- Morris RG, Anderson E, Lynch GS, Baudry M. Selective impairment of learning and blockade of long-term potentiation by an N-methyl-d-aspartate receptor antagonist, AP5. Nature. 1986;319:774–776. doi: 10.1038/319774a0. [DOI] [PubMed] [Google Scholar]
- Moser E, Moser MB, Andersen P. Spatial learning impairment parallels the magnitude of dorsal hippocampal lesions, but is hardly present following ventral lesions. J Neurosci. 1993;13:3916–3925. doi: 10.1523/JNEUROSCI.13-09-03916.1993. [DOI] [PMC free article] [PubMed] [Google Scholar]
- Mullasseril P, Dosemeci A, Lisman JE, Griffith LC. A structural mechanism for maintaining the ‘on-state’ of the CaMKII memory switch in the post-synaptic density. J Neurochem. 2007;103:357–364. doi: 10.1111/j.1471-4159.2007.04744.x. [DOI] [PMC free article] [PubMed] [Google Scholar]
- Otmakhov N, Tao-Cheng JH, Carpenter S, Asrican B, Dosemeci A, Reese TS, Lisman J. Persistent accumulation of calcium/calmodulin-dependent protein kinase II in dendritic spines after induction of NMDA receptor-dependent chemical long-term potentiation. J Neurosci. 2004;24:9324–9331. doi: 10.1523/JNEUROSCI.2350-04.2004. [DOI] [PMC free article] [PubMed] [Google Scholar]
- Patterson M, Yasuda R. Signalling pathways underlying structural plasticity of dendritic spines. Br J Pharmacol. 2011;163:1626–1638. doi: 10.1111/j.1476-5381.2011.01328.x. [DOI] [PMC free article] [PubMed] [Google Scholar]
- Paxinos G, Watson C. The rat brain in stereotaxic coordinates. sixth edition. San Diego: Elsevier; 2007. [Google Scholar]
- Rex CS, Chen LY, Sharma A, Liu J, Babayan AH, Gall CM, Lynch G. Different Rho GTPase-dependent signaling pathways initiate sequential steps in the consolidation of long-term potentiation. J Cell Biol. 2009;186:85–97. doi: 10.1083/jcb.200901084. [DOI] [PMC free article] [PubMed] [Google Scholar]
- Roman F, Staubli U, Lynch G. Evidence for synaptic potentiation in a cortical network during learning. Brain Res. 1987;418:221–226. doi: 10.1016/0006-8993(87)90089-8. [DOI] [PubMed] [Google Scholar]
- Rose J, Jin SX, Craig AM. Heterosynaptic molecular dynamics: locally induced propagating synaptic accumulation of CaM kinase II. Neuron. 2009;61:351–358. doi: 10.1016/j.neuron.2008.12.030. [DOI] [PMC free article] [PubMed] [Google Scholar]
- Sajikumar S, Li Q, Abraham WC, Xiao ZC. Priming of short-term potentiation and synaptic tagging/capture mechanisms by ryanodine receptor activation in rat hippocampal CA1. Learn Mem. 2009;16:178–186. doi: 10.1101/lm.1255909. [DOI] [PubMed] [Google Scholar]
- Sakaguchi M, Hayashi Y. Catching the engram: strategies to examine the memory trace. Mol Brain. 2012;5:32. doi: 10.1186/1756-6606-5-32. [DOI] [PMC free article] [PubMed] [Google Scholar]
- Schikorski T, Stevens CF. Quantitative ultrastructural analysis of hippocampal excitatory synapses. J Neurosci. 1997;17:5858–5867. doi: 10.1523/JNEUROSCI.17-15-05858.1997. [DOI] [PMC free article] [PubMed] [Google Scholar]
- Seese RR, Babayan AH, Katz AM, Cox CD, Lauterborn JC, Lynch G, Gall CM. LTP induction translocates cortactin at distant synapses in wild-type but not Fmr1 knock-out mice. J Neurosci. 2012;32:7403–7413. doi: 10.1523/JNEUROSCI.0968-12.2012. [DOI] [PMC free article] [PubMed] [Google Scholar]
- Swain RA, Thompson RF. In search of engrams. Ann N Y Acad Sci. 1993;702:27–39. doi: 10.1111/j.1749-6632.1993.tb17240.x. [DOI] [PubMed] [Google Scholar]
- Takahashi N, Kitamura K, Matsuo N, Mayford M, Kano M, Matsuki N, Ikegaya Y. Locally synchronized synaptic inputs. Science. 2012;335:353–356. doi: 10.1126/science.1210362. [DOI] [PubMed] [Google Scholar]
- Thompson RF. The search for the engram. Am Psychol. 1976;31:209–227. doi: 10.1037//0003-066x.31.3.209. [DOI] [PubMed] [Google Scholar]
- Wittner L, Henze DA, Záborszky L, Buzsáki G. Three-dimensional reconstruction of the axon arbor of a CA3 pyramidal cell recorded and filled in vivo. Brain Struct Funct. 2007;212:75–83. doi: 10.1007/s00429-007-0148-y. [DOI] [PMC free article] [PubMed] [Google Scholar]