

Abstract
Parkinson's disease (PD) has multiple proposed etiologies with implication of abnormalities in cellular homeostasis ranging from proteostasis to mitochondrial dynamics to energy metabolism. PINK1 mutations are associated with familial PD and here we discover a novel PINK1 mechanism in cellular stress response. Using hypoxia as a physiological trigger of oxidative stress and disruption in energy metabolism, we demonstrate that PINK1−/− mouse cells exhibited significantly reduced induction of HIF-1α protein, HIF-1α transcriptional activity, and hypoxia-responsive gene upregulation. Loss of PINK1 impairs both hypoxia-induced 4E-BP1 dephosphorylation and increase in the ratio of internal ribosomal entry site (IRES)-dependent to cap-dependent translation. These data suggest that PINK1 mediates adaptive responses by activating IRES-dependent translation, and the impairments in translation and the HIF-1α pathway may contribute to PINK1-associated PD pathogenesis that manifests under cellular stress.
Keywords: 4EBP, hypoxia, IRES, Parkinson's disease, PINK1, translation
Introduction
PTEN-induced putative kinase-1 (PINK1) is a nuclear-encoded serine/threonine kinase that localizes to mitochondria and cytosol (Lin and Kang, 2008) and promotes cell survival through distinct functions in both cellular compartments (Pridgeon et al., 2007; Haque et al., 2008). Mutations in PINK1 that results in decreased kinase activity or a loss in protein stability are linked to autosomal recessive Parkinson's disease (PD; Valente et al., 2004; Beilina et al., 2005). In the absence of wild-type (WT) PINK1, cells exhibit impairments in bioenergetics and mitochondrial homeostasis. Well characterized deficits include decreased mitochondrial membrane potential, reduced complex I activity, lowered ATP production, increased oxidative stress, and abnormal mitochondrial morphology such as fragmented cristae (Clark et al., 2006; Park et al., 2006; Gautier et al., 2008; Liu et al., 2009; Yao et al., 2011), but the mechanisms for these observed changes have been elusive.
HIF-1α is a major transcriptional factor that under hypoxia binds to hypoxia-response elements (HREs) in the promoter and upregulates HRE-containing genes that govern a multitude of cellular functions, ranging from biosynthetic pathways to glucose metabolism to cell viability (Ke and Costa, 2006; Majmundar et al., 2010). A major role of HIF-1α activation is to reprogram cellular metabolism by altering glucose utilization in cells, promoting a shift from oxidative to glycolytic metabolism (Lum et al., 2007). This action helps to restore homeostasis by supplying ATP through glycolysis while preventing further reactive oxygen species (ROS) generation from oxidative phosphorylation (OXPHOS) activity. Compared with WT cells, HIF-1α-null cells generate more ROS from increased ATP production and lose the ability for mitophagy as an adaptive response for maintaining cell viability to prolonged hypoxia (Zhang et al., 2008). In essence, HIF-1α-dependent metabolic changes fuel cell proliferation in mitotic cells and cell survival in postmitotic cells.
Several lines of evidence link HIF-1α to PD. First, some genes containing HRE in their promoter sequences are downregulated in the postmortem PD brains, for example, VEGF and hexokinase (Grünblatt et al., 2004; Miller et al., 2006). Second, EGLN1, a prolyl hydroxylase enzyme regulating HIF-1α protein level by proteasome degradation, was found to be upregulated in PD brains (Grünblatt et al., 2004; Lee et al., 2009). Third, iron accumulation, common in PD patients, inactivates HIF-1α activity, as iron is a necessary cofactor for prolyl hydroxylases (Sofic et al., 1988; Zecca et al., 2004). Fourth, HIF-1α is necessary for midbrain progenitor cell survival and proliferation (Milosevic et al., 2007). Fifth, PARK9 gene ATP13A2 is regulated by hypoxia (Xu et al., 2012). In this study, we demonstrate that PINK1 deficiency attenuated HIF-1α protein induction under hypoxia, leading to a reduced HIF-1α transcriptional activity and induction of HRE genes. This attenuated induction of HIF-1α is likely due to decreased protein translation resulting from an increase in hyperphosphorylated 4E-BP1 and the inability to augment internal ribosomal entry site (IRES)-dependent translation under hypoxia. Our data offer insights into a novel PINK1 mechanism, whereby PINK1 facilitates stress response by activating 4E-BP1 to switch on IRES-dependent translation.
Materials and Methods
cDNA plasmids, antibodies, and chemicals.
p2.1 HRE-luciferase construct, a gift from Nanduri Prabhakar (University of Chicago), was previously generated and described (Semenza et al., 1996). The bicistronic reporter plasmid pcDNA3-RLUC-POLIRES-FLUC, a gift from Nahum Sonenberg (McGill University, Quebec, Canada), was generated and described previously (Poulin et al., 1998). N terminally FLAG-tagged mouse WT 4E-BP1 was PCR cloned from MEF RNA and ligated in EcoRI and BamHI sites of p3xFLAG-Myc-CMV-24 (Sigma). The final expression plasmid was sequence verified and named FLAG-4E-BP1. The following antibodies were purchased commercially: HIF-1α C-20 (LifeSpan BioSciences), human HIF-1α (BD Biosciences), β-actin (Sigma-Aldrich), 4E-BP2, 4E-BP1, p-S65 4E-BP1 antibodies, eIF4G, caspase-3, and hydroxy-HIF-1α (pro564; Cell Signaling Technology). The following chemicals were purchased commercially: deferoxamine mesylate (DFO; Calbiochem), epoxomicin (Calbiochem), and cycloheximide (CHX; Sigma).
Cell cultures.
Generation of PINK1 knock-out (KO) mouse and PINK1 MEF was described previously (Xiong et al., 2009). Congenic PINK1 KO mice of either sex were generated by back crossing up to 10 generations. HEK293 cells were purchased from ATCC. HEK293 and MEF cells were maintained in DMEM (Invitrogen) supplemented with 10% fetal bovine serum (FBS; GemCell) and penicillin/streptomycin (Invitrogen). Primary cortical neuronal cultures were derived from WT C57BL or PINK1 KO mouse embryos of either sex from embryonic day 14–16.Cortical cells were harvested, plated on poly-l-lysine-coated dishes, and maintained in Neurobasal media with B27 supplement, l-glutamine, 5-fluoro-2′-deoxyuridine, and penicillin/streptomycin. Cultures were incubated in 5% CO2 at 37°C until 10–12 days in vitro (DIV).
Hypoxia experiments.
The hypoxic chamber was described previously (Kanao et al., 2010). Briefly, it consists of a humidified, 37°C, CO2- and O2-regulated workstation (Coy Laboratory) maintained at settings of 5% CO2 and 1% O2 or 0.1% O2. O2 electrode calibrations were regularly readjusted using 100% dry N2 and room air as 0% O2 and 20.8% O2 calibration standards. When possible, media was pre-equilibrated to the oxygen tension inside the chamber before experiments. Wash buffers were degassed with N2 for 30 min before use. Hypoxic samples were collected inside the hypoxic chamber and then immediately placed on ice.
Western blot analysis.
Protein quantification was done using the BCA method (Pierce). After electrophoresis with SDS-HEPES-PAGE gel (Pierce), proteins were transferred onto Immobilon PVDF membrane (Millipore). The membranes were blocked for 2 h in blocking buffer (1× Tris-buffered saline, 5% milk, 0.1% Tween 20). Primary antibodies were incubated for overnight in blocking buffer, and secondary antibodies were incubated at room temperature for 1 h in blocking buffer. The membrane was then developed with ECL reagents (Millipore) and imaged with ChemiGenius Bio-Imaging system (Syngene). For infrared quantification, proteins were transferred onto FL-Immobilon PVDF membrane (Millipore). The membranes were blocked for 2 h in Odyssey blocking buffer (LI-COR). Primary and secondary antibodies were diluated in Odyssey blocking buffer containing 0.02% SDS. Membranes were scanned using the Odyssey Infrared Imaging System (LI-COR Biosciences). β-Actin serves as a protein loading control. A representative figure from at least two independent experiments is shown.
Phos-tag gel.
The Phos-tag gel was made with 25 μm Phos-tag acrylamide (Wako Pure Chemical Industries) and 50 μm ZnCl2, as described previously (Kinoshita and Kinoshita-Kikuta, 2011). Cell lysates were treated with lambda protein phosphatase (New England Biolabs) as nonphosphorylated protein controls in Western blots.
TaqMan quantitative PCR.
The following primers were purchased from Integrated DNA Technologies. HIF-1α probe (6-FAM/CTG CCA CTG CCA CCA CAA CT /BHQ_1), HIF-1α fwd (ACC CAG TTA CAG AAA CCT AC), HIF-1α rev (TGC CAC TGT ATG CTG ATG), Glut-1 probe (6-Fam/TGT CGA GCA CTT GTC CCG ACA /BHQ_1), Glut-1 fwd–(ATC ATT GCA GTG GAC TGG TT), Glut-1 rev (CCA TTT CAA CAT CTC GGT TC), BNIP3 probe (Cy5/CAG ACA CCA CAA GAT ACC AAC AGA GC /BHQ_2), BNIP3 fwd (CCA AGA GTT CTC ACT GTG A), BNIP3 rev (CTC TCA ATA TAA TCT TCC TCA GAC), PPIA probe (HEX/CTT GCC ATC CAG CCA TTC AGT CTT G /BHQ_1), PPIA fwd (GCT GGA CCA AAC ACA AAC), PPIA rev (CCA CAA TGT TCA TGC CTT C). VEGFa probe and primer TaqMan gene expression assays were purchased from Applied Biosystems (Assay ID: Mm00437304_m1). RNA from MEF cells or primary cortical neuronal cultures was harvested in RLT buffer with 2-mercaptoethanol and collected using Qiagen RNeasy kit. Equal RNA concentration was used for reverse transcription-quantitative PCR (RT-qPCR) with the iScript Reverse Transcription Supermix (Bio-Rad Laboratories). TaqMan qPCR was performed using a Bio-Rad CFX96 thermocycler.
Luciferase reporter assay.
For HRE reporter assay, MEF cells were transfected with 1 μg of the p2.1 HRE-firefly luciferase and 1 ng of SV40 Renilla luciferase using Lipofectamine 2000 (Invitrogen). For IRES reporter assay, MEF cells were transfected with 1 μg of pcDNA3-RLUC-POLIRES-FLUC and 1 μg of FLAG-4E-BP1 or vector with DharmaFECT Duo (Dharmacon). After 24 h the cells were treated as indicated. Cell lysates were collected and assayed with Dual-Luciferase Reporter Assay System (Promega) outside of the hypoxic chamber. Luminescence was measured using a Tecan Safire 2 microplate reader at Biophysics Core Facility (University of Chicago) and readings were normalized to the protein concentration.
Metabolic labeling.
MEF cells were incubated for 30 min in methionine/cysteine-free DMEM supplemented with 1% dialyzed FBS (Invitrogen). For labeling, 2 ml of DMEM containing 250 μCi/ml of 35S-met/cys trans-label (MP Biomedical) was added to the cells for 10 min and then washed three times with cold PBS before cell lysis. For hypoxia-treated samples, all media were placed inside the hypoxia chamber for 1 h to equilibrate to the oxygen concentration. Cells were lysed in 400 μl IP buffer (750 mm NaCl, 250 mm Tris HCl, pH 7.4, 1.25% NP40, 25 mm EDTA, 1.25% Na-deoxycholate), protease inhibitor cocktail, and PMSF. Five microliters of the final supernatant was used for TCA counts. Equal radioactive counts per sample were used for overnight immunoprecipitation with 5 μl of rabbit anti-HIF-1α antibody. Fifty microliters of protein A beads was added to each sample for 30 min. The beads were washed three times with IP buffer for 15 min each. The beads were then loaded on a 1 m sucrose cushion to remove protein aggregates. The beads were resuspended in 40 μl of 2× SDS sample buffer and boiled for 5 min before loading on SDS-HEPES PAGE gel. Quantification and imaging for radiography was done on the Bio-Rad FX Pro Plus system.
siRNA knockdown.
Gene knockdown in HEK293 cells was performed by transfecting either 5 μm nontargeting siRNA #1 or 5 μm human PINK1 siRNA (J-004030-07-0005) with DharmaFECT 1 according to instructions. Cells were transfected with siRNA for 48 h before experiments. All the reagents were purchased from Dharmacon.
Immunocytochemistry.
MEF cells were fixed in paraformaldehyde (4% for 10 min) and then washed three times in 0.5% Triton X-100. Nonspecific immunoreactivity was blocked with 10% goat serum. Glass coverslips were incubated overnight at 4°C with anti-HIF-1α antibodies. Immunoreactivity to HIF-1α was amplified and detected using an Alexa 546 anti-rabbit IgG antibody. The cells were imaged at University of Chicago Light Microscopy Core Facility, using confocal microscopy (Olympus IX2-UCD microscope) under 40× oil objective with Slidebook 5.0 software. Quantification of nuclear HIF-1α immunostaining was performed with ImageJ. A macro was used to generate an automated mean for the amount of HIF-1α staining located within the area defined by the DAPI stained nucleus. For each treatment group, cells within random fields of view of six coverslips were counted and the results were pooled for two-way ANOVA with Tukey post hoc.
CHX experiment.
MEF cells were incubated for 1 h in methionine/cysteine-free DMEM supplemented with 10% dialyzed FBS (Invitrogen). Cells were then transferred to the hypoxia chamber for 2 h in normal growth media. CHX (60 μg/μl) was added to cells for the indicated amount of time and lysed with IP buffer containing 0.1% SDS, protease inhibitor cocktail, and PMSF. HIF-1α degradation was analyzed using Western blotting techniques.
Intracellular H2O2 measurements.
For H2O2, cells were lysed in 0.2% Triton in PBS and detection of hydrogen peroxide was measured using Amplex red hydrogen peroxide/peroxidase assay (Invitrogen). Fluorescence signal was measured using a Tecan Safire 2 microplate reader and readings were normalized to the protein concentration.
7-Methyl-GTP cap immunoprecipitation.
Immunoprecipitation was performed as previously described (Connolly et al., 2006). Briefly cells were lysed in 0.5% NP-40 IP buffer (50 mm HEPES, pH 7.5, 250 mm NaCl, 0.5% NP-40, 2 mm EDTA) with protease inhibitors and PhosSTOP (Roche). Equal protein concentration and 20 μl of the 7-methyl GTP-Sepharose 4B (m7 GTP) beads (GE Healthcare) were added for overnight immunoprecipitation at 4°C. The beads were washed in 0.5% NP-40 IP buffer three times before boiling in 1× sample buffer and loaded on SDS-HEPES-PAGE gel for Western blotting.
Statistics.
All statistics were performed using SigmaStat (SPSS). Two-way ANOVA was performed with a Tukey post hoc test for statistical significance. Data are represented as mean ± SEM.
Results
Increased apoptosis and oxidative stress in PINK1−/− cells under hypoxia
PINK1 exhibits protective effects against various oxidative stresses, but the role of PINK1 during hypoxia is unknown. First we assessed whether the loss of PINK1 renders the cells more susceptible to hypoxia. We hypothesized that PINK1 is needed to protect against ROS accumulation and cell death under hypoxia. PINK1−/− cells (MEFs and primary cortical neurons) showed more cleaved caspase-3 than PINK1+/+ cells after 2 d of 0.1% O2 hypoxia, indicating increased apoptosis activation (Fig. 1A,B). Intracellular H2O2 level examined by Amplex red assay was significantly higher in PINK1−/− MEFs than in PINK1+/+ MEFs after 2 d of 0.1% O2 treatment (Fig. 1C). PINK1−/− primary cortical neurons also showed a higher level of H2O2 than PINK1+/+ neurons under hypoxia, while no significant differences in H2O2 levels were detected in normoxic conditions (Fig. 1D). Our data suggest that PINK1 may play a protective role under stressful conditions such as hypoxia by attenuating elevation of H2O2 levels.
Figure 1.

Loss of PINK1 increases vulnerability to hypoxic stress. A, B, Increased caspase-3 cleavage in (A) PINK1−/− MEFs or (B) primary cortical neurons when treated with 0.1% O2 for 2 d. Cell lysates were analyzed by Western blot and quantified for cleaved caspase-3 and β-actin. A representative figure from three independent experiments is shown. C, D, Quantifications from three experiments were pooled for two-way ANOVA analysis. Increased intracellular H2O2 level in (C) PINK1−/− MEFs or (D) primary cortical neurons after exposure to 0.1% O2 for 2 d. H2O2 measurements was performed using Amplex red assay with cell lysates. Samples were normalized to protein concentration and readings from three independent experiments were pooled. *p value < 0.05, **p value < 0.01, #p value <0.001. A.U., arbitrary units.
Loss of PINK1 diminishes HIF-1α induction and activity
Increased cell death and augmented ROS production are also observed in HIF-1α-null cells under hypoxia, because cells continue to convert pyruvate into acetyl-CoA to produce ATP and oxyradical byproducts in TCA cycle (Semenza, 2010). We hypothesized that HIF-1α mediates the protective role of PINK1 from increased cell death and oxidative stress under hypoxia. To test the hypothesis that PINK1 is needed for HIF-1α induction, PINK1+/+ and PINK1−/− primary cortical neurons or MEFs were first treated with 1% O2 for up to 24 h. PINK1+/+ cells showed a significantly greater level of HIF-1α protein induction compared with PINK1−/− cells after 2, 8, and 24 h of hypoxia (Fig. 2A,B). When treated with a more severe condition of hypoxia at 0.1% O2, PINK1+/+ neurons and MEF also expressed higher HIF-1α than PINK1−/− counterparts (Fig. 2C,D). Transient PINK1 knockdown with siRNA in HEK293 cells led to a reduction in HIF-1α induction level when compared with HEK293 cells transfected with negative scrambled siRNA controls (Fig. 2E). In three distinct cell types, we demonstrated that the loss of PINK1 significantly attenuated HIF-1α induction, suggesting that cells require PINK1 for HIF-1α upregulation.
Figure 2.

Loss of PINK1 attenuates HIF-1α induction in response to hypoxic stress. A, B, (A) PINK1+/+ and PINK1−/− primary cortical cultures and (B) PINK1+/+ and PINK1−/− MEF were treated with 1% O2 for 0, 2, 8, and 24 h. Cell lysates were analyzed by Western blot for HIF-1α and β-actin and quantified using Odyssey Infrared Imaging System. A representative figure from at least three independent experiments is shown. Quantifications from at least three experiments were pooled for two-way ANOVA analysis. C–E, (C) PINK1+/+ and PINK1−/− primary cortical neuronal cultures, (D) PINK1+/+ and PINK1−/− MEFs, and (E) HEK293 cells knocked down with either negative control or PINK1 siRNA were treated with 0.1% O2 up to 8 h. Cell lysates were analyzed by Western blot and quantified for HIF-1α and β-actin. A representative figure from three independent experiments is shown. Quantifications from three experiments were pooled for two-way ANOVA analysis.*p value < 0.05, **p value < 0.01. A.U., arbitrary units.
As a transcriptional factor, HIF-1α binds to HRE in the promoter regions and upregulates downstream target genes. We hypothesized that the reduction in HIF-1α level translates into a lowered HIF-1α activity and subsequently lower target gene expression. We examined the inductions of three HRE genes—GLUT-1, BNIP3, and VEGFa. BNIP3 and VEGFa mRNA increased more dramatically in PINK1+/+ than PINK1−/− primary neurons treated with 1% O2, whereas PINK1+/+ MEFs had significantly higher levels of GLUT-1 and BNIP3 mRNA (Fig. 3A,B). Since other promoter regions and factors may have influence on the final target gene expression, we measured HIF-1α activity by luciferase reporter assay to focus solely on HRE activity. PINK1+/+ and PINK1−/− MEFs were transfected with HRE-luciferase constructs and treated with hypoxia or DFO–a commonly used chemical mimic of hypoxia (Wang and Semenza, 1993). After 18 h of treatment, PINK1+/+ MEFs generated significantly more luciferase signals than PINK1−/− MEFs in all three test conditions, with little activity in PINK1−/− MEFs (Fig. 3C). Here we demonstrated that the lack of HIF-1α protein induction in the absence of PINK1 led to the attenuation in downstream gene activation, suggesting that the loss of PINK1 can have global consequences through decreased HIF-1α activity.
Figure 3.
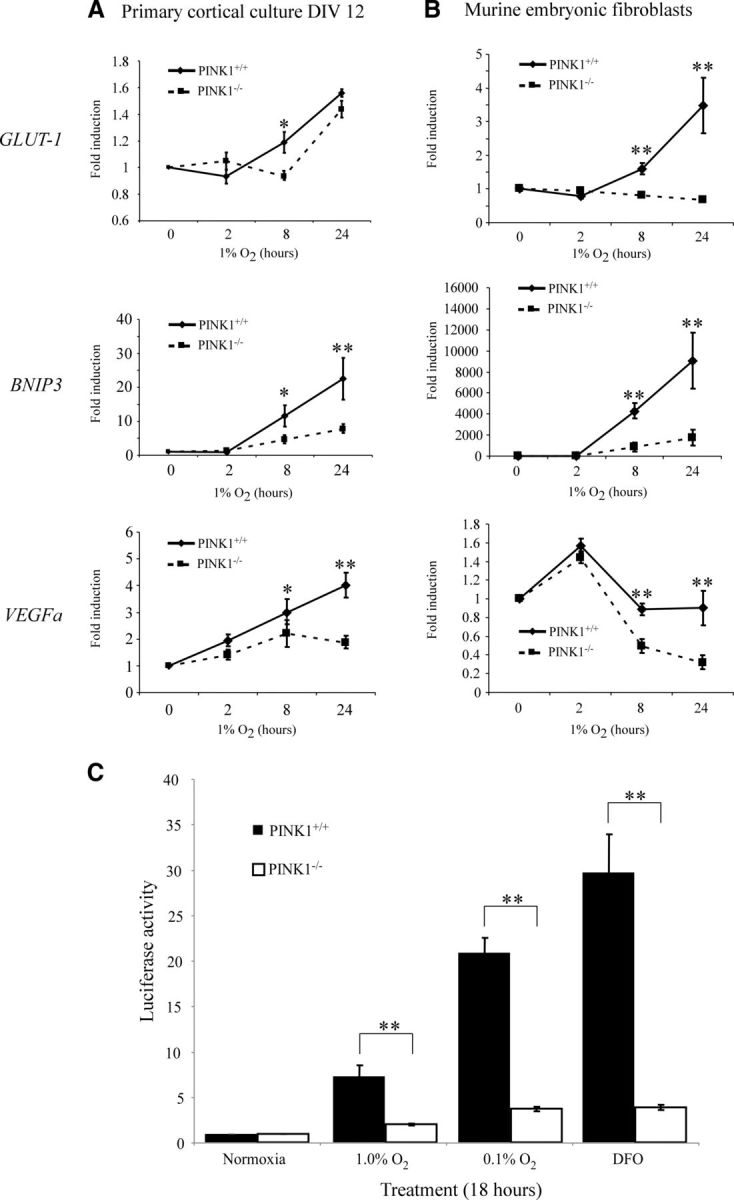
Decreased HIF-1α activity in PINK1−/− cells during hypoxia. A, B, Downstream HRE genes showed decreased induction in (A) PINK1+/+ and PINK1−/− primary cortical cultures and (B) PINK1+/+ and PINK1−/− MEFs when treated with 1% O2 for 0, 2, 8, and 24 h. Quantitative RT-PCR was performed for BNIP3, GLUT-1, and VEGFa and results were normalized to the PPIA signal. The fold induction of each gene was calculated by dividing into the respective starting mRNA quantity at time 0 of each genotype (n = 4–5). C, PINK1−/− MEFs exhibit significantly lowered HRE-promoter activity compared with PINK1+/+ MEFs. Cells were cotransfected with HRE-luciferase and SV40-Renilla constructs and treated with 1% O2 (n = 4), 0.1% O2 (n = 6), and 100 μm DFO (n = 4) for 18 h. HRE-luciferase signal was normalized to the SV40-Renilla signal. *p value < 0.05, **p value < 0.01.
Decreased HIF-1α translation and hyperphosphorylation of 4E-BP1 in PINK1−/− cells
To understand how PINK1 acts upon HIF-1α induction, we investigated known cellular mechanisms for regulating HIF-1α activity and protein level. First, we asked whether decreased HIF-1α activity is caused by the loss of nuclear HIF-1α in PINK1−/− cells, as HIF-1α translocates to the nucleus for transcriptional activity. By immunostaining, PINK1+/+ and PINK1−/− MEFs both showed detectable nuclear HIF-1α that colocalized with DAPI staining when cells were treated with 1% O2 (Fig. 4A). Although PINK1−/− MEFs had significantly less cells with nuclear HIF-1α compared with PINK1+/+ MEFs (Fig. 4B), hypoxia-induced increase in nuclear translocation was preserved. This suggests that less nuclear HIF-1α simply reflects lower levels of overall HIF-1α and the lack of PINK1 is unlikely to directly interfere with HIF-1α nuclear translocation and HRE gene activation. Second, we examined if lowered HIF-1α mRNA contributes to the reduced HIF-1α protein level. We found that PINK1−/− primary cortical neurons expressed significantly higher HIF-1α mRNA than PINK1+/+ neurons during normoxia and hypoxia, whereas both PINK1−/− and PINK1+/+ MEFs expressed similar HIF-1α mRNA levels (Fig. 4C). This ruled out the possibility that HIF-1α mRNA expression contributed to lower HIF-1α protein in PINK1−/− cells. Third, we measured HIF-1α protein degradation during hypoxia in PINK1−/− cells by performing a CHX-pulse chase experiment. After 2 h at 1% O2, CHX was added to prevent further protein synthesis and the chase was performed for up to 90 min in the presence of 1% O2. HIF-1α protein exhibited similar degradation rate in both PINK1+/+ and PINK1−/− MEFs, with a half-life of ∼15–20 min (Fig. 4D), suggesting that the HIF-1α degradation is not altered in the absence of PINK1. Fourth, we examined HIF-1α protein stability through post-translational modifications, such as (1) hydroxylation by prolyl hydroxylase, which promotes ubiquitin-mediated proteasomal degradation and (2) phosphorylation by p38 or MAPK, which leads to protein stability. Hydroxylated HIF-1α can be detected in both PINK1+/+ and PINK1−/− cells under normoxic conditions by inhibiting proteasome with epoxomicin (Fig. 4E), where the ratio of hydroxy-HIF-1α to total HIF-1α was proportionally the same in both genotypes. We used the Phos-tag gel technique to determine the phosphorylation status of HIF-1α as HIF-1α can be phosphorylated at multiple residues and the Phos-tag gel is indiscriminate of site specificity. When treated with 0.1% O2, PINK1+/+ cells displayed higher amounts of phosphorylated HIF-1α than PINK1−/− cells, most likely due to more abundant HIF-1α level (Fig. 4F). We concluded from these data that loss of PINK1 attenuated HIF-1α level without changing protein stability through degradation or post-translational modifications.
Figure 4.
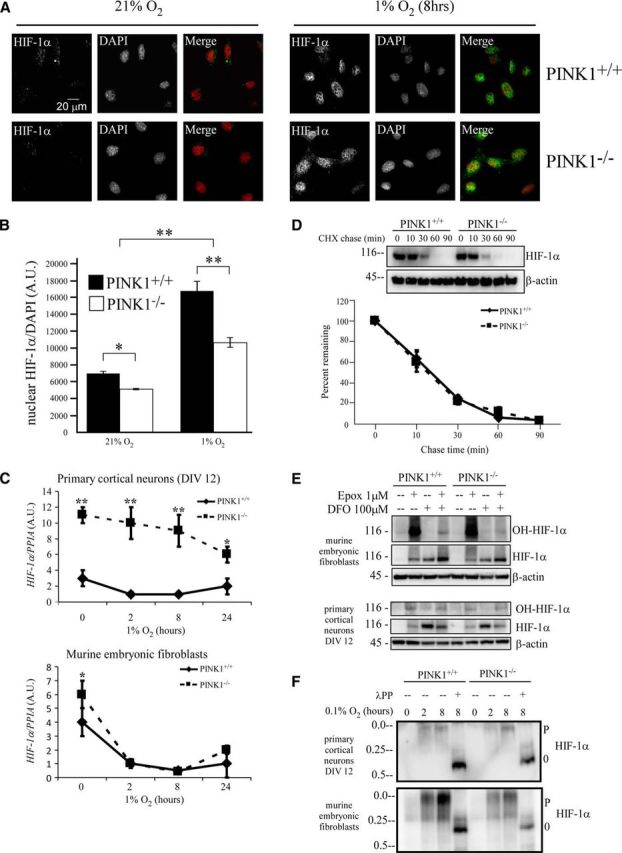
Characterizing the effects of PINK1 on HIF-1α. A, HIF-1α translocates to nucleus in PINK1+/+ and PINK1−/− MEFs during hypoxia. Cells were treated with 1% O2 for 8 h, fixed, and stained for HIF-1α (in green) and nucleus with DAPI stain (in red). B, Quantification of nuclear HIF-1α signal from A. C, PINK1−/− cells do not have lower levels of HIF-1α mRNA. RNA was collected from PINK1+/+ and PINK1−/− cells after being treated with 1% O2 for 0, 2, 8, and 24 h. HIF-1α mRNA level was quantified with RT-qPCR and normalized to PPIA mRNA from four independent experiments. *p value < 0.05, **p value < 0.01. D, HIF-1α degradation rate under hypoxia remains unchanged in the absence of PINK1. PINK1+/+ and PINK1−/− MEFs were exposed to 1% O2 for 2 h before 60 μg/ml CHX was added to inhibit de novo protein synthesis in hypoxia for up to 90 min. HIF-1α level was normalized to β-actin level and the percentage remaining was calculated by dividing each chase time point into its time 0. Data pooled from six independent experiments. E, HIF-1α hydroxylation occurs in PINK1−/− cells. PINK1+/+ and PINK1−/− MEFs and primary cortical neurons were treated with 1 μm epoxomicin (Epox) with or without 100 μm of the hypoxia mimic DFO for 8 h. Cell lysates were analyzed by Western blot for hydroxy-HIF-1α, HIF-1α, and β-actin as a protein loading control. A representative figure from two independent experiments is shown. F, Hypoxia induces HIF-1α phosphorylation in both PINK1+/+ and PINK1−/− cells. PINK1+/+ and PINK1−/− MEFs and primary cortical neurons were treated with 0.1% O2 for 0, 2, and 8 h. Cell lysates were analyzed by Phos-tag Western blot for HIF-1α phosphorylation. P denotes phospho-form; 0 denotes unphospho-form. A representative figure from two independent experiments is shown. A.U., arbitrary units.
PINK1−/− cells exhibit impairments in protein translation
We hypothesized that HIF-1α translation is impaired in PINK1−/− cells. Using metabolic radiolabeling, we observed significant differences in HIF-1α synthesis in PINK1+/+ and PINK1−/− MEFs under hypoxia, where PINK1+/+ MEFs synthesized significantly more HIF-1α than PINK1−/− MEFs (Fig. 5A). These data suggest that the loss of PINK1 decreased HIF-1α translation, thus resulting in a lower HIF-1α level. This led us to hypothesize that impaired translation exists in PINK1−/− cells. We used a dual luciferase promoter activity assay to simultaneously examine the relative activity of cap-dependent (Renilla luciferase) and IRES-dependent (POLIO IRES-firefly luciferase) translation. We discovered that the lack of PINK1 reduced both IRES-dependent and cap-dependent translational activity in PINK1−/− MEFs compared with PINK1+/+ MEFs under normoxia, but with more effect on reducing IRES translational activity, which leads to a significantly lower relative ratio of IRES/CAP activity (Fig. 5B–D). Hypoxia increased all translational activity with greater effect on IRES as reflected by a higher IRES/CAP ratio than normoxia in PINK1+/+ MEFs. PINK1−/− MEFs did not exhibit an increase in the IRES/CAP ratio with hypoxic treatment (Fig. 5D). These findings suggest that PINK1 may play a role in upregulating IRES-dependent translation relative to cap-dependent translation.
Figure 5.

PINK1 mediates protein translation. A, Loss of PINK1 leads to decreased HIF-1α translation. PINK1+/+ and PINK1−/− MEFs were starved for 30 min under either 21% or 0.1% O2 followed by a 10 min pulse with 35S-met/cys-containing media under either 21% or 0.1% O2. Radiolabeled HIF-1α was analyzed by radiography and the density of the HIF-1α was measured with Quantity One 1-D Analysis Software (Bio-Rad). A representative figure is shown from five independent runs. B–D, PINK1 increases the relative ratio of IRES-dependent to cap-dependent translation. PINK1+/+ and PINK1−/− MEFs were transfected with pcDNA3-RLUC-POLIRES-FLUC and then treated with 0.1% O2 for 24 h. Cell lysates were analyzed for (B) IRES activity by firefly luciferase, (C) cap activity by Renilla luciferase, and (D) the ratio of IRES/CAP. Samples for each assay were normalized to protein concentration and readings from three independent experiments were pooled. *p value < 0.05, **p value < 0.01, #p value <0.001.
When we examined the expression level of proteins involved in initiation of mRNA translation, PINK1+/+ and PINK1−/− MEFs showed no differences in eIF4E, eIF4G, or eukaryotic translation initiation factor 4E-BP1 (Fig. 6A). We next investigated 4E-BP1 phosphorylation given its implicated role in PD (Imai et al., 2008; Tain et al., 2009). Utilizing the Phos-tag gel technique, we looked at the phosphorylation profile of 4E-BP1 during 0.1% O2 treatment in PINK1+/+ and PINK1−/− MEFs. When comparing the two genotypes with total 4E-BP1 antibody, PINK1+/+ MEFs showed an increase in unphosphorylated 4E-BP1 α-form, whereas PINK1−/− MEFs had a higher level of hyperphosphorylated 4E-BP1 γ-form (Fig. 6B). We also examined if PINK1 acts on 4E-BP2, the predominant 4E-BP protein in brain (Bidinosti et al., 2010) in PINK1+/+ and PINK1−/− primary cortical neurons. As in MEFs, primary cortical neurons expressed similar protein levels in eIF4E, eIF4G, and 4E-BP2 (Fig. 6C). Phos-tag gel analysis showed that hypoxia treatment increased 4E-BP2 α-form more in the PINK1+/+ versus PINK1−/− neurons (Fig. 6D). The consequence of increase in 4E-BP1 α-form can be demonstrated with increased binding to the translational machineries on the 5′GTP cap of mRNA. 7-Methyl-GTP immunoprecipitation pulled down more 4E-BP1 and less eIF4G in PINK1+/+ MEFs under hypoxia than PINK1−/− MEFs (Fig. 6E), suggesting a mechanism for increased IRES translation by eIF4G shifting from CAP to IRES. The total level of eIF4E served as loading control of immunoprecipitation and showed no difference between the two genotypes. These data suggest that the loss of PINK1 impedes hypoxia-induced 4E-BP dephosphorylation and thus reduces the dissociation of eIF4G from eIF4E and less availability to activate IRES translation.
Figure 6.

Loss of PINK1 increases 4E-BP1 hyperphosphorylation. A, C, (A) PINK1−/− MEFs and (C) PINK1−/− primary cortical neurons express similar level of proteins involved in translation. PINK1+/+ and PINK1−/− cells were treated with 0.1% O2 for 0 and 2 h. Cell lysates were analyzed by Western blot for eIF4G, eIF4E, and 4E-BP1 or 4E-BP2. β-actin serves as a loading control. A representative figure is shown from two independent experiments. B, D, Less active 4E-BP1 during hypoxia in (B) PINK1−/− MEFs and (D) PINK1−/− primary cortical neurons. PINK1+/+ and PINK1−/− cells were treated with 0.1% O2 for 0 and 2 h. Cell lysates were analyzed by Phos-tag Western blot and quantified for 4E-BP1 phosphorylation for MEF or 4E-BP2 for primary cortical neurons, and β-actin as protein loading control. A representative figure from three independent experiments is shown. E, Loss of PINK1 reduces 4E-BP1 binding to 5′ cap of mRNA during hypoxia. PINK1+/+ and PINK1−/− MEFs were treated with 21% O2 or 0.1% O2 for 2 h. Proteins binding to 5′ cap were analyzed by immunoprecipitation using m7 GTP beads and Western blot was quantified for eIF4G or 4E-BP1, and eIF4E as IP loading control. A representative figure from three independent experiments is shown. *p value < 0.05, **p value < 0.01. A.U., arbitrary units.
4E-BP1 overexpression restores translation deficits in PINK1−/− cells
Active 4E-BP1 (α-form) binds to eIF4E to suppress cap-dependent translation and results in a relative protein translation switch from cap-dependent to IRES-dependent translation. We hypothesized that the lack of increase in IRES/CAP ratio in PINK1−/− MEFs, due to the increase in hyperphosphorylated 4E-BP1 γ-form (inactive 4E-BP1), can be restored with 4E-BP1 overexpression. Once again using the dual-promoter luciferase construct, we observed that 4E-BP1 overexpression in PINK1+/+ MEFs increased IRES activity, decreased CAP activity, and resulted in an overall increase in IRES/CAP ratio (Fig. 7A–C, black bars). 4E-BP1 overexpression in PINK1−/− MEFs failed to significantly increase IRES activity, although CAP activity was decreased (Fig. 7A–C, white bars). Therefore, 4E-BP1 overexpression still increased IRES/CAP ratio in PINK1−/− MEFs, not as robust as in PINK1+/+ MEFs since its effect was mainly through decreasing CAP activity. Consistent with the data that the absence of PINK1 blunts the hypoxia-induced regulation that increases the α-form of 4E-BP1 (Fig. 6B), overexpression of 4E-BP1 in the absence of PINK1 does not correct the deficiency in switching translation mechanism, potentially undermining the ability to activate adaptive responses mediated through IRES-dependent translation and to obtain sufficient functional rescue.
Figure 7.

4E-BP1 overexpression rescues translation impairments in PINK1−/− MEFs. A–C, PINK1+/+ and PINK1−/− MEFs were cotransfected with pcDNA3-RLUC-POLIRES-FLUC and vector or FLAG-4E-BP1 plasmid and then treated with 0.1% O2 for 24 h. Cell lysates were analyzed for (A) IRES activity by firefly luciferase, (B) cap activity by Renilla luciferase, and (C) the ratio of IRES/CAP. Samples for each assay were normalized to protein concentration and readings from three independent experiments were pooled. *p value < 0.05, **p value < 0.01, #p value <0.001.
Discussion
Significance of PINK1-HIF-1α pathway in PD
Multiple etiologies are thought to contribute to PD pathogenesis (Davie, 2008). Various abnormalities such as mitochondrial dysfunctions, oxidative and endoplasmic reticulum stress, inflammation, and protein processing abnormalities have been implicated in both sporadic and genetic forms of PD (Seidl and Potashkin, 2011). The PINK1-associated recessive form of PD further bolstered the causal relationship for mitochondrial dysfunctions and perturbation in bioenergetics in PD pathogenesis. The hypoxic model provides a physiological perturbation that increases ROS, alters mitochondrial homeostasis, and leads to disruption in energy metabolism (Majmundar et al., 2010). In addition, given the implication of HIF-1α in PD and other neurodegenerative conditions, we asked whether and how PINK1 plays a protective role under hypoxia as a model for these disturbances. Loss of PINK1 led to increased caspase-3 activation and enhanced intracellular ROS accumulation, consistent with the idea that PINK1 is needed for cell viability. Hypoxic treatment of PINK1−/− cells showed attenuation in HIF-1α induction and subsequently HIF-1α transcriptional activity, compared with PINK1+/+ cells. Our data support the idea that PINK1 is a positive regulator of the HIF-1α pathway.
Because HIF-1α is a major transcriptional factor that upregulates metabolic genes, decrease in HIF-1α activity can have major consequences on homeostasis and bioenergetics. HIF-1α activation allows for metabolic reprogramming, primarily by switching from the ROS-generating OXPHOS to glycolysis and by activating glucose metabolism genes. The switch to glycolysis reduces ATP production, and it also prevents additional oxidative damages (Semenza, 2007). HIF-1α also increases the HRE gene BNIP3, a gene associated with mitophagy (Wenger et al., 2005). HIF-1α-dependent BNIP3 and autophagy activation were associated with a decrease in ROS, mitochondrial mass, oxygen consumption, and ATP levels during hypoxia (Zhang et al., 2008). HIF-1α/BNIP3 may represent an alternative pathway for PINK1-dependent mitophagy.
One hypothesis for the selective neuronal vulnerability in PD suggests that substantia nigra (SN) dopaminergic neurons have greater energy dependence, as demonstrated by functional study (Kweon et al., 2004) and microarray data from rodents comparing SN and ventral tegmental area (VTA; Grimm et al., 2004; Chung et al., 2005; Greene et al., 2005). Gene profiling illustrates that SN expresses more metabolism-related genes (especially energy metabolism), more mitochondrial genes, and less growth factors. When the gene profile of SN dopaminergic neuron is compared with VTA dopaminergic neurons, SN expresses more hypoxic response genes, such as lactate dehydrogenase and enolase. Additionally, HIF-1α and its targets such as VEGF are needed to maintain dopaminergic cell integrity primarily in the substantia nigra pars compacta (SNc) (Milosevic et al., 2007). Thus it is plausible that HIF-1α plays an integral role in regulating the metabolic environment of dopaminergic neurons in the SNc, making the neurons more susceptible to attenuation in HIF-1α activity. Our finding on PINK1/HIF-1α pathway supports the notion that loss of PINK1 would increase the sensitivity of cells to metabolic stress. Future studies into the specific role of HIF-1α in dopaminergic neurons will elucidate how loss of HIF-1α can promote neurodegeneration in PD.
PINK1 mediates protein translation through 4E-BP1
When cells experience stress, particularly ones that disrupt energy metabolism, a major part of the stress response is mediated through regulation of protein translation. Under hypoxic conditions, inhibition of mRNA translation is both rapid and reversible (Lang et al., 2002; Koritzinsky et al., 2006). This allows for a shift in energy expenditure toward upregulating the factors needed to combat stress, such as chaperones, antioxidants, and transcriptional factors. A deregulation in the translation, whether through an impairment in the signaling or mutations in the translation machineries, will result in dire consequences. The connection between translation and PD is strengthened by a recent study that linked mutations in eIF4G1 with a familial case of PD (Chartier-Harlin et al., 2011) and by the findings that 4E-BP1 may be a target of LRRK2, another PD-associated protein (Tain et al., 2009). As PD is of multiple etiologies, impairment in translation offers a potential convergence of pathways.
In an effort to uncover the mechanism underlying the attenuated HIF-1α level in PINK1−/− cells, we discovered that HIF-1α translation was decreased in PINK1−/− MEFs under hypoxia. We correlate this decrease in translation to the increase in hyperphosphorylated 4E-BP1 in the PINK1−/− MEFs. The mechanism of HIF-1α translation during hypoxia may be IRES dependent (Yee Koh et al., 2008) and 4E-BP1 facilitates the switch from cap-dependent to IRES-dependent translation by associating with eIF4E to inhibit general translation (Braunstein et al., 2007). As 4E-BP1 activity can be rapidly regulated by phosphorylation, the increase in hyperphosphorylated 4E-BP1 γ-form in PINK1−/− MEFs at 2 h hypoxia suggests that there is an impairment in hypoxia-induced 4E-BP1 dephosphorylation and that these cells cannot properly regulate the translational switch as 4E-BP1 γ-form fails to associate with eIF4E (Gingras et al., 1999). In addition to examining the early changes in translation control, we demonstrated the impairment in translational switch with luciferase reporter assay at 24 h hypoxia. We found that WT 4E-BP1overexpression enhanced IRES-dependent translation and inhibited cap-dependent translation, but in the absence of PINK1, it failed to upregulate IRES-dependent translational activity significantly. This observation is consistent with an important role of PINK1 mediating dephosphorylation of 4E-BP1. In addition, while prolonged hypoxia is known to decrease global translation, our luciferase data showing an increase in cap-dependent activity during 24 h hypoxia (Fig. 5C), consistent with the literature that cell types, growth conditions, and hypoxic state, can all affect the degree and time course of inhibition on protein synthesis under hypoxia (Liu et al., 2006).
Our data provide further insights into findings in the Drosophila model of Pink1 that showed a genetic interaction between 4E-BP1 and Pink1, where overexpression of 4E-BP1 ameliorated abnormal wing posture (Liu and Lu, 2010), locomotor deficits, and muscle degeneration (Tain et al., 2009) in Pink1 mutant flies. In addition, overexpression of eIF4E exacerbated abnormal wing posture in Pink1 mutant flies, suggesting a deregulated translation in the absence of Pink1 (Liu and Lu, 2010). When Tain et al. (2009) examined 4E-BP1phosphorylation state in Pink1 mutant flies, they showed a relative decrease in phosphorylated 4E-BP1 over unphosphorylated 4E-BP1 as a result of a less active AKT/mTOR pathway. This decrease in phosphorylated 4E-BP1 appears to contradict our finding of 4E-BP1 in PINK1−/− mammalian cells; however, it can be explained by the use of phospho-specific antibodies against 4E-BP1. 4E-BP1 exists as a pool of different phosphorylated species and can be identified by using phospho-specific antibodies and IEF gels. The unphosphorylated 4E-BP1 that exclusively binds eIF4E is termed α-form. The γ-form is positive for phospho-Ser65 and contains all phosphorylated sites representing the hyperphosphorylated state. 4E-BP1 dissociation from eIF4E is generally associated with γ-form and/or phospho-Thr37/Thr46/Thr70-positive β-forms, but never with the α-form or phospho-Thr37/Thr46-positive β-forms (Gingras et al., 2001; Ayuso et al., 2010). While Tain et al. (2009) believed that PINK1 deficiency led to a decrease in hyperphosphorylated 4E-BP1, they used antibodies against phospho-Thr37/Thr46 sites. This may mask the true amount of γ-form present. Therefore, we used the Phos-tag technique to characterize the phosphorylation profile of 4E-BP1. The Phos-tag gel analysis revealed that hypoxia induced α-form while decreasing γ-form in PINK1+/+ MEFs but not PINK1−/− MEFs; thus the ratio of phospho-4E-BP1/unphospho-4E-BP1 is actually increased in PINK1−/− MEFs. The consequence of increased 4E-BP1 γ-form is confirmed by the m7 GTP immunoprecipitation, which showed less 4E-BP1 association to eIF4E at the 5′ cap of mRNA complex in PINK1−/− MEFs. By overexpressing WT 4E-BP1, we effectively increased the unphosphorylated 4E-BP1 level, which is the species needed to facilitate the translational switch. Consistent with findings in Drosophila Pink1, our experiments involving 4E-BP1 overexpression also rescued the PINK1-deficient phenotype. Future studies on the PINK1–4E-BP1 signaling pathway may elucidate our understanding of PINK1 function.
Regulation of mRNA translation by 4E-BP1 represents only one of the mechanisms for translational control during hypoxia (Wouters et al., 2005; Koritzinsky et al., 2006; Liu et al., 2006). Although our data suggest a link between PINK1 and 4E-BP1, we do not exclude the possibility that PINK1 may also be influencing other regulators of translation, such as S6K, eIF4E, eIF4G, eEF2, and eIF2α. Future experiments examining PINK1 and other mechanisms of translational control will delineate the specific role of PINK1 in mRNA translation. In conclusion, we propose a novel PINK1 mechanism where PINK1 participates in stress response by regulating an important translational switch and by activating the HIF-1α pathway. Both aspects play an important role in maintaining energy metabolism and cell survival. These findings stimulate further studies on the role of HIF-1α and protein translation in PD pathogenesis and the exact pathway in which PINK1 can mediate protein translation through 4E-BP1 regulation. These future findings may ultimately lead to better understanding of PD pathogenesis and neuroprotective strategies.
Footnotes
This study was funded by National Institutes of Health National Institute of Neurological Disorders and Stroke NS053919 and American Parkinson Disease Association Advanced Center for Research to U.J.K. We like to thank Drs. Nanduri Prabhakar and Nahum Sonenberg for plasmids, Dr. Lisa Won for animal husbandry, Drs. Wei-Jen Tang, William Green, and Sangram Sisodia for helpful discussion. We are grateful to Dr. Christine Labno for technical assistance on microscopy and ImageJ.
The authors declare no competing financial interests.
References
- Ayuso MI, Hernández-Jiménez M, Martín ME, Salinas M, Alcázar A. New hierarchical phosphorylation pathway of the translational repressor eIF4E-binding protein 1 (4E-BP1) in ischemia-reperfusion stress. J Biol Chem. 2010;285:34355–34363. doi: 10.1074/jbc.M110.135103. [DOI] [PMC free article] [PubMed] [Google Scholar]
- Beilina A, Van Der Brug M, Ahmad R, Kesavapany S, Miller DW, Petsko GA, Cookson MR. Mutations in PTEN-induced putative kinase 1 associated with recessive parkinsonism have differential effects on protein stability. Proc Natl Acad Sci U S A. 2005;102:5703–5708. doi: 10.1073/pnas.0500617102. [DOI] [PMC free article] [PubMed] [Google Scholar]
- Bidinosti M, Ran I, Sanchez-Carbente MR, Martineau Y, Gingras AC, Gkogkas C, Raught B, Bramham CR, Sossin WS, Costa-Mattioli M, DesGroseillers L, Lacaille JC, Sonenberg N. Postnatal deamidation of 4E-BP2 in brain enhances its association with raptor and alters kinetics of excitatory synaptic transmission. Mol Cell. 2010;37:797–808. doi: 10.1016/j.molcel.2010.02.022. [DOI] [PMC free article] [PubMed] [Google Scholar]
- Braunstein S, Karpisheva K, Pola C, Goldberg J, Hochman T, Yee H, Cangiarella J, Arju R, Formenti SC, Schneider RJ. A hypoxia-controlled cap-dependent to cap-independent translation switch in breast cancer. Mol Cell. 2007;28:501–512. doi: 10.1016/j.molcel.2007.10.019. [DOI] [PubMed] [Google Scholar]
- Chartier-Harlin MC, Dachsel JC, Vilariño-Güell C, Lincoln SJ, Leprêtre F, Hulihan MM, Kachergus J, Milnerwood AJ, Tapia L, Song MS, Le Rhun E, Mutez E, Larvor L, Duflot A, Vanbesien-Mailliot C, Kreisler A, Ross OA, Nishioka K, Soto-Ortolaza AI, Cobb SA, et al. Translation initiator EIF4G1 mutations in familial Parkinson disease. Am J Hum Genet. 2011;89:398–406. doi: 10.1016/j.ajhg.2011.08.009. [DOI] [PMC free article] [PubMed] [Google Scholar]
- Chung CY, Seo H, Sonntag KC, Brooks A, Lin L, Isacson O. Cell type-specific gene expression of midbrain dopaminergic neurons reveals molecules involved in their vulnerability and protection. Hum Mol Genet. 2005;14:1709–1725. doi: 10.1093/hmg/ddi178. [DOI] [PMC free article] [PubMed] [Google Scholar]
- Clark IE, Dodson MW, Jiang C, Cao JH, Huh JR, Seol JH, Yoo SJ, Hay BA, Guo M. Drosophila pink1 is required for mitochondrial function and interacts genetically with parkin. Nature. 2006;441:1162–1166. doi: 10.1038/nature04779. [DOI] [PubMed] [Google Scholar]
- Connolly EP, Thuillier V, Rouy D, Bouétard G, Schneider RJ. Inhibition of Cap-initiation complexes linked to a novel mechanism of eIF4G depletion in acute myocardial ischemia. Cell Death Differ. 2006;13:1586–1594. doi: 10.1038/sj.cdd.4401854. [DOI] [PubMed] [Google Scholar]
- Davie CA. A review of Parkinson's disease. Br Med Bull. 2008;86:109–127. doi: 10.1093/bmb/ldn013. [DOI] [PubMed] [Google Scholar]
- Gautier CA, Kitada T, Shen J. Loss of PINK1 causes mitochondrial functional defects and increased sensitivity to oxidative stress. Proc Natl Acad Sci U S A. 2008;105:11364–11369. doi: 10.1073/pnas.0802076105. [DOI] [PMC free article] [PubMed] [Google Scholar]
- Gingras AC, Raught B, Sonenberg N. eIF4 initiation factors: effectors of mRNA recruitment to ribosomes and regulators of translation. Annu Rev Biochem. 1999;68:913–963. doi: 10.1146/annurev.biochem.68.1.913. [DOI] [PubMed] [Google Scholar]
- Gingras AC, Raught B, Gygi SP, Niedzwiecka A, Miron M, Burley SK, Polakiewicz RD, Wyslouch-Cieszynska A, Aebersold R, Sonenberg N. Hierarchical phosphorylation of the translation inhibitor 4E-BP1. Genes Dev. 2001;15:2852–2864. doi: 10.1101/gad.912401. [DOI] [PMC free article] [PubMed] [Google Scholar]
- Greene JG, Dingledine R, Greenamyre JT. Gene expression profiling of rat midbrain dopamine neurons: implications for selective vulnerability in parkinsonism. Neurobiol Dis. 2005;18:19–31. doi: 10.1016/j.nbd.2004.10.003. [DOI] [PubMed] [Google Scholar]
- Grimm J, Mueller A, Hefti F, Rosenthal A. Molecular basis for catecholaminergic neuron diversity. Proc Natl Acad Sci U S A. 2004;101:13891–13896. doi: 10.1073/pnas.0405340101. [DOI] [PMC free article] [PubMed] [Google Scholar]
- Grünblatt E, Mandel S, Jacob-Hirsch J, Zeligson S, Amariglo N, Rechavi G, Li J, Ravid R, Roggendorf W, Riederer P, Youdim MB. Gene expression profiling of parkinsonian substantia nigra pars compacta; alterations in ubiquitin-proteasome, heat shock protein, iron and oxidative stress regulated proteins, cell adhesion/cellular matrix and vesicle trafficking genes. J Neural Transm. 2004;111:1543–1573. doi: 10.1007/s00702-004-0212-1. [DOI] [PubMed] [Google Scholar]
- Haque ME, Thomas KJ, D'Souza C, Callaghan S, Kitada T, Slack RS, Fraser P, Cookson MR, Tandon A, Park DS. Cytoplasmic Pink1 activity protects neurons from dopaminergic neurotoxin MPTP. Proc Natl Acad Sci U S A. 2008;105:1716–1721. doi: 10.1073/pnas.0705363105. [DOI] [PMC free article] [PubMed] [Google Scholar]
- Imai Y, Gehrke S, Wang HQ, Takahashi R, Hasegawa K, Oota E, Lu B. Phosphorylation of 4E-BP by LRRK2 affects the maintenance of dopaminergic neurons in Drosophila. EMBO J. 2008;27:2432–2443. doi: 10.1038/emboj.2008.163. [DOI] [PMC free article] [PubMed] [Google Scholar]
- Kanao T, Venderova K, Park DS, Unterman T, Lu B, Imai Y. Activation of FoxO by LRRK2 induces expression of proapoptotic proteins and alters survival of postmitotic dopaminergic neuron in Drosophila. Hum Mol Genet. 2010;19:3747–3758. doi: 10.1093/hmg/ddq289. [DOI] [PubMed] [Google Scholar]
- Ke Q, Costa M. Hypoxia-inducible factor-1 (HIF-1) Mol Pharmacol. 2006;70:1469–1480. doi: 10.1124/mol.106.027029. [DOI] [PubMed] [Google Scholar]
- Kinoshita E, Kinoshita-Kikuta E. Improved Phos-tag SDS-PAGE under neutral pH conditions for advanced protein phosphorylation profiling. Proteomics. 2011;11:319–323. doi: 10.1002/pmic.201000472. [DOI] [PubMed] [Google Scholar]
- Koritzinsky M, Magagnin MG, van den Beucken T, Seigneuric R, Savelkouls K, Dostie J, Pyronnet S, Kaufman RJ, Weppler SA, Voncken JW, Lambin P, Koumenis C, Sonenberg N, Wouters BG. Gene expression during acute and prolonged hypoxia is regulated by distinct mechanisms of translational control. EMBO J. 2006;25:1114–1125. doi: 10.1038/sj.emboj.7600998. [DOI] [PMC free article] [PubMed] [Google Scholar]
- Kweon GR, Marks JD, Krencik R, Leung EH, Schumacker PT, Hyland K, Kang UJ. Distinct mechanisms of neurodegeneration induced by chronic complex I inhibition in dopaminergic and non-dopaminergic cells. J Biol Chem. 2004;279:51783–51792. doi: 10.1074/jbc.M407336200. [DOI] [PubMed] [Google Scholar]
- Lang KJ, Kappel A, Goodall GJ. Hypoxia-inducible factor-1alpha mRNA contains an internal ribosome entry site that allows efficient translation during normoxia and hypoxia. Mol Biol Cell. 2002;13:1792–1801. doi: 10.1091/mbc.02-02-0017. [DOI] [PMC free article] [PubMed] [Google Scholar]
- Lee DW, Rajagopalan S, Siddiq A, Gwiazda R, Yang L, Beal MF, Ratan RR, Andersen JK. Inhibition of prolyl hydroxylase protects against 1-methyl-4-phenyl-1,2,3,6-tetrahydropyridine-induced neurotoxicity: model for the potential involvement of the hypoxia-inducible factor pathway in Parkinson disease. J Biol Chem. 2009;284:29065–29076. doi: 10.1074/jbc.M109.000638. [DOI] [PMC free article] [PubMed] [Google Scholar]
- Lin W, Kang UJ. Characterization of PINK1 processing, stability, and subcellular localization. J Neurochem. 2008;106:464–474. doi: 10.1111/j.1471-4159.2008.05398.x. [DOI] [PMC free article] [PubMed] [Google Scholar]
- Liu L, Cash TP, Jones RG, Keith B, Thompson CB, Simon MC. Hypoxia-induced energy stress regulates mRNA translation and cell growth. Mol Cell. 2006;21:521–531. doi: 10.1016/j.molcel.2006.01.010. [DOI] [PMC free article] [PubMed] [Google Scholar]
- Liu S, Lu B. Reduction of protein translation and activation of autophagy protect against PINK1 pathogenesis in Drosophila melanogaster. PLoS Genet. 2010;6:e1001237. doi: 10.1371/journal.pgen.1001237. [DOI] [PMC free article] [PubMed] [Google Scholar]
- Liu W, Vives-Bauza C, Acin-Peréz R, Yamamoto A, Tan Y, Li Y, Magrané J, Stavarache MA, Shaffer S, Chang S, Kaplitt MG, Huang XY, Beal MF, Manfredi G, Li C. PINK1 defect causes mitochondrial dysfunction, proteasomal deficit and alpha-synuclein aggregation in cell culture models of Parkinson's disease. PloS One. 2009;4:e4597. doi: 10.1371/journal.pone.0004597. [DOI] [PMC free article] [PubMed] [Google Scholar]
- Lum JJ, Bui T, Gruber M, Gordan JD, DeBerardinis RJ, Covello KL, Simon MC, Thompson CB. The transcription factor HIF-1alpha plays a critical role in the growth factor-dependent regulation of both aerobic and anaerobic glycolysis. Genes Dev. 2007;21:1037–1049. doi: 10.1101/gad.1529107. [DOI] [PMC free article] [PubMed] [Google Scholar]
- Majmundar AJ, Wong WJ, Simon MC. Hypoxia-inducible factors and the response to hypoxic stress. Mol Cell. 2010;40:294–309. doi: 10.1016/j.molcel.2010.09.022. [DOI] [PMC free article] [PubMed] [Google Scholar]
- Miller RM, Kiser GL, Kaysser-Kranich TM, Lockner RJ, Palaniappan C, Federoff HJ. Robust dysregulation of gene expression in substantia nigra and striatum in Parkinson's disease. Neurobiol Dis. 2006;21:305–313. doi: 10.1016/j.nbd.2005.07.010. [DOI] [PubMed] [Google Scholar]
- Milosevic J, Maisel M, Wegner F, Leuchtenberger J, Wenger RH, Gerlach M, Storch A, Schwarz J. Lack of hypoxia-inducible factor-1 alpha impairs midbrain neural precursor cells involving vascular endothelial growth factor signaling. J Neurosci. 2007;27:412–421. doi: 10.1523/JNEUROSCI.2482-06.2007. [DOI] [PMC free article] [PubMed] [Google Scholar]
- Park J, Lee SB, Lee S, Kim Y, Song S, Kim S, Bae E, Kim J, Shong M, Kim JM, Chung J. Mitochondrial dysfunction in Drosophila PINK1 mutants is complemented by parkin. Nature. 2006;441:1157–1161. doi: 10.1038/nature04788. [DOI] [PubMed] [Google Scholar]
- Poulin F, Gingras AC, Olsen H, Chevalier S, Sonenberg N. 4E-BP3, a new member of the eukaryotic initiation factor 4E-binding protein family. J Biol Chem. 1998;273:14002–14007. doi: 10.1074/jbc.273.22.14002. [DOI] [PubMed] [Google Scholar]
- Pridgeon JW, Olzmann JA, Chin LS, Li L. PINK1 protects against oxidative stress by phosphorylating mitochondrial chaperone TRAP1. PLoS Biol. 2007;5:e172. doi: 10.1371/journal.pbio.0050172. [DOI] [PMC free article] [PubMed] [Google Scholar]
- Seidl SE, Potashkin JA. The promise of neuroprotective agents in Parkinson's disease. Front Neurol. 2011;2:68. doi: 10.3389/fneur.2011.00068. [DOI] [PMC free article] [PubMed] [Google Scholar]
- Semenza GL. Oxygen-dependent regulation of mitochondrial respiration by hypoxia-inducible factor 1. Biochem J. 2007;405:1–9. doi: 10.1042/BJ20070389. [DOI] [PubMed] [Google Scholar]
- Semenza GL. HIF-1: upstream and downstream of cancer metabolism. Curr Opin Genet Dev. 2010;20:51–56. doi: 10.1016/j.gde.2009.10.009. [DOI] [PMC free article] [PubMed] [Google Scholar]
- Semenza GL, Jiang BH, Leung SW, Passantino R, Concordet JP, Maire P, Giallongo A. Hypoxia response elements in the aldolase A, enolase 1, and lactate dehydrogenase A gene promoters contain essential binding sites for hypoxia-inducible factor 1. J Biol Chem. 1996;271:32529–32537. doi: 10.1074/jbc.271.51.32529. [DOI] [PubMed] [Google Scholar]
- Sofic E, Riederer P, Heinsen H, Beckmann H, Reynolds GP, Hebenstreit G, Youdim MB. Increased iron (III) and total iron content in post mortem substantia nigra of parkinsonian brain. J Neural Transm. 1988;74:199–205. doi: 10.1007/BF01244786. [DOI] [PubMed] [Google Scholar]
- Tain LS, Mortiboys H, Tao RN, Ziviani E, Bandmann O, Whitworth AJ. Rapamycin activation of 4E-BP prevents parkinsonian dopaminergic neuron loss. Nat Neurosci. 2009;12:1129–1135. doi: 10.1038/nn.2372. [DOI] [PMC free article] [PubMed] [Google Scholar]
- Valente EM, Abou-Sleiman PM, Caputo V, Muqit MM, Harvey K, Gispert S, Ali Z, Del Turco D, Bentivoglio AR, Healy DG, Albanese A, Nussbaum R, González-Maldonado R, Deller T, Salvi S, Cortelli P, Gilks WP, Latchman DS, Harvey RJ, Dallapiccola B, et al. Hereditary early-onset Parkinson's disease caused by mutations in PINK1. Science. 2004;304:1158–1160. doi: 10.1126/science.1096284. [DOI] [PubMed] [Google Scholar]
- Wang GL, Semenza GL. Desferrioxamine induces erythropoietin gene expression and hypoxia-inducible factor 1 DNA-binding activity: implications for models of hypoxia signal transduction. Blood. 1993;82:3610–3615. [PubMed] [Google Scholar]
- Wenger RH, Stiehl DP, Camenisch G. Integration of oxygen signaling at the consensus HRE. Sci STKE. 2005;2005:re12. doi: 10.1126/stke.3062005re12. [DOI] [PubMed] [Google Scholar]
- Wouters BG, van den Beucken T, Magagnin MG, Koritzinsky M, Fels D, Koumenis C. Control of the hypoxic response through regulation of mRNA translation. Semin Cell Dev Biol. 2005;16:487–501. doi: 10.1016/j.semcdb.2005.03.009. [DOI] [PubMed] [Google Scholar]
- Xiong H, Wang D, Chen L, Choo YS, Ma H, Tang C, Xia K, Jiang W, Ronai Z, Zhuang X, Zhang Z. Parkin, PINK1, and DJ-1 form a ubiquitin E3 ligase complex promoting unfolded protein degradation. J Clin Invest. 2009;119:650–660. doi: 10.1172/JCI37617. [DOI] [PMC free article] [PubMed] [Google Scholar]
- Xu Q, Guo H, Zhang X, Tang B, Cai F, Zhou W, Song W. Hypoxia regulation of ATP13A2 (PARK9) gene transcription. J Neurochem. 2012;122:251–259. doi: 10.1111/j.1471-4159.2012.07676.x. [DOI] [PubMed] [Google Scholar]
- Yao Z, Gandhi S, Burchell VS, Plun-Favreau H, Wood NW, Abramov AY. Cell metabolism affects selective vulnerability in PINK1-associated Parkinson's disease. J Cell Sci. 2011;124:4194–4202. doi: 10.1242/jcs.088260. [DOI] [PMC free article] [PubMed] [Google Scholar]
- Yee Koh M, Spivak-Kroizman TR, Powis G. HIF-1 regulation: not so easy come, easy go. Trends Biochem Sci. 2008;33:526–534. doi: 10.1016/j.tibs.2008.08.002. [DOI] [PubMed] [Google Scholar]
- Zecca L, Stroppolo A, Gatti A, Tampellini D, Toscani M, Gallorini M, Giaveri G, Arosio P, Santambrogio P, Fariello RG, Karatekin E, Kleinman MH, Turro N, Hornykiewicz O, Zucca FA. The role of iron and copper molecules in the neuronal vulnerability of locus coeruleus and substantia nigra during aging. Proc Natl Acad Sci U S A. 2004;101:9843–9848. doi: 10.1073/pnas.0403495101. [DOI] [PMC free article] [PubMed] [Google Scholar]
- Zhang H, Bosch-Marce M, Shimoda LA, Tan YS, Baek JH, Wesley JB, Gonzalez FJ, Semenza GL. Mitochondrial autophagy is an HIF-1-dependent adaptive metabolic response to hypoxia. J Biol Chem. 2008;283:10892–10903. doi: 10.1074/jbc.M800102200. [DOI] [PMC free article] [PubMed] [Google Scholar] [Retracted]