Abstract
We describe a set of new comprehensive, high-quality, high-resolution digital images of histological sections from the brain of male zebra finches (Taeniopygia guttata), and make them publicly available through an interactive website (http://zebrafinch.brainarchitecture.org/). These images provide a basis for the production of a dimensionally accurate and detailed digital non-stereotaxic atlas. Nissl- and myelin-stained brain sections are provided in the transverse, sagittal, and horizontal planes, with the transverse plane approximating the more traditional Frankfurt Plane. In addition, a separate set of brain sections in this same plane is stained for tyrosine hydroxylase, revealing the distribution of catecholaminergic neurons (dopaminergic, noradrenergic, and adrenergic) in the songbird brain. For a subset of sagittal sections we have also prepared a corresponding set of drawings, defining and annotating various nuclei, fields, and fiber tracts that are visible under Nissl and myelin staining. This atlas of the zebra finch brain is expected to become an important tool for birdsong research and comparative studies of brain organization and evolution.
Keywords: oscine songbird, Nissl and myelin stain, website, brain drawings
Introduction
Neuroanatomical research is undergoing major changes, driven by many emerging technologies, including the availability of automated digital slide scanning microscopes (Jones et al., 2011; Rojo et al., 2006). In addition, it has only recently become feasible to digitally store and analyze the tera/petabyte scale data sets that result from serial sectioning and high-resolution imaging of complex vertebrate brains, and to make these images available to other researchers via the internet (Mikula et al., 2008; Mikula et al., 2007). In this paper we demonstrate the usefulness of these technologies by presenting the first comprehensive set of high-resolution images from Nissl- and myelin-stained sections of the zebra finch brain.
Zebra finches (Taeniopygia guttata) have proven to be the most widely used model organism for the study of the neurological and behavioral development of birdsong. A particular strength of this research area is its integrative nature, encompassing field studies and ethologically grounded behavioral biology, as well as analysis at the neurophysiological and molecular levels (Brenowitz, 2002; Zeigler and Marler, 2008). The nuclei and pathways that mediate the neural control of song learning and production have been studied intensively (Brenowitz et al., 1997; Jarvis et al., 2005). However, atlases of the zebra finch brain, which provide important anatomical references and are available for other model organisms are relatively uncommon, are limited in resolution, or are only available in printed format.
Print atlases of pigeon (Karten and Hodos, 1967), canary (Stokes et al., 1974), chick (Kuenzel, 1988; Puelles, 2007), dove (den Boer-Visser, 2004), crow (Izawa and Watanabe, 2007), quail (Bayle et al., 1974), and fulmar (Matochik et al., 1991) brains have provided important reference drawings for avian brains, but suffer from the limitations of this format, including a lack of resolution, lack of interactive capabilities, and an inability to be incorporated into modern digital data processing streams. More recently, stereotaxic atlases of the zebra finch (Nixdorf-Bergweiler and Bischof, 2007), Japanese jungle crow (http://carls.keio.ac.jp/bird_brain/brain/html_brain/Crow_brain_image_album.html), budgerigar (http://www.bsos.umd.edu/psyc/Brauthlab/atlas.htm), pigeon (http://www.avianbrain.org/nomen/Pigeon_Atlas.html), and chicken (http://www.avianbrain.org/nomen/Chicken_Atlas.html) have become available online, but like the print atlases, consist primarily of reference drawings prepared in the transverse and/or sagittal planes based on histological analysis. A 3D digital atlas of the adult male zebra finch brain has also been developed using high-field (7 Tesla) magnetic resonance imaging (MRI), with resolution of 80 x 160 x 160 μm, and with 13 major structures manually labeled (Boumans et al., 2008; Poirier et al., 2008). Finally, a gene expression atlas of the zebra finch brain (ZEBrA; http://www.zebrafinchatlas.org) has recently become public, providing a complementary resource for investigating the genetic organization of the brain of this and other songbird species. Several websites, including http://www.avianbrain.org, ZEBrA, and Songbird Science (http://songbirdscience.com) provide links to available online atlases, as well as guidelines for using the revised avian brain nomenclature (Reiner et al., 2004).
While available paper, online, and MRI-based atlases provide valuable 2D- and 3D-images, these images generally lack the cellular resolution of histological atlases, which remain the standard for guiding experimental investigations. The cytoarchitectural high-resolution photographs presented here provide the basis for a dimensionally accurate digital atlas that can greatly facilitate identification of electrode placement for electrophysiology, targeting of injections in connectional studies, and analysis of cytoarchitecture. This initial dataset is not presented in stereotaxic coordinate space; rather, it is intended to complement the stereotaxic atlases of Nixdorf-Bergweiler and Bischof (2007) and Akutagawa and Konishi (unpublished) by providing detailed high-resolution photomicrographs, which can be viewed interactively over the web.
Computer-based image processing techniques opened the possibility of the construction of digital brain atlases (Roland and Zilles, 1994; Swanson, 1993; Swanson, 2001). Significant progress has been made in brain atlases based on histological analysis for the rat and mouse (MacKenzie-Graham et al., 2004; Toga et al., 1995), with particularly significant advances in web access and navigability having been made for the Allen Brain Atlas of gene expression in the mouse brain (Lein et al., 2007; Ng et al., 2009). A digital brain atlas offers important advantages over a traditional paper-based one, including:
It can be viewed at multiple resolutions. At low magnification, it provides an overview of brain sections and anatomical regions, while at higher magnification it shows exquisite details of the cytoarchitectural structure (the images presented here have a resolution of 0.5 micrometers per pixel, allowing resolution of single cells in most brain areas).
It allows 2D serial images to be rendered as a 3D representation of the anatomy. In particular, it allows digital “re-slicing” of the brain. Since brains are seldom sliced in the same plane as atlases in real experiments, re-slicing allows the creation of a useful atlas for any plane of section, which would otherwise have been unavailable in the paper-based version.
It can facilitate target localization (e.g. gene expression, electrode placement, anatomical tracer dyes, etc.) through interactive tools that operate on the digital atlas images.
It can be made available on the Internet, providing easy and rapid access that is not platform specific.
The dataset presented here constitutes the basis for building a digital atlas of adult zebra finch brain. A subset of these images, including Nissl- and myelin-stained brain sections in the transverse, sagittal, and horizontal planes has been available for several years at http://www.zebrafinch.org/atlas. However, the complete dataset, which includes 8 Nissl-and 3 Myelin-stained image series, and several additional series stained for tyrosine hydroxylase and choline acetyltransferase is presented at http://zebrafinch.brainarchitecture.org/.
Materials and Methods
Twenty adult male zebra finches were used to create the initial atlas images. Birds weighed between 11g and 15g, with brain weights ranging from 0.39g to 0.50g. Animals were anesthetized with a 50:50 Ketamine-Xylazine mixture and perfused with 4% Paraformaldehyde. The brains were removed and stored in the fixative for 1 to 4 days, transferred to 0.1 M Phosphate Buffered Saline (PBS; pH 7.2), and were later switched to 30% sucrose to provide cryoprotection of the tissue during the subsequent sectioning on a freezing microtome.
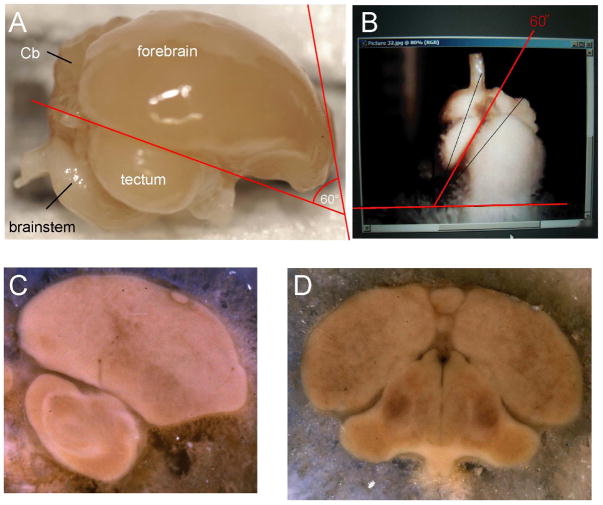
Several brains were used to create image series in each of three orientations. The sagittal plane was defined as usual. Sectioning along the transverse and horizontal planes, however, is dependent upon the choice of an arbitrary axis. Due to the small size of zebra finch brains, the selection of a suitable plane and the development of a reliable and reproducible means of holding the head for sectioning have been technically challenging. Previous efforts to produce an atlas of the zebra finch brain appear to have been based upon the adoption of a simple axis with a plane based upon ear bars as the zero point of rotation, and a mouth bar at the same horizontal axis as the ear bars. This may have the relative advantage of ease of replication, and fairly free access to visual space around the animal. However, this resulted in sections through the thalamus and brainstem that were tilted in a manner that made them nearly unusable for data analysis and correlation with any of the more widely accepted planes of section of other avian/reptilian and mammalian brains. For example, the Nixdorf-Bergweiler and Bischof atlas (2007) presents “transverse” sections displaying the habenula and pons on a single transverse plane. We have developed a method for reproducibly sectioning brains transversely in approximation of the “Frankfurt” plane (also called the auriculo-orbital plane of humans; established at the World Congress on Anthropology in Frankfurt, Germany in 1884). An idealized transverse (“coronal”) section orthogonal to the Frankfurt Plane that has been widely used in experimental animals results in a section at the level of the rostral mesencephalon showing the posterior commissure and the exit of the axons of the oculomotor nerve in a single plane. In this procedure, the brain is oriented according to a few anatomical features on the lateral surface that are easily identifiable (Figure 1A). One important feature is the fissure where the tectum adjoins the forebrain. We mount the brain on the microtome such that the fissure is at 60° with respect to the horizontal plane of the microtome, as indicated by the red lines in Figures 1A and 1B. Although the fissure is not exactly a straight line, cutting the brain horizontally relative to the microtome platform when mounted this way leads, on average, to sections parallel to the Frankfurt plane along the longitudinal axis of the brain. Henceforth the Frankfurt plane will also be referred to as the transverse plane. “Sagittal” plane consists of sections parallel to the midline, along a lateral to medial axis. “Horizontal” plane corresponds to a plane of section from the top to the bottom of the brain, orthogonal to the “Idealized” Frankfurt Plane.
Figure 1. Preparation of brain sections.
(A) A zebra finch brain after perfusion and extraction from skull. When the fissure is aligned along the 60° red line, cutting the brain horizontally gives rise to the transverse or Frankfurt plane. (B) The brain is oriented according to the fissure between the tectum and forebrain. (C) Digital photograph of a frozen block face during sectioning in the sagittal plane. (D) The block face of a frozen brain sectioned in the transverse plane. Both images (C) and (D) are digitally enhanced to exhibit coarse-scale structures and provide references suitable for 3D serial reconstruction. For anatomical abbreviations, see list.
For each of these three atlas orientations, brains were cut with a section thickness of 30 micrometers. Prior to cutting each section, the tissue block face was photographed using a digital camera (Nikon D300 18–135mm DX Zoom-NIKKOR lens, Nikon Corporation) mounted above the microtome (Figure 1C and D; images enhanced to reveal coarse-scale anatomical structures.). These serial images of the frozen brain blocks provide a dimensionally accurate set of co-registered images, constituting a true reference that will be valuable for three-dimensional reconstructions from images of the histological brain sections (e.g. Toga and Banerjee, 1993).
Serial sections were collected and mounted on glass slides in two series. In one set of experiments, alternating sections were stained for either Nissl substance (using cresyl violet) or for myelin (using Gallyas silver). In another set, antibodies were applied against tyrosine hydroxylase (TH) (Millipore Corp.; LNC1; #MAB318) at a dilution of 1:200, with Giemsa counter staining. This monoclonal antibody was generated in mice and raised against purified tyrosine hydroxylase derived from a rat PC12 pheochromocytoma cell line. Although the epitope recognized by the antibody has not been fully characterized according to the manufacturer, western blots using chymotrypsin digested LNC1 protein suggest it is located in a N-terminal region that contains a highly conserved TH regulatory domain. This antibody recognizes a protein of approximately 59–61 kDa by Western blot and does not cross-react with the following: dopamine-beta-hydroxylase, phenylalanine hydroxylase, tryptophan hydroxylase, dihydropteridine reductase, sepiapterin reductase, or phenylethanolamine-N-methyl transferase. The resulting pattern in zebra finch is essentially the same as previously described in this species with a different anti-TH antibody (Bottjer, 1993). Finally, the complete series of the stained tissue were imaged in bright field using a digital slide scanning microscope (Aperio Scanscope XT, Aperio Technologies, Inc., Vista, CA) at a resolution of 0.5 μm / pixel (Figures 2 and 3). The resulting RGB images were typically about 15 Gigabytes per slide before compression. The slide images were then converted and stored as TIFF files with a JPEG compression scheme.
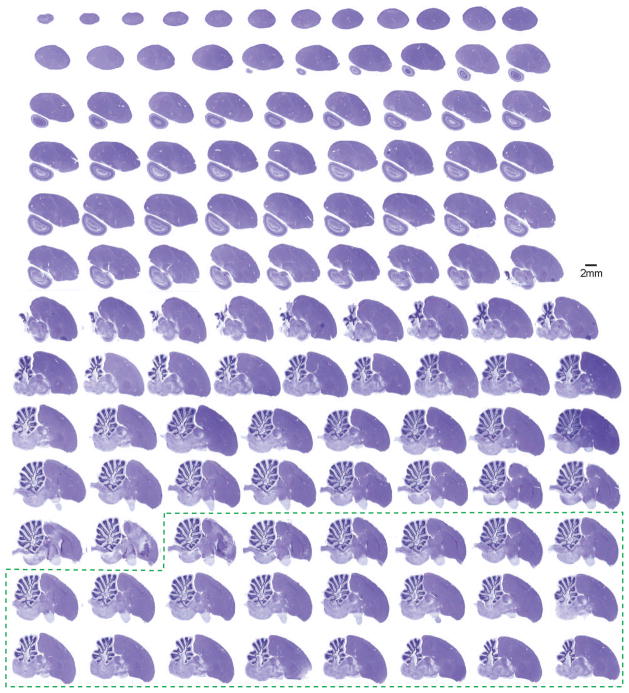
Figure 2. A collection of Nissl-stained zebra finch brain sections presented in the sagittal plane.
The brain was cut into 30 μm thick sections. Alternating sections were stained with either Nissl (Cresyl violet) or myelin (Gallyas silver) stains, respectively, mounted on glass slides, and imaged with an Aperio Scanscope XT. Each 8-bit color image is digitized at high-resolution (0.5 μm/pixel). The entire collection consists of 14 slides of Nissl-stained sections derived from one hemisphere (8–12 sections/slide). Additional sections from the opposite hemisphere are also included with this series (dotted green box), since it is difficult to precisely identify the midline during the course of tissue preparation. Sections from lateral to medial are displayed from left to right, and top to bottom. This series reveals the cytoarchitectonic structure of the zebra finch brain, and complements the myelin-stained sections presented in Figure 3.
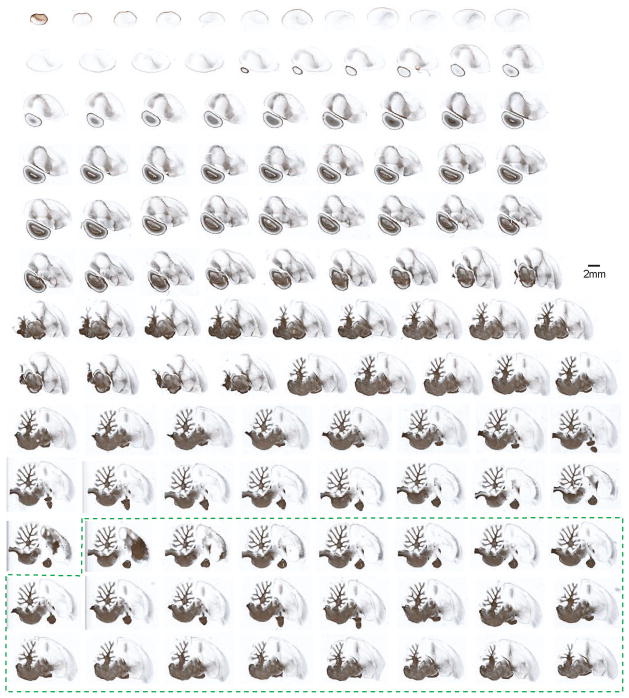
Figure 3. A collection of myelin-stained zebra finch brain sections presented in the sagittal plane.
Sections were obtained from the same brain (in alternating series) as those presented in Figure 2, and are imaged and arranged in an identical fashion. Corresponding myelin and Nissl sections are adjacent to each other and 30 μm apart. This series demonstrates the myeloarchitectonic structure of the songbird brain, and complements the Nissl-stained sections presented in Figure 2. The dotted green box indicates additional sections from the opposite hemisphere.
The full slide images typically contained 6 to 12 individual serial sections. Each section was extracted and stored as a single file. Individual sections were further partitioned into image pyramids to capture image information at multiple locations and levels of resolution, and stored as series of JPEG files. These images form the input to an interactive web site available at http://zebrafinch.brainarchitecture.org/ where users can browse the zebra finch brain sections at multiple resolutions within their browser. When the images are delivered over the internet, they are stitched together by the web client using an open source image JPEG2000 image server, djatoka, which seamlessly coordinates zoom and pan functionalities.
To generate brain drawings representative of the three sectioning planes, selected digital images were opened in Adobe Illustrator and lines corresponding to section contours and the boundaries of internal structures were drawn using a tablet (Wacom 21ux). For each drawing, adjacent sections stained for Nissl or myelin were aligned to each other so that both could contribute to structure identification, and the drawings and label placement were done using layers. The identification and labeling of structures was largely based on previous avian brain atlases (den Boer-Visser, 2004; Karten and Hodos, 1967; Kuenzel, 1988; Nixdorf-Bergweiler and Bischof, 2007; Puelles, 2007; Stokes et al., 1974), and used the revised avian brain nomenclature guidelines (Reiner et al., 2004).
Results
Figures 2 and 3 illustrate the collected sets of slide images comprising the entire series of Nissl and myelin stained sagittal sections in one hemisphere, respectively. Additional sections from the opposite hemisphere are also included with each series (indicated by dotted green box in Figures 2 and 3), since it is difficult to precisely identify the midline during the course of tissue preparation. In addition, a small angular deviation across the midline often occurs in practice, and it is therefore useful to routinely show images on both sides of the midline. Each data set consists of 14 slides with sequential brain sections placed in vertical columns on each slide. Section numbering for the lateral-most slide is indicated in Figure 2. The Nissl and myelin stains complement each other in an important way, since Nissl stain labels the cell bodies only, while myelin stain reveals the larger myelinated axons that mediate connections between nuclei and cell groups.
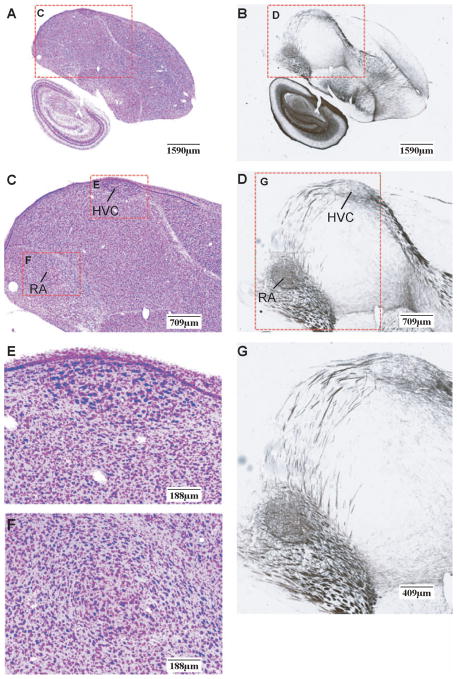
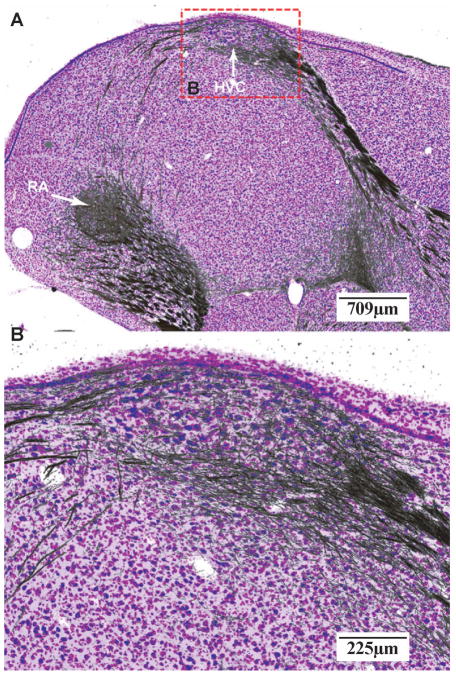
A pair of adjacent Nissl and myelin sections is further displayed in Figure 4 at a similar magnification. The top row (Fig. 4A and 4B) shows adjacent Nissl and myelin sections with mutually aligned region-of-interest (ROI) boxes. The enclosed regions are shown at higher magnification in Figure 4C and 4D. At this brain level, HVC (meant as a proper name; see (Reiner et al., 2004) and the Robust nucleus of the Arcopallium (RA), which comprise the vocal motor pathway of the oscine song system, can be readily identified in Nissl based on cytoarchitecture. Clear evidence for a dense axonal projection from HVC to RA is visible in the corresponding myelin section (Fig. 4D). Magnified views of HVC and RA (Fig. 4E and 4F) reveal the architectonic structures of these nuclei, including the relative size, shape, and orientation of individual cell bodies, and overall staining patterns of cell groups. In Figure 4G a higher magnification image of the ROI in Figure 4D is shown highlighting the fasciculation of axon bundles in the projection from HVC to RA. Since the adjacent Nissl and myelin sections are 30 μm apart, the axon fibers in the latter provide approximate locations of those lying within the Nissl-stained section. Therefore, they can be computationally superimposed and rendered in pseudocolor (Figure 5) to reveal the cytoarchitecture and mesoscopic scale projection pattern between cell groups simultaneously. The Nissl- and myelin-stained sections together afford a more complete description of neuroanatomical structures.
Figure 4. Multi-resolution views of adjacent Nissl- and myelin-stained sections.
(A and B) Low magnification images of adjacent brain sections stained for Nissl (A) and myelin (B). Sections depicted at a level that includes song nuclei HVC and RA. Regions of interest (ROI) presented at higher magnification in panels C and D are indicated by the red dotted squares. (C and D) High power shots of the ROIs defined in A and B. (E and F) High power shot of HVC (E) and RA (F) from panel C illustrating the fine cytoarchitectonic features of the posterior vocal control nuclei of the song system. (G) High power shot (from panel D) depicting the fine myeloarchitectonic features of the axonal projection from HVC to RA. Scale bars are shown at the lower right corner of each image. For anatomical abbreviations, see list.
Figure 5. Superimposition and registration of adjacent Nissl and myelin images.
Images from Figure 4 panels C and D are superimposed to illustrate the complex cyto-and myelo-architecture of song nuclei HVC and RA. The Nissl stain is displayed as the blue/purple component in the image, with the Myelin stain in black. Information from the each of the two staining methods complements each other to provide a more complete description of the anatomical structure and connectivity. For anatomical abbreviations, see list.
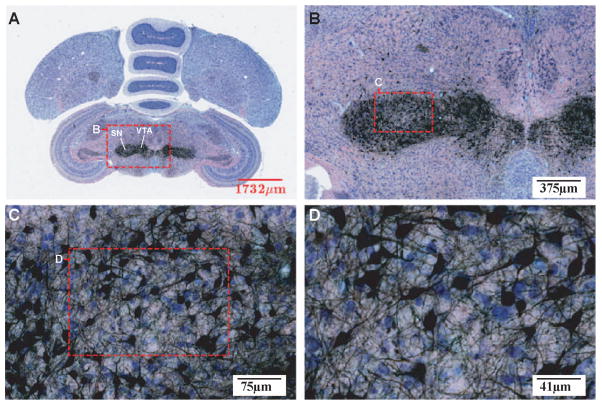
Using the method described in Figure 1 we have been able to section the brain reproducibly in the transverse (Frankfurt) plane. The staining pattern of antibodies against Tyrosine Hydroxylase (TH) in this plane is shown in Figure 6 at increasingly higher levels of magnification. TH is a rate-limiting enzyme in the catecholamine synthesis pathway and is therefore used as an indicator for catecholaminergic (dopaminergic, noradrenergic, and adrenergic) neurons. Both the nerve fibers and soma of these cell groups are labeled. The unlabeled cells are counter-stained with Giemsa to provide anatomical context. The presence of the same neurochemical marker in a group of co-localized neurons may suggest functional or anatomical organizations that are not necessarily apparent from cyto- or myeloarchitectonic patterns.
Figure 6. A Tyrosine Hydroxylase (TH) stained section in the transverse plane at progressively higher magnification levels.
Antibodies were applied against TH, which is a limiting enzyme in the catecholamine synthesis pathway, and sections were counter-stained with Giemsa. Neurons synthesizing catecholamines were consequently labeled in black, while others were stained in blue due to Giemsa staining. The ROI (red box) of each image is magnified in the next panel. The immunohistochemical technique complements the Nissl and myelin staining by probing additional organizational characteristics (e.g. common neurotransmitters) of groups of neurons. For abbreviations, see list.
Nissl- and myelin-stained section series were also produced in the horizontal plane. Images of histological sections in all three planes can be accessed through our interactive website at http://zebrafinch.brainarchitecture.org/. The images can be viewed at 8 different magnification levels. At the highest level, neuron cell bodies and axon fibers (or fiber bundles) can readily be examined in Nissl and myelin sections respectively.
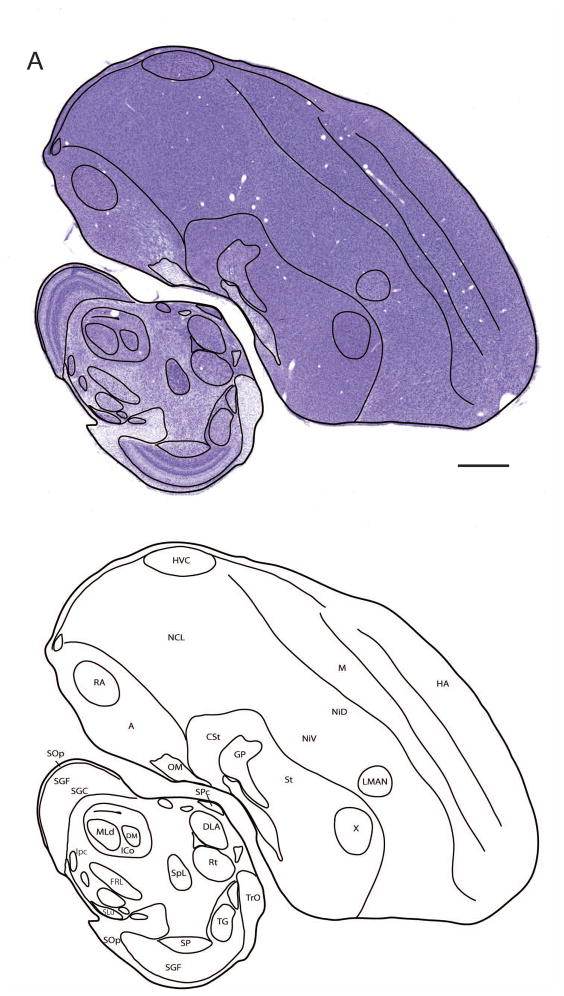
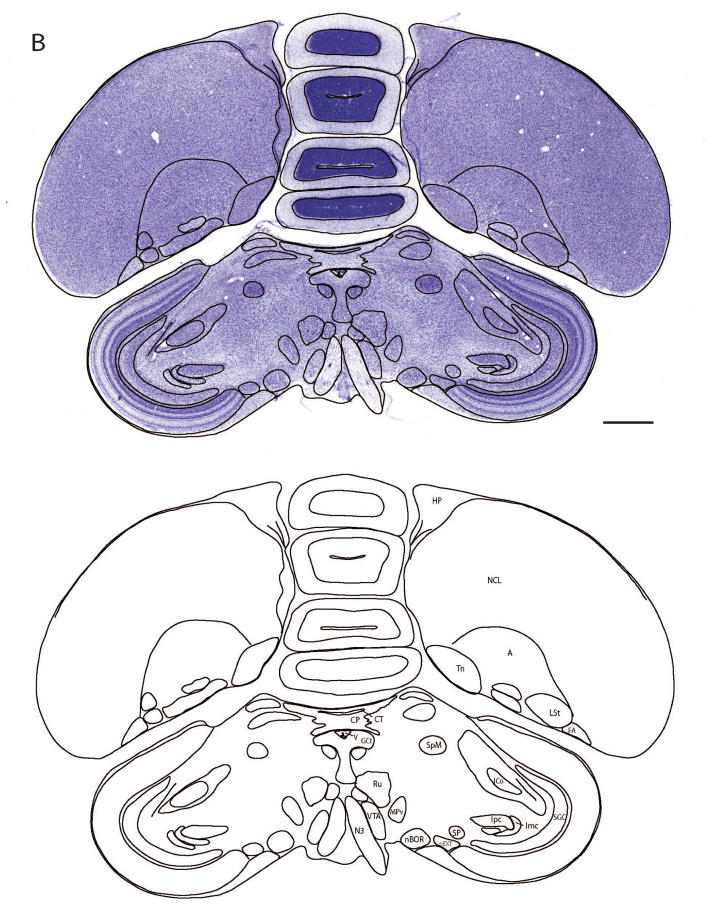
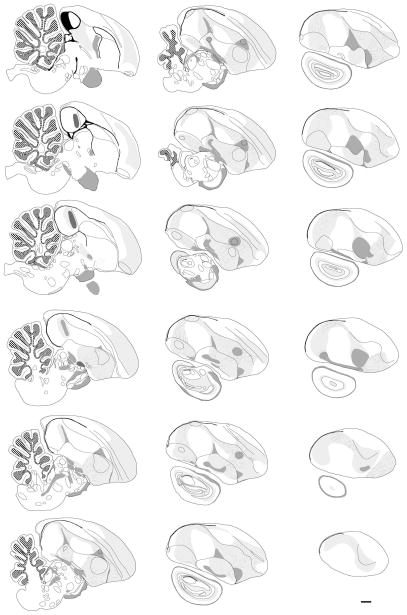
Drawings of selected sections illustrating the parcellation and annotation of different brain structures and nuclei as seen under Nissl staining are presented in Figures 7A and B for the sagittal and transverse series, respectively. These drawings illustrate the brain structures, boundaries, and cell groups (indicated by dark lines) that can be readily identified based on cytoarchitectonics features. Subsequent alignment and superposition of adjacent Nissl and myelin stained sections allows for a detailed mapping of both cyto-and myeloarchitectonic features in the same drawings. Using this approach, we have generated and annotated a set of 18 drawings in the sagittal plane that cover most of the major medio-lateral structures in the songbird brain (Fig. 8). Structures that are discernible in Nissl (i.e. contours, laminae, nuclei) are indicated by solid lines. Those visible in myelin staining (i.e. white matter, fasciculated fibers, commissures) are indicated by light and dark shading. The complete labeling convention is described in the Figure 8 legend. This first set represents the minimal resolution to begin to construct a set of sequential contours of sections and internal structures for the purpose of generating a 3D wireframe model of the zebra finch brain. We are currently in the process of completing this procedure for all three planes of sectioning, with the goal of creating a fully rendered 3D model that will allow for digital “re-slicing”, and custom atlas production.
Figure 7. Drawing and annotation of representative Nissl-stained sections in sagittal and transverse planes.
(A and B) Overlays of line drawings superimposed over Nissl-stained images of a zebra finch brain sections taken from the sagittal (A) and transverse or “Frankfurt” planes of section (B). Image in A is a sagittal section ~2.2 mm from the midline that includes HVC and RA. The line drawings are presented without the Nissl-stained images in the panels immediately beneath panels A and B. Only brain structures and cell groups that can be defined by cytoarchitectonic features in Nissl are drawn to illustrate how the brain sections can be parcellated. Structures defined by myeloarchitectonic features (e.g. fiber fields, commissures) are not shown. A subset of identified anatomical structures are indicated on the figure; for abbreviations, see list. Scale bar = 1 mm.
Figure 8. Series of 18 line drawings in the sagittal plane that cover most of the major medial and lateral structures in the zebra finch brain.
Solid lines indicate major contours, brain nuclei, and laminae that can be defined by cytoarchitectonic features in Nissl. Structures and fields shaded in light grey represent white matter fiber fields that are only visible in the myelin-stained material. The orientation and position of fasciculated fiber bundles within these fields are indicated by the thin lines. Structures and fields shaded in dark grey represent commissures and/or thick fiber tracks that are oriented perpendicular to the plane of section. The granule cell layer of the cerebellum is indicated by hatching pattern on a white background; the ventricle is represented as a filled (black) structure. Scale bar = 1 mm.
Discussion
In this paper we have presented a modern high-resolution digital atlas that provides unprecedented access to the cytoarchitectonic, myeloarchitectonic, and immunohistochemical organization of the zebra finch brain. Although the results presented here are still preliminary with regards to generating 3D models, the high-quality of the images demonstrates the feasibility and benefits of the encompassing study. Extending this study to include molecular anatomy (Lein et al., 2007), connectional studies (Bohland et al., 2009) and phenotyping studies of genetic mutants will likely provide an invaluable tool for data assessment.
While variation in sectioning angles inevitably exists due to natural variation in brain sizes across zebra finch cohorts, it is important to minimize it. We chose the standardized “Frankfurt” plane as the transverse plane to complement the sagittal and horizontal planes. Located at the junction of the mesencephalon and forebrain, the Frankfurt plane cuts through the posterior commissure dorsally, and exits through the oculomotor nerve (nIII). Overall, this nominally results in a series of “transverse” sections perpendicular to the average longitudinal axis of the mesencephalon, isthmus, and rhombencephalon. Notably, our chosen plane of sectioning, the Frankfurt Plane (FP) differs from the transverse planes presented in the canary and previous zebra finch brain atlases (Nixdorf-Bergweiler and Bischof, 2007; Stokes et al., 1974). The canary atlas, in particular, was constructed using a Beak Horizontal Plane (BHP) head-holder. The BHP takes advantage of the convenience of head restraint, while emphasizing the organization of the telencephalon, for which there is no nominal transverse plane, and song system. While the BHP is a reasonable choice, in our experience the organization of the thalamus and brainstem are very difficult to interpret under this plane. In contrast, the FP provides a reasonable transverse plane cutting through the thalamus and hypothalamus, as well as the brainstem. Moreover, the FP is readily comparable to similar orientations commonly used in brain studies of other vertebrates, including mouse, pigeon, and chick. In the interest of the basic neurobiology of zebra finch, and research that encompasses all levels of the brain, from telencephalon to spinal cord, we believe that the use of an anatomically defined plane, such as the Frankfurt Plane, greatly facilitates the translation of neuroanatomical findings from birds to mammals. Hence, it is preferable to the stereotaxic plane adopted in the Nixdorf-Bergweiler and Bischof (2007), and Stokes et al. (1974) atlases for comparative anatomical and cytoarchitectural purposes.
Constructing a three dimensional digital atlas is the next step towards fulfilling the digital potential of this histological dataset. The series of frozen block face images (examples shown in Figure 1C and D) can facilitate the 3D volume reconstruction from histological section series by providing a reference for inter-section alignment, as well as templates for correcting distortions and damages incurred during cutting and transferring processes. The high-resolution (0.5 μm/pixel) images of Nissl-stained sections form the basis for anatomical region parcellation, while the myelin-stained sections and immunohistochemical studies provide complementary information about potential interactions between brain structures. We acknowledge that our attempts to provide annotations for every cell group and fiber pathway are at best incomplete. We determined that it was preferable to only provide names for those structures that have been experimentally verified. We hope that as advances are made in our understanding of avian neuroanatomy, this atlas will serve as a starting template for fully annotating the zebra finch brain.
The availability of dimensionally accurate and detailed atlases and photographs of the brains of male and female animals, as well as of brains during development, can play an important role in research focused on songbirds and other model systems. For example, high-resolution histological datasets can be independently evaluated in light of new anatomical, physiological, and molecular studies. It is possible to provide and distribute a standardized set of data showing the normal pattern of distribution of, for example, retinal or cochlear projections, or immunohistochemical distributions of defined compounds of wide interest, such as catecholamines and other transmitter-related substances, neuropeptides, trophic factors, and so on. As one example, the Zebra finch Brain Expression Atlas (or ZEBrA: http://www.zebrafinchatlas.org) utilizes a standard set of sagittal brain drawings prepared from this histological atlas (see Figure 8). Together, these drawing provide the context for appreciating relationships between nuclei, their connectivity, and the genes they express. The digital atlas with its accompanying histological dataset will permit investigators to independently evaluate the outcome of experimental manipulations that may alter the levels of expression of such important biological substances by comparing their results with their normal patterns of distribution.
The selected drawings presented in this report illustrate the processes of parcellation and annotation of different brain structures and nuclei that have started to be applied to individual histological sections. Once these steps are completed for the entire series, in all 3 planes of section, the annotated drawings will represent an invaluable reference framework for constructing a 3D model of the zebra finch brain. Such a step will make it possible for future songbird researchers to rapidly and easily identify electrode placements, map injections in connectional studies, and even generate custom atlases for any plane of section, further enhancing anatomical, molecular and physiological brain studies in zebra finches.
Furthermore, the atlas can also be expected to advance our understanding of the songbird brain from a comparative and evolutionary perspective (Farries, 2004; Jarvis et al., 2005), by comparison with other existing and upcoming image data sets using similar technologies in different species. Such comparative studies will assist in the incorporation of scientific insights obtained from songbirds into our knowledge of brain functions in general.
Future Directions
A dimensionally accurate digital atlas will furnish a platform for integrating experimental datasets acquired through various techniques. Cytoarchitectural datasets constitute the anatomical context, to which myeloarchitectural and other histochemical data can be registered to provide further insights into the organization and structures of brains. Annotations can be added as well. In the future, such an integrative framework may serve a “Geographical Information System” (GIS) of the songbird brain. Emerging information about brain connectivity and organization (Bohland et al., 2009), gene and protein expression (Li et al., 2007; Pinaud et al., 2008; Replogle et al., 2008; Wada et al., 2006), and the influence of genomic features (Warren et al., 2010), define a rich landscape that shapes the organization and activity of the brain. In the coming years it will be imperative that we begin to build new resources that allow us visualize, question, analyze, interpret, and understand how these data contribute to complex brain architecture. An interactive digital atlas provides the framework for building such a system.
Acknowledgments
This work is supported by the NIH (NS50436). PPM is also supported by the W. M. Keck Foundation and Crick-Clay Professorship. CVM is supported for this work by the NIH/NIGMS (R24 GM092842).
We are grateful to James Prechtl for his expert technical assistance in preparing the zebra finch brains in transverse plane.
Footnotes
Conflict of Interest
The authors declare no conflict of interest.
Role of Authors
All authors take responsibility for the integrity of the data and the accuracy of any analysis. Study concept and design: HJK, ABP, PPM. Histology and Image Acquisition: ABP. Preparation of drawings based on the histological atlas: PVL, DDT, CVM. Preparation of atlas website: PPM, HW. Analysis and interpretation of data: HJK, HW, CVM. Drafting of the manuscript: HJK, PPM, PVL, CVM. Study supervision: HJK, PPM, CVM.
Literature Cited
- Bayle JD, Ramade F, Oliver J. Stereotaxic topography of the brain of the quail (Coturnix coturnix japonica) Journal de physiologie. 1974;68(2):219–241. [PubMed] [Google Scholar]
- Bohland JW, Wu C, Barbas H, Bokil H, Bota M, Breiter HC, Cline HT, Doyle JC, Freed PJ, Greenspan RJ, Haber SN, Hawrylycz M, Herrera DG, Hilgetag CC, Huang ZJ, Jones A, Jones EG, Karten HJ, Kleinfeld D, Kotter R, Lester HA, Lin JM, Mensh BD, Mikula S, Panksepp J, Price JL, Safdieh J, Saper CB, Schiff ND, Schmahmann JD, Stillman BW, Svoboda K, Swanson LW, Toga AW, Van Essen DC, Watson JD, Mitra PP. A proposal for a coordinated effort for the determination of brainwide neuroanatomical connectivity in model organisms at a mesoscopic scale. PLoS computational biology. 2009;5(3):e1000334. doi: 10.1371/journal.pcbi.1000334. [DOI] [PMC free article] [PubMed] [Google Scholar]
- Bottjer SW. The distribution of tyrosine hydroxylase immunoreactivity in the brains of male and female zebra finches. Journal of Neurobiology. 1993;24(1):51–69. doi: 10.1002/neu.480240105. [DOI] [PubMed] [Google Scholar]
- Boumans T, Gobes SM, Poirier C, Theunissen FE, Vandersmissen L, Pintjens W, Verhoye M, Bolhuis JJ, Van der Linden A. Functional MRI of auditory responses in the zebra finch forebrain reveals a hierarchical organisation based on signal strength but not selectivity. PLoS One. 2008;3(9):e3184. doi: 10.1371/journal.pone.0003184. [DOI] [PMC free article] [PubMed] [Google Scholar]
- Brenowitz EA. Birdsong: integrating physics, physiology, and behavior. J Comp Physiol A Neuroethol Sens Neural Behav Physiol. 2002;188(11–12):827–828. doi: 10.1007/s00359-002-0348-0. [DOI] [PubMed] [Google Scholar]
- Brenowitz EA, Margoliash D, Nordeen KW. An introduction to birdsong and the avian song system. Journal of Neurobiology. 1997;33(5):495–500. [PubMed] [Google Scholar]
- den Boer-Visser AM, Brittijn ML, Dubbeldam JL, editors. A stereotaxic atlas of the brain of the collared dove, Streptopelia decaocto: using the old and new nomenclature. Shaker Publishing B.V; 2004. [Google Scholar]
- Farries MA. The avian song system in comparative perspective. Ann N Y Acad Sci. 2004;1016:61–76. doi: 10.1196/annals.1298.007. [DOI] [PubMed] [Google Scholar]
- Izawa E, Watanabe S. A stereotaxic atlas of the brain of the jungle crow (Corvus macrorhynchos) Toyko, Japan: Keio University Press; 2007. [Google Scholar]
- Jarvis ED, Gunturkun O, Bruce L, Csillag A, Karten H, Kuenzel W, Medina L, Paxinos G, Perkel DJ, Shimizu T, Striedter G, Wild JM, Ball GF, Dugas-Ford J, Durand SE, Hough GE, Husband S, Kubikova L, Lee DW, Mello CV, Powers A, Siang C, Smulders TV, Wada K, White SA, Yamamoto K, Yu J, Reiner A, Butler AB. Avian brains and a new understanding of vertebrate brain evolution. Nat Rev Neurosci. 2005;6(2):151–159. doi: 10.1038/nrn1606. [DOI] [PMC free article] [PubMed] [Google Scholar]
- Jones EG, Stone JM, Karten HJ. High-resolution digital brain atlases: a Hubble telescope for the brain. Ann N Y Acad Sci. 2011;1225(Suppl 1):E147–159. doi: 10.1111/j.1749-6632.2011.06009.x. [DOI] [PubMed] [Google Scholar]
- Karten HJ, Hodos W. A stereotaxic atlas of the brain of the pigeon (Columba livia) Baltimore, MD: Johns Hopkins Press; 1967. [Google Scholar]
- Kuenzel WJ, Masson M. A Stereotaxic Atlas of the Brain of the chick (Gallus domesticus) Baltimore, MD: Johns Hopkins University Press; 1988. [Google Scholar]
- Lein ES, Hawrylycz MJ, Ao N, Ayres M, Bensinger A, Bernard A, Boe AF, Boguski MS, Brockway KS, Byrnes EJ, Chen L, Chen L, Chen TM, Chin MC, Chong J, Crook BE, Czaplinska A, Dang CN, Datta S, Dee NR, Desaki AL, Desta T, Diep E, Dolbeare TA, Donelan MJ, Dong HW, Dougherty JG, Duncan BJ, Ebbert AJ, Eichele G, Estin LK, Faber C, Facer BA, Fields R, Fischer SR, Fliss TP, Frensley C, Gates SN, Glattfelder KJ, Halverson KR, Hart MR, Hohmann JG, Howell MP, Jeung DP, Johnson RA, Karr PT, Kawal R, Kidney JM, Knapik RH, Kuan CL, Lake JH, Laramee AR, Larsen KD, Lau C, Lemon TA, Liang AJ, Liu Y, Luong LT, Michaels J, Morgan JJ, Morgan RJ, Mortrud MT, Mosqueda NF, Ng LL, Ng R, Orta GJ, Overly CC, Pak TH, Parry SE, Pathak SD, Pearson OC, Puchalski RB, Riley ZL, Rockett HR, Rowland SA, Royall JJ, Ruiz MJ, Sarno NR, Schaffnit K, Shapovalova NV, Sivisay T, Slaughterbeck CR, Smith SC, Smith KA, Smith BI, Sodt AJ, Stewart NN, Stumpf KR, Sunkin SM, Sutram M, Tam A, Teemer CD, Thaller C, Thompson CL, Varnam LR, Visel A, Whitlock RM, Wohnoutka PE, Wolkey CK, Wong VY, Wood M, Yaylaoglu MB, Young RC, Youngstrom BL, Yuan XF, Zhang B, Zwingman TA, Jones AR. Genome-wide atlas of gene expression in the adult mouse brain. Nature. 2007;445(7124):168–176. doi: 10.1038/nature05453. [DOI] [PubMed] [Google Scholar]
- Li X, Wang XJ, Tannenhauser J, Podell S, Mukherjee P, Hertel M, Biane J, Masuda S, Nottebohm F, Gaasterland T. Genomic resources for songbird research and their use in characterizing gene expression during brain development. Proc Natl Acad Sci U S A. 2007;104(16):6834–6839. doi: 10.1073/pnas.0701619104. [DOI] [PMC free article] [PubMed] [Google Scholar]
- MacKenzie-Graham A, Lee EF, Dinov ID, Bota M, Shattuck DW, Ruffins S, Yuan H, Konstantinidis F, Pitiot A, Ding Y, Hu G, Jacobs RE, Toga AW. A multimodal, multidimensional atlas of the C57BL/6J mouse brain. Journal of anatomy. 2004;204(2):93–102. doi: 10.1111/j.1469-7580.2004.00264.x. [DOI] [PMC free article] [PubMed] [Google Scholar]
- Matochik JA, Reems CN, Wenzel BM. A brain atlas of the northern fulmar (Fulmarus glacialis) in stereotaxic coordinates. Brain Behav Evol. 1991;37(4):215–244. doi: 10.1159/000114360. [DOI] [PubMed] [Google Scholar]
- Mikula S, Stone JM, Jones EG. BrainMaps.org - Interactive High-Resolution Digital Brain Atlases and Virtual Microscopy. Brains, minds & media : journal of new media in neural and cognitive science and education. 2008;3:bmm1426. [PMC free article] [PubMed] [Google Scholar]
- Mikula S, Trotts I, Stone JM, Jones EG. Internet-enabled high-resolution brain mapping and virtual microscopy. NeuroImage. 2007;35(1):9–15. doi: 10.1016/j.neuroimage.2006.11.053. [DOI] [PMC free article] [PubMed] [Google Scholar]
- Ng L, Bernard A, Lau C, Overly CC, Dong HW, Kuan C, Pathak S, Sunkin SM, Dang C, Bohland JW, Bokil H, Mitra PP, Puelles L, Hohmann J, Anderson DJ, Lein ES, Jones AR, Hawrylycz M. An anatomic gene expression atlas of the adult mouse brain. Nat Neurosci. 2009;12(3):356–362. doi: 10.1038/nn.2281. [DOI] [PubMed] [Google Scholar]
- Nixdorf-Bergweiler BE, Bischof H-J. A stereotaxic atlas of the brain of the zebra finch, Taeniopygia guttata, with special special emphasis on telencephalic visual and song system nuclei in transverse and sagittal sections. Bethesda: National Library of Medicine, National Center for Biotechnology Information; 2007. [Google Scholar]
- Pinaud R, Osorio C, Alzate O, Jarvis ED. Profiling of experience-regulated proteins in the songbird auditory forebrain using quantitative proteomics. Eur J Neurosci. 2008;27(6):1409–1422. doi: 10.1111/j.1460-9568.2008.06102.x. [DOI] [PMC free article] [PubMed] [Google Scholar]
- Poirier C, Vellema M, Verhoye M, Van Meir V, Wild JM, Balthazart J, Van Der Linden A. A three-dimensional MRI atlas of the zebra finch brain in stereotaxic coordinates. NeuroImage. 2008;41(1):1–6. doi: 10.1016/j.neuroimage.2008.01.069. [DOI] [PubMed] [Google Scholar]
- Puelles L, Paxinos G, Watson C, Martinez S, Martinez-de-la-Torre M. The Chick Brain in Stereotaxic Coordinates: An Atlas Based on Neuromeres. Elsevier Science & Technology Books; 2007. [Google Scholar]
- Reiner A, Perkel DJ, Bruce LL, Butler AB, Csillag A, Kuenzel W, Medina L, Paxinos G, Shimizu T, Striedter G, Wild M, Ball GF, Durand S, Gunturkun O, Lee DW, Mello CV, Powers A, White SA, Hough G, Kubikova L, Smulders TV, Wada K, Dugas-Ford J, Husband S, Yamamoto K, Yu J, Siang C, Jarvis ED. Revised nomenclature for avian telencephalon and some related brainstem nuclei. J Comp Neurol. 2004;473(3):377–414. doi: 10.1002/cne.20118. [DOI] [PMC free article] [PubMed] [Google Scholar]
- Replogle K, Arnold AP, Ball GF, Band M, Bensch S, Brenowitz EA, Dong S, Drnevich J, Ferris M, George JM, Gong G, Hasselquist D, Hernandez AG, Kim R, Lewin HA, Liu L, Lovell PV, Mello CV, Naurin S, Rodriguez-Zas S, Thimmapuram J, Wade J, Clayton DF. The Songbird Neurogenomics (SoNG) Initiative: community-based tools and strategies for study of brain gene function and evolution. BMC Genomics. 2008;9:131. doi: 10.1186/1471-2164-9-131. [DOI] [PMC free article] [PubMed] [Google Scholar]
- Rojo MG, Garcia GB, Mateos CP, Garcia JG, Vicente MC. Critical comparison of 31 commercially available digital slide systems in pathology. International journal of surgical pathology. 2006;14(4):285–305. doi: 10.1177/1066896906292274. [DOI] [PubMed] [Google Scholar]
- Roland PE, Zilles K. Brain atlases--a new research tool. Trends Neurosci. 1994;17(11):458–467. doi: 10.1016/0166-2236(94)90131-7. [DOI] [PubMed] [Google Scholar]
- Stokes TM, Leonard CM, Nottebohm F. The telencephalon, diencephalon, and mesencephalon of the canary, Serinus canaria, in stereotaxic coordinates. J Comp Neurol. 1974;156(3):337–374. doi: 10.1002/cne.901560305. [DOI] [PubMed] [Google Scholar]
- Swanson LW. Brain maps: computer graphics files. San Diego: Academic Press; 1993. [Google Scholar]
- Swanson LW. In: Interactive Brain maps and atlases. Arbib MA, Grethe JG, editors. San Diego: Academic Press; 2001. [Google Scholar]
- Toga AW, Banerjee PK. Registration revisited. J Neurosci Methods. 1993;48(1–2):1–13. doi: 10.1016/s0165-0270(05)80002-0. [DOI] [PubMed] [Google Scholar]
- Toga AW, Santori EM, Hazani R, Ambach K. A 3D digital map of rat brain. Brain research bulletin. 1995;38(1):77–85. doi: 10.1016/0361-9230(95)00074-o. [DOI] [PubMed] [Google Scholar]
- Wada K, Howard JT, McConnell P, Whitney O, Lints T, Rivas MV, Horita H, Patterson MA, White SA, Scharff C, Haesler S, Zhao S, Sakaguchi H, Hagiwara M, Shiraki T, Hirozane-Kishikawa T, Skene P, Hayashizaki Y, Carninci P, Jarvis ED. A molecular neuroethological approach for identifying and characterizing a cascade of behaviorally regulated genes. Proc Natl Acad Sci U S A. 2006;103(41):15212–15217. doi: 10.1073/pnas.0607098103. [DOI] [PMC free article] [PubMed] [Google Scholar]
- Warren WC, Clayton DF, Ellegren H, Arnold AP, Hillier LW, Kunstner A, Searle S, White S, Vilella AJ, Fairley S, Heger A, Kong L, Ponting CP, Jarvis ED, Mello CV, Minx P, Lovell P, Velho TA, Ferris M, Balakrishnan CN, Sinha S, Blatti C, London SE, Li Y, Lin YC, George J, Sweedler J, Southey B, Gunaratne P, Watson M, Nam K, Backstrom N, Smeds L, Nabholz B, Itoh Y, Whitney O, Pfenning AR, Howard J, Volker M, Skinner BM, Griffin DK, Ye L, McLaren WM, Flicek P, Quesada V, Velasco G, Lopez-Otin C, Puente XS, Olender T, Lancet D, Smit AF, Hubley R, Konkel MK, Walker JA, Batzer MA, Gu W, Pollock DD, Chen L, Cheng Z, Eichler EE, Stapley J, Slate J, Ekblom R, Birkhead T, Burke T, Burt D, Scharff C, Adam I, Richard H, Sultan M, Soldatov A, Lehrach H, Edwards SV, Yang SP, Li X, Graves T, Fulton L, Nelson J, Chinwalla A, Hou S, Mardis ER, Wilson RK. The genome of a songbird. Nature. 2010;464(7289):757–762. doi: 10.1038/nature08819. [DOI] [PMC free article] [PubMed] [Google Scholar]
- Zeigler HP, Marler P, editors. Neuroscience of Birdsong. Cambridge, UK: Cambridge University Press; 2008. [Google Scholar]


