

Abstract
Background
Mycobacterium ulcerans is the causative agent of Buruli ulcer (BU), a necrotizing disease of the skin, soft tissue and bone. PCR is increasingly used in the diagnosis of BU and in research on the mode of transmission and environmental reservoir of M. ulcerans.
Methodology/Principal Findings
The aim of this study was to evaluate the performance of laboratories in detecting M. ulcerans using molecular tests in clinical and environmental samples by implementing sequential multicenter external quality assessment (EQA) programs. The second round of the clinical EQA program revealed somewhat improved performance.
Conclusions/Significance
Ongoing EQA programs remain essential and continued participation in future EQA programs by laboratories involved in the molecular testing of clinical and environmental samples for M. ulcerans for diagnostic and research purposes is strongly encouraged. Broad participation in such EQA programs also benefits the harmonization of quality in the BU research community and enhances the credibility of advances made in solving the transmission enigma of M. ulcerans.
Introduction
The implementation of PCR-based methods for the detection of Mycobacterium ulcerans, the causative organism of Buruli ulcer (BU), in clinical and environmental samples 15 years ago [1]–[3] has drastically improved our knowledge of BU. BU is an indolent necrotizing disease of the skin, subcutaneous tissue, and bone [4] occurring mainly in certain riverine rural areas of West and Central Africa and in coastal southeastern Australia with about 20,000 cases reported in the last decade [4]. BU is presently the third most common mycobacterial disease of humans, after tuberculosis and leprosy, and the least well understood of the three [5].
In most BU endemic settings the working conditions are difficult and the diagnosis of BU is often made on clinical and epidemiological grounds. However, the disease presents with a diverse range of clinical symptoms and, due to possible confusion with other tropical skin diseases, the added value of microbiological confirmation is becoming more appreciated. Among the available laboratory tests (direct smear examination for acid fast bacilli, culture, PCR and histopathology), PCR targeting the insertion element IS2404 (present in over 200 copies in the M. ulcerans genome) is by far the most sensitive and specific, and much faster than culture, which takes an average of 10 weeks and only has 45% sensitivity despite many efforts to improve decontamination methods, culture media and incubation conditions [6]–[10]. Since isolating M. ulcerans from environmental sources has until now, despite numerous attempts, only been successful once [11], most current knowledge on the environmental reservoir and mode of transmission of M. ulcerans is based on studies that have used PCR to amplify IS2404 and other targets (less frequent in the M. ulcerans genome) such as the insertion element IS2606, the ketoreductase B domain (KR) and the enoyl reductase domain (ER) suggesting the presence of M. ulcerans DNA in a number of biotic and abiotic elements of the environment [12]–[14]. The actual environmental reservoir(s) and mode(s) of transmission, however, remain a mystery.
Clinical and environmental samples can contain low concentrations of M. ulcerans DNA, PCR inhibitors and DNA from other sources that may generate non-specific PCR products, which present a number of difficulties when applying molecular methods to diagnosis and research. Moreover, previous external quality control studies for PCR detection of Mycobacterium tuberculosis and hepatitis B virus have shown that PCR may be unreliable because of false-positive results caused by contamination or because of false-negative results caused by a lack of sensitivity, inhibition, or other reasons [15]–[17]. The virtually unique reliance on PCR for diagnostic and research purposes in the field of BU requires the continued and convincing demonstration of its accuracy, reliability and reproducibility. This requirement compels laboratories to establish and implement effective and comprehensive quality assurance schemes for their PCR tests. Quality assurance involves intensive internal quality control as well as a system of external quality control. In light of this, in 2008 the Technical Advisory Group of the WHO Global Buruli Ulcer Initiative recommended the establishment of an external quality assessment program (EQAP) for the molecular detection of M. ulcerans in clinical and environmental samples.
EQAPs are performed to assist laboratories maintain high standards. They enable participants to check that samples are processed correctly, that results are appropriately recorded, and that assays are robust and are being performed in an accurate and reproducible manner. External quality assessment can consist of audit visits, proficiency testing with an adequate number of coded specimens and periodic rechecking of specimens. This report summarizes the results of two rounds of proficiency testing for the molecular detection of M. ulcerans in clinical and environmental samples coordinated by the WHO Collaborating Centers for M. ulcerans, respectively, the Institute of Tropical Medicine (ITM) in Antwerp, Belgium, and the Victorian Infectious Diseases Reference Laboratory (VIDRL) in Melbourne, Australia. The objectives of these programs were to assess the performance of the participating laboratories in detecting M. ulcerans DNA and to compare their performance between rounds.
Materials and Methods
Proficiency testing by both WHO Collaborating Centers involved the distribution to national laboratories of panels of coded specimens with known status, with the coding sequence differing from panel to panel. All samples were shipped at ambient temperature to the participants (Table 1). In addition, a questionnaire on the methodologies used and laboratory characteristics was included in each shipment along with instructions and a results sheet.
Table 1. Participating laboratories in the two rounds of clinical and environmental EQAP.
| Laboratory | Country | Clinical EQAP | Environmental EQAP | ||
| round 1 | round 2 | round 1 | round 2 | ||
| Monash University | Australia | no | no | yes | no |
| Queensland Mycobacterium Reference Laboratory | Australia | no | yes | no | no |
| Victorian Infectious Diseases Reference Laboratory | Australia | yes | yes | yes | yes |
| Institute of Tropical Medicine | Belgium | yes | yes | yes | yes |
| Laboratoire de Référence des Mycobactéries | Benin | yes | yes | no | no |
| Centre Pasteur Yaoundé | Cameroon | yes | yes | yes | yes |
| Institut Pasteur | Côte d’Ivoire | yes | yes | no | yes |
| Institut de Recherche Biomédicale | DRC | no | yes | no | no |
| Université d’Angers | France | yes | no | yes | yes |
| Institut Pasteur Guyane-Cayenne | French Guyana | no | yes | yes | no |
| Ludwig-Maximilians University Hospital | Germany | yes | yes | no | no |
| Komfo Anokye Teaching Hospital | Ghana | yes | no | no | no |
| Kumasi Centre for Collaborative Research | Ghana | no | yes | no | no |
| Noguchi Memorial Institute for Medical Research 1 | Ghana | no | yes | no | yes |
| Noguchi Memorial Institute for Medical Research 2 | Ghana | no | yes | no | no |
| University of Eastern Piedmont | Italy | yes | yes | no | no |
| National Institute of Infectious Diseases | Japan | no | yes | yes | no |
| Institut Pasteur | Central African Republic | yes | yes | no | no |
| Swiss Tropical and Public Health Institute | Switzerland | no | yes | no | yes |
| Institut National d’Hygiene | Togo | no | yes | no | no |
| University of Tennessee | USA | yes | yes | yes | yes |
Participating laboratories were asked to process the EQA panel using the DNA extraction and PCR methods they routinely used for molecular detection of M. ulcerans. To ensure confidentiality, all participating laboratories were assigned a code. The test results by the laboratories were compared with the coded results in a blinded way and specific performance indicators (concordance, sensitivity, specificity and reproducibility) calculated. The participating laboratories received a report summarizing the results of the EQAP that allowed them to compare their performance to that of other laboratories. Individual discussions between the WHO Collaborating Centers and some participants to reflects on possible causes and solutions of weak performances took place by email and at the WHO BU meeting in Geneva, Switzerland in March 2010.
Ethics Statement
The existing collection of anonymized surplus diagnostic samples hosted by the ITM in its role of WHO Collaborating Centre for the Diagnosis and Surveillance of Mycobacterium ulcerans Infection was used to prepare the distributed EQA panels. For this kind of activity no approval of an ethics committee is needed according to the Belgian law of 7 May 2004 concerning experiments on humans (Chapter II, Art. 2, 23′ and Chapter II, Art. 3) [18].
Clinical EQAP
During the first round, organized in 2009, the EQA panel for the detection of M. ulcerans DNA consisted of 34 suspensions of clinical specimens in PBS and 70% ethanol (50∶50) to kill bacteria. During the second round, organized in 2011, 33 such suspensions were included. Suspensions were selected in such a way that they would allow an assessment of sensitivity, specificity, and inter-laboratory reproducibility (Table 2). The positive suspensions represented strong as well as weak positives (quantified by direct smear examination). Among the M. ulcerans negative samples, some suspensions of clinical specimens positive for M. tuberculosis and M. marinum were included. All suspensions were sent in duplicate to assess intra-laboratory reproducibility. In order to distinguish whether weak performance during the first round was due to problems during DNA extraction versus amplification, serial dilutions of extracted genomic M. ulcerans DNA suspended in 1xTE were distributed during the second round, in addition to the suspensions. Ten-fold dilutions of 29×10−4 ng/µl to 29×10−9 ng/µl genomic DNA were included in duplicate. Testing both specimen suspensions and DNA extracts allowed laboratories to evaluate the performance of their methods for DNA extraction and for PCR, separately.
Table 2. Panel composition of the two rounds of clinical EQAP and concordant qualitative results per sample (inter-laboratory reproducibility).
| round 1 clinical EQAP | round 2 clinical EQAP | ||||||
| Sample ID | Sample status (IS2404-Ct value)a | Direct smear examination | N° of concordant results/Total n° of respondent laboratories (%)b | Sample ID | Sample status (IS2404-Ct value)a | Direct smear examination | N° of concordant results/Total n° of respondent laboratories (%)b |
| 4 | Positive (34.47) | Negative | 9/11 (82) | 1 | Negative | Negative | 14/15b (93) |
| 44 | Positive (34.15) | Negative | 7/11 (64) | 2 | Negative | Negative | 16/16 (100) |
| 117 | Negative | Negative | 10/11 (91) | 3 | M. tuberculosis | Negative | 16/16 (100) |
| 140 | Negative | Negative | 10/11 (91) | 4 | Positive (29.49) | 4+ | 13/16 (81) |
| 172 | Negative | Negative | 8/11 (73) | 5 | Negative | Negative | 16/16 (100) |
| 231 | Negative | Negative | 8/10 (80) | 6 | Positive (37.33) | Negative | 12/16 (75) |
| 269 | M. tuberculosis | 1+ | 10/11 (91) | 7 | Positive (22.14) | 4+ | 14/16 (88) |
| 299 | M. tuberculosis | 1+ | 10/11 (91) | 8 | Positive (38,69) | Negative | 9/16 (56) |
| 318 | M. tuberculosis | Negative | 8/11 (73) | 9 | Positive (30.27) | 1+ | 16/16 (100) |
| 387 | M. tuberculosis | Negative | 10/11 (91) | 10 | Negative | Negative | 16/16 (100) |
| 433 | Positive (28.00) | 2+ | 9/11 (82) | 11 | M. marinum | Negative | 16/16 (100) |
| 457 | Positive (28.13) | 2+ | 10/11 (91) | 12 | Negative | Negative | 14/16 (88) |
| 502 | Negative | Negative | 8/11 (73) | 13 | Negative | Negative | 15/16 (94) |
| 545 | Negative | Negative | 9/11 (82) | 14 | Negative | Negative | 15/16 (94) |
| 631 | Negative | Negative | 7/11 (64) | 15 | Positive (19.90) | 4+ | 16/16 (100) |
| 654 | Negative | Negative | 7/11 (64) | 16 | Negative | Negative | 16/16 (100) |
| 681 | M. tuberculosis | Negative | 10/11 (91) | 17 | Positive (38.43) | Negative | 9/16 (56) |
| 741 | M. tuberculosis | Negative | 10/11 (91) | 18 | Negative | Negative | 14/16 (88) |
| 787 | Positive (22.35) | 4+ | 10/11 (91) | 19 | Negative | Negative | 14/16 (88) |
| 864 | Positive (22.88) | 4+ | 10/11 (91) | 20 | M. tuberculosis | Negative | 15/16 (94) |
| 908 | Positive (37.78) | Negative | 4/9 (44) | 21 | Positive (29.41) | 4+ | 13/16 (81) |
| 962 | Positive (36.80) | Negative | 5/10 (50) | 22 | Negative | Negative | 15/16 (94) |
| 1017 | Positive (22.10) | 4+ | 11/11 (100) | 23 | Positive (37.30) | Negative | 11/16 (69) |
| 1117 | Positive (22.10) | 4+ | 11/11 (100) | 25 | Positive (38.92) | Negative | 5/16 (31) |
| 1185 | Negative | Negative | 10/11 (91) | 26 | Positive (29.34) | 1+ | 14/16 (88) |
| 1212 | Negative | Negative | 9/11 (82) | 27 | Negative | Negative | 16/16 (100) |
| 1271 | Positive (36.44) | Negative | 6/10 (60) | 28 | M. marinum | Negative | 15/16 (94) |
| 1283 | Positive (36.70) | negative | 7/11 (64) | 29 | Negative | Negative | 15/16 (94) |
| 1366 | Negative | 1+ | 9/10 (90) | 30 | Negative | Negative | 16/16 (100) |
| 1391 | Negative | 1+ | 8/10 (80) | 31 | Negative | Negative | 16/16 (100) |
| 1475 | Negative | Negative | 11/11 (100) | 32 | Positive (19.92) | 4+ | 13/16 (81) |
| 1505 | Negative | Negative | 10/11 (91) | 33 | Negative | Negative | 15/16 (94) |
| 1578 | Positive (32.56) | 1+ | 10/11 (91) | 34 | Positive (37.45) | Negative | 7/16 (44) |
| 1649 | Positive (32.36) | 1+ | 10/11 (91) | ||||
No sample was inhibited. b The total number of respondent laboratories varies because inconclusive results were removed from the analysis as well as a missing suspension in one laboratory in round 1.
Environmental EQAP
During the first (pilot) round, organized in 2008, participants were sent eight heat-sterilized environmental samples each comprising a mixture of soil, leaf litter, detritus and animal faeces collected from BU endemic and non-endemic areas in Victoria, Australia. The positive samples were true positives containing varying concentrations of M. ulcerans DNA as determined by IS2404 real-time PCR [14] (Table 3). The rationale for using only one sample type during the pilot round was to minimize the number of variables so that the only difference between samples was the presence or absence of M. ulcerans DNA. During the second round, organized in 2010, participants received 10 heat-sterilized environmental samples. The samples were selected to represent the types of samples commonly tested by BU researchers (water, soil, aquatic plants and animal faeces) and to include the types of samples that often contain PCR inhibitors (Table 3). The positive samples represented stronger as well as weaker positives as determined by IS2404 real-time PCR [14] (Table 3). The positive faecal samples were true positive samples collected from a BU endemic area, whereas the other positive samples were spiked with suspensions of M. ulcerans, as in Australia these types of samples are less frequently positive and contain lower concentrations of M. ulcerans DNA [19], rendering the collection of true positive samples difficult. To assess the impact of a delay in the shipment and/or processing of samples, two panels were retained at VIDRL (one stored at 4°C and the other at room temperature) and tested after all participants had submitted their results.
Table 3. Panel composition of the two rounds of environmental EQAP and concordant results per sample (inter-laboratory reproducibility).
| round 1 environmental EQAP | round 2 environmental EQAP | ||||||||
| Sample ID | Sampletypea | Sample status (IS2404-Ctvalue before, after)b | N° of concordant results/Total n° of respondent laboratories (%)c | Sample ID | Sample type | Sample status (IS2404-Ctvalue before, after)b | N° of concordant results/Total n°of respondent laboratories (%) | ||
| 1 | Mixture | Positive (26.53, 27.74) | 7/7 (100) | 1 | Soil | Negative | 8/8 (100) | ||
| 2 | Mixture | Negative | 6/7 (86) | 2 | Soil | Positive (22.19, 23.11) | 6/8 (75) | ||
| 3 | Mixture | Negative | 6/7 (86) | 3 | Water | Negative | 7/8 (88) | ||
| 4 | Mixture | Positive (25.73, 27.22) | 7/7 (100) | 4 | Algae | Negative | 8/8 (100) | ||
| 5 | Mixture | Positive (23.64, 25.13) | 7/7 (100) | 5 | Faeces | Negative | 7/8 (88) | ||
| 6 | Mixture | Negative | 6/7 (86) | 6 | Algae | Positive (28.89, 35.25) | 7/8 (88) | ||
| 7 | Mixture | Negative | 6/7 (100) | 7 | Faeces | Positive (33.77, 34.09) | 5/8 (63) | ||
| 8 | Mixture | Negative | 6/6 (100) | 8 | Water | Positive (36.19, 37.54) | 8/8 (100) | ||
| 9 | Faeces | Negative | 7/8 (88) | ||||||
| 10 | Faeces | Positive (30.48, 30.49) | 6/8 (75) | ||||||
All samples consisted of a mixture of soil, leaf litter, detritus, animal faeces.
Mean Ct value of duplicate IS2404 real-time PCR before samples were shipped to participants and after all participants had returned results.
One laboratory was missing a sample in round 1.
Statistical Analysis
Inter-laboratory reproducibility was calculated per sample as the number of qualitative results concordant with the organizing centers obtained by the laboratories divided by the total number of participating laboratories.
The concordance of a laboratory was calculated as the ratio of concordant qualitative results obtained by the laboratory over the total number of samples.
Results were considered false negative or false positive when they differed from the qualitative results obtained by the organizing laboratory using real-time PCR.
Intra-laboratory reproducibility was assessed by shipping all suspensions in duplicate and calculated as the ratio of pairs concordant with the organizing centers over the total number of pairs.
GraphPad Prism v. 5 was used for linear regression analysis of reproducibility and concordance vs. workload, and false negative rate vs. the PCR detection limit.
Results
Clinical EQAP
A total of 11 laboratories from 11 countries participated in the first round of the clinical EQAP while 18 laboratories from 15 countries took part in the second round (Table 1).
Results by sample (inter-laboratory reproducibility)
During the first round, the proportion of qualitative results concordant with ITM varied between 44% and 100%, median 90%, by sample (Table 2). Only 3 samples were identified correctly by all laboratories. In the second round, this proportion ranged between 31% and 100%, median 94%, with eleven samples identified correctly by all laboratories. Six suspensions (actually the duplicates of three) were reported correctly by less than 60% of the laboratories indicating that they were positive at the detection limit of the PCR assays used. These samples were indeed negative by direct smear examination and had reported IS2404-Ct values between 36 and 37, as compared with Ct values between 20 and 30 for smear positive samples.
Results by laboratory (concordance, false positive and false negative results, intra-laboratory reproducibility)
The proportion of concordant qualitative results varied between 58% and 100%, median 82%, by laboratory in the first round and between 64% and 100%, median 88%, in the second round (Table 4). In both rounds only two laboratories reported all results correctly.
Table 4. Qualitative results per laboratory of the two rounds of clinical EQAP.
| round 1 clinical EQAP | |||||||||||
| Laboratory code | N° of concordant results/Total n° of suspensions analysed (%)a | N° of false positives (%) | N° of false negatives? (%) | Intra-laboratory reproducibilityb | Delay in analysis (days)c | Laboratory type | N° clinical specimens tested in 2008 | Extraction method | PCR assay | PCR target | |
| 1 | 33/33 (100) | 0 (0) | 0 (0) | 100 | 26 | Reference | 100–499 | commercial | real-time | IS2404 | |
| 3 | 25/34 (74) | 9 (45) | 0 (0) | 59 | 7 | Reference | >500 | in-house | nested | IS2404 | |
| 4 | 30/32 (94) | 0 (0) | 2 (14) | 100 | 137 | Reference | 100–499 | commercial | single | IS2404 | |
| 5 | 22/32 (69) | 6 (32) | 4 (31) | 73 | 140 | Hospital | 100–499 | in-house | single | IS2404 | |
| 8 | 26/34 (76) | 2 (10) | 6 (43) | 65 | 83 | Reference | 1–29 | in-house | single | IS2404 | |
| 10 | 19/33 (58) | 6 (32) | 8 (57) | 88 | 160 | Academic | 1–29 | in-house | single and real-time | IS2404 and ER | |
| 13 | 28/34 (82) | 4 (20) | 2 (14) | 76 | 74 | Academic | 30–99 | commercial | nested | IS2404 and IS2606 | |
| 17 | 34/34 (100) | 0 (0) | 0 (0) | 100 | 42 | Reference | >500 | commercial | single | IS2404 | |
| 18 | 29/33 (88) | 3 (16) | 0 (0) | 100 | 176 | Hospital | >500 | in-house | real-time | IS2404 and KR | |
| 19 | 33/34 (97) | 1 (5) | 0 (0) | 94 | 5 | Reference | >500 | in-house | nested | IS2404 | |
| 20 | 23/34 (68) | 0 (0) | 11 (79) | 82 | 12 | Academic | 100–499 | commercial | single | IS2404 | |
| round 2 clinical EQAP | |||||||||||
| Laboratory code | N° of concordant results/Total n° of suspensions analyzed (%) a | N° of false positives (%) | N° of false negatives (%) | Intra-laboratory reproducibilityb | Delay in analysis (days)c | Laboratory type | N° clinical specimens tested in 2010 | Extraction method | PCR assay | PCR target | Lowest DNA dilution detected (x29 ng/µl) |
| 1 | 32/32 (100) | 0 (0) | 0 (0) | 100 | 27 | Reference | 100–499 | commercial | real-time | IS2404 | 10−8 |
| 2 | 26/33 (79) | 4 (20) | 3 (23) | 81 | 16 | Reference | 100–499 | commercial | real-time | IS2404 | 10−7 |
| 3 | 30/33 (91) | 2 (10) | 1 (8) | 81 | 40 | Private | 1–29 | commercial | real-time | IS2404 | 10−7 |
| 5 | 23/33 (70) | 0 (0) | 10 (77) | 94 | 40 | Reference | 1–29 | in-house | single | IS2404 | 10−5 |
| 6 | 32/33 (97) | 0 (0) | 1 (8) | 94 | 89 | Academic | >500 | commercial | single | IS2404 | 10−7 |
| 7 | 33/33 (100) | 0 (0) | 0 (0) | 100 | 22 | Academic | 100–499 | commercial | real-time | IS2404 | 10−8 |
| 8 | 29/33 (88) | 0 (0) | 4 (31) | 88 | 36 | Academic | 0 | in-house | real-time | IS2404 and ER | 10−6 |
| 9 | NT | NT | NT | NT | 20 | Academic | 1–29 | commercial | single | IS2404 | 10−6 |
| 10 | 28/33 (85) | 0 (0) | 5 (38) | 94 | 49 | Academic | 100–499 | commercial | nested | IS2404 and IS2606 | Nothing detected |
| 13 | 28/33 (85) | 0 (0) | 5 (38) | 94 | 35 | Academic | 100–499 | commercial | single | IS2404 | 10−7 |
| 14 | 29/33 (88) | 3 (15) | 1 (8) | 75 | 33 | Reference | 1–29 | commercial | nested | IS2404 | 10−7 |
| 15 | 21/33 (64) | 0 (0) | 12 (92) | 94 | 48 | Reference | 0 | commercial | single | IS2404 | 10−5 |
| 19 | 32/33 (97) | 1 (5) | 0 (0) | 94 | 60 | Reference | 1–29 | commercial | real-time | IS2404 | 10−8 |
| 22 | NT | NT | NT | NT | 40 | Reference | 100–499 | commercial | single | IS2404 | 10−7 |
| 23 | 26/33 (79) | 2 (10) | 5 (38) | 81 | 40 | Reference | 100–499 | commercial | nested | IS2404 | 10−7 |
| 25 | 29/33 (88) | 0 (0) | 4 (31) | 100 | 17 | Academic | 100–499 | in-house | nested | IS2404 | 10−7 |
| 26 | 27/33 (82) | 0 (0) | 6 (46) | 88 | 41 | Reference | 100–499 | commercial | real-time | IS2404 | 10−6 |
| 28 | 29/33 (88) | 2 (10) | 2 (15) | 75 | 160 | Reference | 100–499 | in-house | nested | IS2404 | 10−8 |
The total n° of suspensions analyzed varies per laboratory because some laboratories reported inconclusive results. b The number of concordant pairs divided by the total number of pairs. c Delay between the date of shipment of the panel and the reported date of analysis. NT: not tested; ER: enoyl reductase domain; KR: ketoreductase B domain.
In the first round, seven (64%) of the participating laboratories reported false positive results while six (55%) laboratories reported false negative results. Five laboratories tested for individual inhibition and one of them erroneously observed inhibition in two samples. In the second round, six (38%) participating laboratories reported false positive results while 13 (81%) reported false negative results. Seven laboratories tested for inhibition in individual samples and correctly observed none.
Intra-laboratory reproducibility varied between 59 and 100%, median 88%, and was less than 90% in six laboratories (55%) during the first round (Table 4). During the second round reproducibility within laboratories varied between 75% and 100%, median 94%, and was less than 90% in seven laboratories (44%).
Laboratory type, workload and methods used
In 2009, reference laboratories (n = 6) reported between 74% and 100%, median 95%, concordant qualitative results and achieved intra-laboratory reproducibilities between 59% and 100%, median 97%. Academic and hospital laboratories (n = 5) reported between 58% and 87%, median 69%, concordant results and intra-laboratory reproducibilities between 73% and 100%, median 82%.
In 2011, reference laboratories (n = 9) reported between 64% and 100%, median 82%, concordant qualitative results and achieved an intra-laboratory reproducibility between 75% and 100%, median 88%. Academic and private laboratories (n = 7) reported between 85% and 100%, median 88%, concordant results and an intra-laboratory reproducibility between 81% and 100%, median 94%.
When stratifying for workload we found a non-significant correlation between workload and concordance (Fig. 1) and no association between workload and reproducibility (Fig. 2).
Figure 1. Concordance expressed as proportion of concordant results of participating laboratories vs. workload expressed as number of clinical samples processed in 2008 (A) and in 2010 (B).
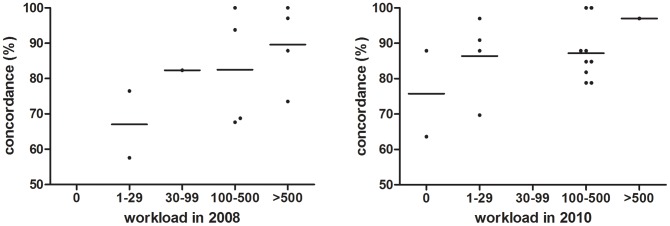
A linear regression analysis identified a non-significant trend towards better performance by laboratories handling high sample volumes (A: p = 0,0830; B: p = 0,1618).
Figure 2. Intra-laboratory reproducibility expressed as the ratio of correctly analysed clinical sample pairs over the total number of pairs versus workload expressed as number of clinical samples processed in 2008 (A) and in 2010 (B).
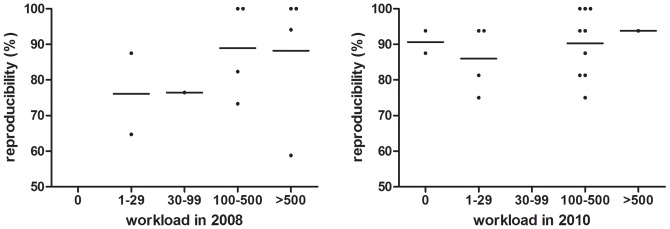
A linear regression analysis indicated that the slope of both graphs does not significantly deviate from zero (A: p = 0,3183; B: p = 0,5623).
Participants used a range of DNA extraction protocols, PCR methods and amplification targets, including both in-house methods (Phenol-chloroform and modified Boom [20]) and kits (e.g. Roche respiratory specimen preparation kit, Qiagen QiAmp DNA mini kit, MOBID ultraclean soil kit and MoBio spin columns, Qiagen Puregene core kit, Qiagen DNeasy blood and tissue kit, Roche high pure PCR template preparation kit, Promega Maxwell 16 Instrument) for DNA extraction and gel-based [21]–[23] and real-time PCR [14], [24] for sequence detection. In the first round, six laboratories reported the use of an in-house DNA extraction method (58%–97%, median 75% concordant results) while five reported to use a commercial method (68%–100%, median 94% concordant results). Three laboratories used real-time PCR (58%–100%, median 88% concordant results). Among the eight laboratories using gel-based conventional PCR, three used a nested format (74%–97%, median 82% concordant results) while five used a single run format (68%–100%, median 77% concordant results). All laboratories amplified the IS2404 sequence. One laboratory amplified additionally also the gene encoding for ketoreductase (KR), one laboratory the gene encoding for enoyl reductase (ER), while a third laboratory amplified also the IS2606 sequence.
In the second round, four laboratories reported the use of an in-house DNA extraction method (70%–88%, median 88% concordant results) while 12 reported to use a commercial method (64%–100%, median 86% concordant results). Seven laboratories used real-time PCR (79%–100%, median 91% concordant results). Among the nine laboratories using gel-based conventional PCR, five used a nested format (79%–88%, median 88% concordant results) while four used a single run format (64%–97%, median 77% concordant results). All laboratories amplified the IS2404 sequence. One laboratory amplified additionally the gene encoding for enoyl reductase (ER), while a second laboratory also amplified the IS2606 sequence.
DNA extracts
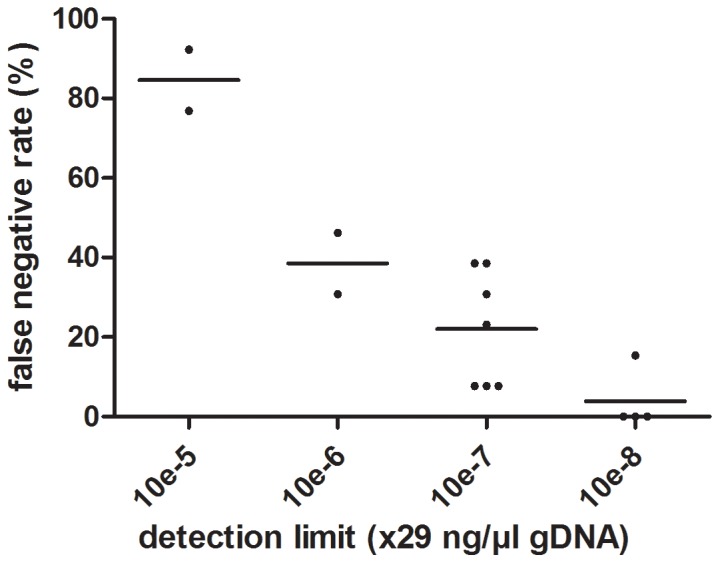
All laboratories but one were able to detect 10−5*29 ng/µl or less DNA. No laboratory detected the lowest dilution of 10−9*29 ng/µl. One laboratory detected M. ulcerans DNA in none of the DNA dilutions. Laboratories able to detect lower concentrations of DNA also had less false negative results among the specimen suspensions (Fig. 3) and this association was significant (p<0.0001).
Figure 3. A significant correlation exists between the rate of false negative clinical samples versus the detection limit of the PCR-assay (p<0.0001, R2 = 0,7959).
Environmental EQAP
Seven laboratories from six countries participated in the first round of the environmental EQAP (Table 1). Eight laboratories from eight countries took part in the second round (Table 1). Five laboratories participated in both rounds.
Results by sample (inter-laboratory reproducibility)
There was a high level of inter-laboratory reproducibility in both rounds (Table 3). In the first round, the proportion of results concordant with VIDRL varied between 86% and 100% by sample, with four samples correctly identified by all laboratories. In the second round, this proportion ranged from 63% to 100%, with three samples correctly identified by all participants.
Results by laboratory (concordance, false positive and false negative results)
The proportion of concordant qualitative results varied between 43% and 100% by laboratory in the first round and between 50% and 100% in the second round (Table 5). The median overall performance was 100% concordant in the first round and 95% in the second round. Six laboratories reported 100% concordant results in the first round while four reported 100% concordant results in the second round. Of the five laboratories that participated in both rounds, two reported all results correctly in both rounds, two scored worse in the second round and one scored better.
Table 5. Qualitative results per laboratory of the two rounds of environmental EQAP.
| Round 1 environmental EQAP | ||||||||||||
| Laboratory code | N° of concordant results/Total n° of suspensions analysed (%)a | N° of false positives (%) | N° of false negatives (%) | Extraction method | PCR assay | PCR target | ||||||
| 1 | 8/8 (100) | 0 (0) | 0 (0) | Commercial | Real-time | IS2404, IS2606 and KR | ||||||
| 2 | 8/8 (100) | 0 (0) | 0 (0) | Commercial | Real-time | IS2404 and KR | ||||||
| 3 | 3/7 (43) | 4 (57) | 0 (0) | Commercial | Single and nested | IS2404 and IS2606 | ||||||
| 4 | 8/8 (100) | 0 (0) | 0 (0) | Commercial | Single | IS2404 | ||||||
| 5 | 0/0b | N/A | N/A | Not stated | Single and real-time | ER | ||||||
| 6 | 8/8 (100) | 0 (0) | 0 (0) | Commercial | Real-time | IS2404 | ||||||
| 7 | 8/8 (100) | 0 (0) | 0 (0) | Commercial | Real-time | IS2404 and KR | ||||||
| 8 | 8/8 (100) | 0 (0) | 0 (0) | In-house | Real-time | IS2404, IS2606 and KR | ||||||
| Round 2 environmental EQAP | ||||||||||||
| Laboratory code | N° of concordant results/Total n° of suspensions analysed (%) a | N° of false positives (%) | N° of false negatives (%) | N° environmental samples tested in 2009 | Extraction method | PCR assay | PCR target | |||||
| 1 | 10/10 (100) | 0 (0) | 0 (0) | 100–500 | Commercial | Real-time | IS2404, IS2606 and KR | |||||
| 4 | 5/10 (50) | 1 (10) | 4 (40) | <100 | Commercial | Real-time | IS2404 and KR | |||||
| 5 | 10/10 (100) | 0 (0) | 0 (0) | 100–500 | Commercial | Real-time | IS2404 and ER | |||||
| 7 | 9/10 (90) | 0 (0) | 1 (10) | 100–500 | Commercial | Real-time | IS2404 and KR | |||||
| 8 | 10/10 (100) | 0 (0) | 0 (0) | <100 | In-house | Real-time | IS2404, IS2606 and KR | |||||
| 9 | 10/10 (100) | 0 (0) | 0 (0) | <100 | Commercial | Real-time | IS2404 | |||||
| 10 | 8/10 (80) | 2 (20) | 0 (0) | <100 | Commercial | Real-time | IS2404 | |||||
| 11 | 7/10 (70) | 0 (0) | 3 (30) | <100 | Commercial | Nested | IS2404 and IS2606 | |||||
The total n° of suspensions analyzed varies per laboratory because some laboratories reported inconclusive results. b This laboratory did not formally submit results, but used the program to troubleshoot its DNA extraction and PCR protocols with the assistance of the coordinating laboratory (see results for details). ER: enoyl reductase domain; KR: ketoreductase B domain.
In the first round, one laboratory reported false positive results (Table 5). In the second round, one laboratory reported false positive results, two laboratories reported false negative results and one laboratory reported both false positive and false negative results.
Laboratory type, workload and methods used
In both rounds, the majority of participants were reference or academic laboratories. Three laboratories reported testing between 100 and 500 environmental samples per year while the other participants tested less than 100 samples. As with the clinical EQAP, participants used a range of DNA extraction protocols, PCR methods and amplification targets, including both in-house methods and commercial kits for DNA extraction and gel-based and real-time PCR for sequence detection. However, in both rounds, commercial kits were most commonly used for DNA extraction and real-time PCR targeting IS2404 (+/− other targets) was most commonly used for sequence detection. There was no correlation between participants’ performance and laboratory type, workload or method. The two panels retained by the coordinating laboratory and tested after all participants had submitted results yielded results consistent with the expected results (in most cases less than a 10-fold difference in detection of M. ulcerans DNA), demonstrating that any delay in testing was unlikely to have been a cause of discordant results (Table 3).
Discussion
The results of the two rounds of clinical and environmental EQAP indicated that there is a great variation between laboratories in the quality of molecular detection of M. ulcerans from clinical and environmental samples. Only 36% of the laboratories in the first round of the clinical EQAP and 31% in the second round had more than 90% concordant results. In both environmental rounds, however, at least half of respondents reported 100% concordant results. This discrepancy between the clinical and environmental EQAP could be explained by the fact that, in the environmental program, samples had a higher bacillary load and because the laboratories participating in the environmental EQAP were among the stronger ones in the clinical EQAP (87% and 90% concordant results in the first and second round respectively).
False positive results indicate problems of specificity and are suggestive of cross-contamination during DNA extraction or PCR most often due to carryover amplicon contaminations from previously amplified PCR products. This highlights the importance of the three-room PCR principle (where DNA extraction, mastermix preparation and template addition are separated) and reinforces the need for performing DNA extraction from clinical (particularly cultured isolates) and environmental samples in separate areas with dedicated reagents and equipment. The false negative results may be due to poor DNA extraction efficiency, low PCR sensitivity and/or PCR inhibition.
Among the nine laboratories with discordant results during the first clinical EQAP, four had both false positive and false negative results indicating both problems of sensitivity and specificity of their DNA extraction and/or PCR assay. The laboratories with few concordant results all had low intra-laboratory reproducibility indicating that their false results were probably due to mistakes in manipulations rather than to the techniques used. This impression was reinforced by the observation that every extraction method and PCR assay showed great variations in concordant results. Moreover, reference laboratories had more concordant results than academic and hospital laboratories, again suggesting that the variation was most probably due to laboratory performance.
In the second round of the clinical EQAP five laboratories had an intra-laboratory reproducibility of more than 90% with three of them processing more than 100 clinical specimens in 2010. Among the laboratories with false results, a majority of 13 had false negatives indicating problems with the sensitivity of DNA extraction and/or PCR assay. Six of these laboratories had intra-laboratory reproducibilities over 90% indicating that their false results were due to the techniques in use rather than to manipulation errors.
Indeed, the two laboratories with the lowest number of concordant results (lab05 and lab15) did have high intra-laboratory reproducibilities. Moreover, they reported no false positive results suggesting that the low sensitivity was probably due to a problematic PCR assay rather than manipulation errors. They both indeed did not detect less than 29×10−5 ng/µl DNA.
For most laboratories the limited sensitivity of molecular detection was probably due to a weak detection by the PCR assay as demonstrated in Fig 3. Five laboratories detected DNA dilutions up to 29×10−6 ng/µl only and also reported several false negative results among the set of specimen suspensions. Among the laboratories that detected 29.10−7 ng/µl DNA some still reported several false negative suspensions indicating the use of an insufficiently sensitive DNA extraction method. Manipulation errors may also explain the combination of false positive results and a low intra-laboratory reproducibility (lab02, lab23 and lab28).
More laboratories participated in the second round of the clinical EQA program (11 in 1st vs. 18 in 2nd round) and the median proportion of concordant results increased (from 82% to 88%). Also the median inter- and intra-laboratory reproducibilities increased respectively from 90% to 94% by sample and from 88% to 94% by laboratory. The number of laboratories reporting false positive results reduced from 64% to 38% while the number reporting false negative results increased from 55% to 81%, suggesting that the set of specimen suspensions distributed in the second round included some difficult ones/weak positives, challenging the detection limit of the PCR assays used. Eight laboratories participated in both rounds. Four laboratories performed better in the second round while three performed worse. One laboratory twice reported 100% concordant results. One of the laboratories that performed worse in round 2 (coded lab08 in round 1 and lab05 in round 2) reported results with a reduced concordance but a higher intra-laboratory reproducibility (Table 3). This laboratory reported many false negatives and did not detect more than 29×10−5 ng/µl M. ulcerans DNA indicating that solving the PCR sensitivity problem will probably increase the number of concordant results compared with the 1st round. In a repeated quality control study for the molecular detection of M. tuberculosis, improved performance was observed as well [15], [16].
Three of the eight laboratories that participated twice in the clinical EQA program used a different method for either DNA extraction (a commercial instead of an in-house method) or amplification (qPCR instead of a single run and nested conventional PCR assay). The laboratory that changed to a commercial DNA extraction method slightly increased its performance with less false positive but an increase in false negatives. Both laboratories that changed to real-time PCR as their amplification method had reduced performances with more false positives as well as false negatives. This could be due to those laboratories not being acquainted yet with the newly implemented technique.
Both in the clinical and environmental EQAP the laboratories’ performances did not correlate with the methodologies used for DNA extraction and amplification. It is therefore not possible, based on the results presented here, to make any recommendations on methodologies. Comparisons of different methods for the molecular detection of M. ulcerans in clinical and environmental specimens have been described previously [20], [22], [25].
Of the five laboratories with false results in either the first or second round of the environmental EQAP, two reported false positive results, two reported false negative results and one reported both false positive and false negative results. In the second round, the three positive samples that were incorrectly reported as negative by at least two laboratories were the types of samples that typically contain PCR inhibitors (faeces and soil). The fact that one of these samples had an IS2404-Ct value of 22.19 (the strongest positive sample in the panel) and that these laboratories correctly detected M. ulcerans DNA in the water sample that had a IS2404-Ct value of 36.19 (the weakest positive sample in the panel), suggests that these false negative results were due to inhibition (although none was reported by participants) rather than low sensitivity of their DNA extraction or PCR assay. These results highlight the importance of including internal positive controls in every reaction to test for inhibition and the challenge of optimizing DNA extraction protocols and PCR assays to reduce inhibition without compromising sensitivity.
Implications of the false positive and false negative results of respondent laboratories may be that (i) patients suffering from illnesses other than BU receive inappropriate treatment; (ii) patients with BU are erroneously considered as suffering from other illnesses; (iii) epidemiological data on BU are unreliable; (iv) conclusions drawn from clinical as well as environmental studies are doubtful; (v) researchers pursue or abandon lines of research on the basis of incorrect environmental results, which hampers efforts to elucidate the mode of transmission and environmental reservoir of M. ulcerans; and (vi) PCR as a single confirmatory test is insufficient for laboratories with weak EQA results (<90% concordant results).
We therefore recommend that: (i) these quality assessment programmes are continued on a regular basis; (ii) laboratories investigate the areas for improving their performance; (iii) laboratories implement rigorous internal quality control procedures (with e.g. the inclusion of (weak) positive and negative controls in every DNA extraction batch and PCR run as well as the inclusion of an internal positive control in every reaction); and (iv) the diagnosis of BU by microscopy is reinforced. Two-thirds of PCR positive specimens can be confirmed by direct smear examination [8], [9], [26], [27]. Direct smear examination is a cheap and fast diagnostic method that can be applied easily in BU endemic areas without the need for expensive and sophisticated equipment [28], [29]. Moreover, in most BU endemic countries systems are in place to control the quality of direct smear examination by national tuberculosis programs, and the periodic (e.g. quarterly) correlation of smear microscopy results with PCR results can serve as an additional internal control to detect problems with the molecular diagnosis of M. ulcerans.
Acknowledgments
We sincerely thank the following participating laboratories for their participation in the EQAP: Sushil Pandey, Mycobacterium Reference Laboratory, Queensland, Australia‡; Tim Stinear, University of Melbourne, Melbourne, Australia; Dissou Affolabi, Mycobacterium Reference Laboratory, Cotonou, Benin‡; Sarah Eyangoh, Centre Pasteur, Yaoundé, Cameroon‡; Fanny Minime-Lingoupou, Pasteur Institute, Bangui, Central African Republic‡; Solange Kakou Ngazoa, Pasteur Institute, Abidjan, Ivory Coast‡; Anatole Kibadi Kapay, Institut National de Recherche Biomédicale, Kinshasa, Democratic Republic Congo‡; Laurent Marsollier, Université et Centre Hospitalier Universitaire d’Angers, Angers, France‡; Anne-Sophie Drogoul, Pasteur Institute, Cayenne, French Guyana‡; Gisela Bretzel, Department of Infectious Diseases and Tropical Medicine, Ludwig-Maximilians University, University Hospital, Munich, Germany‡; Dorothy Yeboah-Manu and Anthony Ablordey, Noguchi Memorial Institute for Medical Research, Accra, Ghana‡; Richard Phillips, Kumasi Center for Collaborative Research, Kumasi, Ghana‡; Richard Phillips, Komfo Anokye Teaching Hospital, Kumasi, Ghana‡; Elisa Zavattaro, University of Eastern Piedmont, Novara, Italy; Kazue Nakanaga, Leprosy Research Center, National Institute of Infectious Diseases, Tokyo, Japan‡; Gerd Pluschke, Swiss Tropical and Public Health Institute, Basel, Switzerland‡; Abiba Banla-Kere, Institut National d’Hygiène, Lomé, Togo‡; Heather Williamson, University of Tennessee, Knoxville, Tennessee, USA.
‡Also member of WHO Buruli Ulcer Laboratory Network Working Group
Funding Statement
This work was supported by the Global Buruli Ulcer Initiative of the World Health Organization, the Stop Buruli Initiative funded by the UBS Optimus Foundation (Zurich, Switzerland) and by the European Commission (project HEALTH-F3-2010-241500-BuruliVac). C.L. was supported by a Victorian Government Department of Public Health Grant. The funders had no role in study design, data collection and analysis, decision to publish, or preparation of the manuscript.
References
- 1. Ross BC, Marino L, Oppedisano F, Edwards R, Robins-Browne RM, et al. (1997) Development of a PCR assay for rapid diagnosis of Mycobacterium ulcerans infection. J Clin Microbiol 35: 1696–1700. [DOI] [PMC free article] [PubMed] [Google Scholar]
- 2. Ross BC, Johnson PD, Oppedisano F, Marino L, Sievers A, et al. (1997) Detection of Mycobacterium ulcerans in environmental samples during an outbreak of ulcerative disease. Appl Environ Microbiol 63: 4135–4138. [DOI] [PMC free article] [PubMed] [Google Scholar]
- 3. De Beenhouwer H, Zhong L, de Rijk P, van Eekeren C, Portaels F (1995) Detection and identification of mycobacteria by DNA amplification and oligo specific capture plate hybridization. J Clin Microbiol 33: 2994–2998. [DOI] [PMC free article] [PubMed] [Google Scholar]
- 4. Portaels F, Silva MT, Meyers WM (2009) Buruli ulcer. Clin Dermatol 27: 291–305 S0738–081X(08)00201–0 [pii]; 10.1016/j.clindermatol.2008.09.021 [doi] [DOI] [PubMed] [Google Scholar]
- 5. Walsh DS, Portaels F, Meyers WM (2011) Buruli ulcer: Advances in understanding Mycobacterium ulcerans infection. Dermatol Clin 29: 1–8 S0733–8635(10)00178–6 [pii]; 10.1016/j.det.2010.09.006 [doi]. [DOI] [PubMed] [Google Scholar]
- 6.van der Werf TS, Stienstra Y, Johnson RC, Phillips R, Adjei O, et al. (2005) Mycobacterium ulcerans disease. Bull WHO 83: 785–791. S0042–96862005001000016 [pii];/S0042–96862005001000016 [doi]. [PMC free article] [PubMed]
- 7. Beissner M, Herbinger KH, Bretzel G (2010) Laboratory diagnosis of Buruli ulcer disease. Future Microbiol 5: 363–370 10.2217/fmb.10.3 [doi]. [DOI] [PubMed] [Google Scholar]
- 8. Eddyani M, Debacker M, Martin A, Aguiar J, Johnson RC, et al. (2008) Primary culture of Mycobacterium ulcerans from human tissue specimens after storage in semisolid transport medium. J Clin Microbiol 46: 69–72 JCM.00301–07 [pii];– 10.1128/JCM.0030107 [doi]. [DOI] [PMC free article] [PubMed] [Google Scholar]
- 9. Herbinger KH, Adjei O, Awua-Boateng NY, Nienhuis WA, Kunaa L, et al. (2009) Comparative study of the sensitivity of different diagnostic methods for the laboratory diagnosis of Buruli ulcer disease. Clin Inf Dis 48: 1055–1064 10.1086/597398 [doi]. [DOI] [PubMed] [Google Scholar]
- 10. Yeboah-Manu D, Bodmer T, Mensah-Quainoo E, Owusu S, Ofori-Adjei D, et al. (2004) Evaluation of decontamination methods and growth media for primary isolation of Mycobacterium ulcerans from surgical specimens. J Clin Microbiol 42: 5875–5876. [DOI] [PMC free article] [PubMed] [Google Scholar]
- 11. Portaels F, Meyers WM, Ablordey A, Castro AG, Chemlal K, et al. (2008) First cultivation and characterization of Mycobacterium ulcerans from the environment. PLoS Negl Trop Dis 2: 1–12. [DOI] [PMC free article] [PubMed] [Google Scholar]
- 12. Portaels F, Chemlal K, Elsen P, Johnson PDR, Hayman JA, et al. (2001) Mycobacterium ulcerans in wild animals. Rev Sci Tech Off Int Epiz 20: 252–264. [DOI] [PubMed] [Google Scholar]
- 13. Merritt RW, Walker ED, Small PL, Wallace JR, Johnson PD, et al. (2010) Ecology and transmission of Buruli ulcer disease: a systematic review. PLoS Negl Trop Dis 4: e911 10.1371/journal.pntd.0000911 [doi]. [DOI] [PMC free article] [PubMed] [Google Scholar]
- 14. Fyfe JAM, Lavender CJ, Johnson PDR, Globan M, Sievers A, et al. (2007) Development and application of two multiplex real-time PCR assays for the detection of Mycobacterium ulcerans in clinical and environmental samples. Appl Environ Microbiol 73: 4733–4740. [DOI] [PMC free article] [PubMed] [Google Scholar]
- 15. Noordhoek GT, van Embden JDA, Kolk AHJ (1996) Reliability of nucleic acid amplification for detection of Mycobacterium tuberculosis: an international collaborative quality control study among 30 laboratories. J Clin Microbiol 34: 2522–2525. [DOI] [PMC free article] [PubMed] [Google Scholar]
- 16. Noordhoek GT, Mulder S, Wallace P, Van Loon AM (2004) Multicentre quality control study for detection of Mycobacterium tuberculosis in clinical samples by nucleic amplification methods. Clin Microbiol Infect Dis 10: 295–301. [DOI] [PubMed] [Google Scholar]
- 17. Valentine-Thon E, Van Loon AM, Schirm J, Reid J, Klapper PE, et al. (2001) European proficiency testing program for molecular detection and quantitation of hepatitis B virus DNA. J Clin Microbiol 39: 4407–4412 – 10.1128/JCM.39.12.44074412.2001 [doi]. [DOI] [PMC free article] [PubMed] [Google Scholar]
- 18.Trouet C (2004) Annex No. 1: Law of May 7, 2004 concerning experiments on the human person. In: Clinical trials in Belgium. Antwerp - Oxford: Intersentia. 192–210.
- 19. Fyfe JA, Lavender CJ, Handasyde KA, Legione AR, O’Brien CR, et al. (2010) A major role for mammals in the ecology of Mycobacterium ulcerans . PLoS Negl Trop Dis 4: e791 10.1371/journal.pntd.0000791 [doi]. [DOI] [PMC free article] [PubMed] [Google Scholar]
- 20. Durnez L, Stragier P, Roebben K, Ablordey A, Leirs H, et al. (2009) A comparison of DNA extraction procedures for the detection of Mycobacterium ulcerans, the causative agent of Buruli ulcer, in clinical and environmental specimens. J Microbiol Methods 76: 152–158 S0167–7012(08)00353–9 [pii]; 10.1016/j.mimet.2008.10.002 [doi]. [DOI] [PubMed] [Google Scholar]
- 21. Guimaraes-Peres A, Portaels F, de Rijk P, Fissette K, Pattyn SR, et al. (1999) Comparison of two PCRs for detection of Mycobacterium ulcerans . J Clin Microbiol 37: 206–208. [DOI] [PMC free article] [PubMed] [Google Scholar]
- 22. Siegmund V, Adjei O, Racz P, Berberich C, Klutse E, et al. (2005) Dry-reagent-based PCR as a novel tool for laboratory confirmation of clinically diagnosed Mycobacterium ulcerans-associated disease in areas in the tropics where M. ulcerans is endemic. J Clin Microbiol 43: 271–276 43/1/271 [pii];– 10.1128/JCM.43.1.271276.2005 [doi]. [DOI] [PMC free article] [PubMed] [Google Scholar]
- 23.World Health Organization (2001) Buruli ulcer. Diagnosis of Mycobacterium ulcerans disease. A manual for health care providers. WHO/CDS/GPE/GBUI/2001.4. Geneva, Switzerland: World Health Organization.
- 24. Williamson HR, Benbow ME, Nguyen KD, Beachboard DC, Kimpbirauskas RK, et al. (2008) Distribution of Mycobacterium ulcerans in Buruli ulcer endemic and non-endemic aquatic sites in Ghana. PLoS Negl Trop Dis 2 (3): 1–14. [DOI] [PMC free article] [PubMed] [Google Scholar]
- 25. Affolabi D, Sanoussi N, Vandelannoote K, Odoun M, Faihun F, et al. (2012) Effects of decontamination, DNA extraction, and amplification procedures on the molecular diagnosis of Mycobacterium ulcerans disease (Buruli ulcer). J Clin Microbiol 50: 1195–1198 JCM.05592–11 [pii];– 10.1128/JCM.0559211 [doi]. [DOI] [PMC free article] [PubMed] [Google Scholar]
- 26. Yeboah-Manu D, Danso E, Ampah K, Asante-Poku A, Nakobu Z, et al. (2011) Isolation of Mycobacterium ulcerans from swab and fine-needle-aspiration specimens. J Clin Microbiol 49: 1997–1999 JCM.02279–10 [pii];– 10.1128/JCM.0227910 [doi]. [DOI] [PMC free article] [PubMed] [Google Scholar]
- 27. Kibadi K, Boelaert M, Fraga AG, Kayinua M, Longatto-Filho A, et al. (2010) Response to treatment in a prospective cohort of patients with large ulcerated lesions suspected to be Buruli ulcer (Mycobacterium ulcerans disease). PLoS Negl Trop Dis 4: e736 10.1371/journal.pntd.0000736 [doi]. [DOI] [PMC free article] [PubMed] [Google Scholar]
- 28. Yeboah-Manu D, Asante-Poku A, Asan-Ampah K, Ampadu ED, Pluschke G (2011) Combining PCR with microscopy to reduce costs of laboratory diagnosis of Buruli ulcer. Am J Trop Med Hyg 85: 900–904 85/5/900 [pii];– 10.4269/ajtmh.2011.110362 [doi]. [DOI] [PMC free article] [PubMed] [Google Scholar]
- 29.Affolabi D (2009) Dissertation for the degree of doctor in Biomedial Sciences: Development of simple and inexpensive tools for the control of mycobacterial diseases in a low-resource country. University of Antwerp.