

Abstract
GPR6 is a constitutively active Gs-coupled receptor that can signal from intracellular compartments. We present different methods used to study cell surface expression of receptors and other membrane proteins. A comparison of these methods shows that methods based on susceptibility to proteolytic enzymes are more efficient at providing estimates of cell surface expression than the commonly used cell-surface biotinylation method. We also present different methods that can be used to detect constitutive activity of Gs-coupled receptors. Imaging based assays to detect intracellular cyclic AMP accumulation are well suited to study signaling at a single cell level. These assays are particularly useful when the cells of interest form a small fraction of the culture such as primary cultures with low transfection efficiency.
Introduction
GPR6 belongs to a family of constitutively active Gs-coupled G protein coupled receptors (GPCRs) that also includes GPR3 and GPR12 (Song et al. 1994). Depending on the anatomical location of their expression, these receptors are involved in a wide array of functions such as neurite growth, amyloid processing, appetitive learning behavior and meiotic arrest of oocytes (Tanaka et al., 2007; Thathiah et al., 2009; Lobo et al., 2007; Mehlman et al., 2004). The diverse functions of this family of receptors appear to be mediated by their constitutive activity and their ability to maintain elevated intracellular cyclic AMP concentration. The relative magnitude of their constitutive activity was reported to be the highest among all G-protein coupled receptors (Eggerickx et al. 1995; Seifert and Wenzel-Seifert, 2002). Although their constitutive activity was recognized more than a decade ago, very little information is available on the ligands and signaling mechanisms of these receptors. Sphingosine-1-phosphate was reported to be the endogenous agonist of GPR6, based on the finding that intracellular calcium concentrations were elevated by S1P in GPR6 expressing cells (Uhlenbrock et al., 2002; Ignatov et al., 2003). However, several recent observations do not support the notion that sphingosine-1-phosphate is an agonist of GPR6 (Yin et al., 2009; BM Prasad, unpublished data) and it can still be considered an orphan receptor. Given the importance of GPR6 family members in different functions in health and disease, identification of their ligands and understanding of their downstream signaling mechanisms are of keen interest.
As an initial approach to develop tools and to study signaling by GPR6 family members we investigated the cellular localization of GPR6. Despite its constitutive activity, GPR6 appears to be predominantly located in intracellular compartments. Gs-coupled receptors that can signal from intracellular compartments is an emerging concept and may eventually expand our understanding of compartmentalization of GPCR-mediated signaling (Calebiro et al., 2009; Jalink and Moolenaar, 2010). Different methods used to measure cell surface expression and cAMP concentrations vary in their sensitivity and utility. We describe some of the available methods to study cell surface expression and Gs-mediated constitutive activity of heterologously expressed G-protein coupled receptors.
GPR6 is expressed in intracellular compartments
The first indication that GPR6 may be expressed in intracellular compartments was provided by imaging experiments in which GFP-tagged GPR6 was found predominantly between plasma membrane markers and nuclei. Alexa Fluor 594 conjugated wheat germ agglutinin (WGA) is cell impermeant and binds to N-acetyl glucosamine and N-acetyl neuraminic acid moieties of cell surface proteins. Hoechst 33342 is a cell-permeant compound that binds to nucleic acids. These two compounds are used to label plasma membranes and nuclei of live cells, respectively. HEK 293 cells expressing GPR6 or dopamine (D1) receptors were labeled with WGA and Hoechst 33342 (obtained from Invitrogen, Carlsbad, CA, USA). As shown in Figure 1, D1 receptor, a Gs-coupled receptor known to be expressed on the plasma membrane, is co-localized with WGA. On the other hand GPR6 appears to be located in between WGA and Hoechst 33342 stains. Any attempts to measure the relative expression of receptors on the cell surface by fluorescence intensities and degree of co-localization would be hampered by the limited spatial resolution of light microscopy. Indeed, quantitative measures of co-localization were not useful in determining cell-surface expression because of diffuse nature of WGA labeling. In order to obtain more accurate measurements of cell surface expression of receptors, we used different methods described below.
Figure 1. GPR6 appears to be predominantly located in the intracellular compartments.

HEK293 cells expressing GFP-tagged GPR6 or D1 receptors were labeled with WGA (plasma membrane marker) and Hoechst 33342 (nuclear stain). These images show that D1 receptor is primarily located along the plasma membrane, while GPR6 fluorescence is mostly located between plasma membrane and nuclei.
A. Methods of detecting cell surface expression of GPCRs
A1. Cell surface biotinylation
Biotinylation of cell surface proteins with amine-reactive compounds is a commonly used technique to label cell surface proteins which can then be separated and quantified. Sulfo NHS-SS biotin, which is frequently used for this purpose, is a membrane impermeant compound that reacts with amino groups of extracellular lysine side chains in proteins. We used sulfo NHS-SS biotin to label cell surface proteins and measure the relative abundance of pHluorin-tagged GPR6 (pHGPR6) and D1R (pHD1) on the cell surface. As will be evident later in this chapter, the pHluorin tag at the N-terminus will be used to measure cell surface expression of GPR6 in different assays. Super ecliptic pHluorin is a pH sensitive variant of GFP (pKa ~ 7.1) which can easily be detected by commercially available GFP antibodies (Sankaranarayanan et al., 2000).
Methods
24-well tissue culture plates were coated with 100 ug/ml poly-D-lysine. HEK293 cells obtained from ATCC were seeded at a density of 200,000 cells per well. A day after plating, cells were transfected with pHGPR6 or pHD1 (0.3 μg / well using lipofectamine 2000 reagent, Invitrogen). Two days after transfection, cells were washed once with PBS and labeled with 1.5 mg/ml freshly-prepared sulfo NHS-SS biotin (Thermo Scientific, Rockford, IL, USA). Biotinylation was performed at 4°C for 30 minutes in alkaline PBS (pH 8.5). Biotinylation reagent was quenched by two washes of 100 mM glycine buffer (5 minutes per wash). Cultures were extracted with 500 μl radio immunoprecipitation assay (RIPA) buffer and incubated with 100 μl neutravidin agarose beads overnight at 4°C with end over end mixing. Supernatant was separated from neutravidin beads by centrifugation and saved to assay for unbiotinylated proteins that represent the intracellular protein fraction. Beads were washed four times with RIPA buffer (1.0 ml per wash) and biotinylated proteins were eluted with 50 μl sample buffer with 50 mM dithiothreitol. Western blots with 25 μl of the biotinylated sample and 25 μl of supernatant were probed with horse radish peroxidase conjugated GFP antibody (Invitrogen). Densitometric values of bands corresponding to GPR6 and D1 receptors were analyzed using NIH imageJ.
Results
Data in Figure 2 show that cell surface proteins can be selectively labeled, separated and quantitated. Measurement of GPR6 and D1-receptor abundance in biotin labeled and supernatant fractions show that approximately 12% of D1-receptor is expressed on the cell surface while GPR6 is undetectable at the surface. It is worth noting that the band intensities corresponding to biotinylated and supernatant fractions of D1 receptor in Figure 2 and most biotinylated studies reported in the literature, are somewhat similar. However, when the fraction of these samples loaded in western blot analysis (25/50 μl for biotinylated and 25/500 μl for supernatant) are taken into account, the densitometric values of biotinylated sample are small compared to those of supernatant (Figure 2C). Based on the staining pattern observed in Figure 1, 12% appears to be an underestimation of true fraction of surface expression of D1 receptor. Thus, we used alternative assays described below to determine cell surface expression.
Figure 2. GPR6 is not detected at the cell surface by biotinylation assay.

A. Schematic representation of cell surface biotinylation assay. `B' represents biotin and `AV' represents neutravidin bound to agarose bead.
B. Representative blots pHD1 and GPR6 in biotinylation assay.
C. Densitometric analysis of bands corresponding to biotinylated (cell surface) and supernatant (intracellular) samples are presented. The densitometric values have been adjusted for differential loading of biotinylated (50%) and supernatant (5%) samples on the gel. n = 4.
A2. Susceptibility to chymotrypsin treatment
Chymotrypsin, an endoprotease secreted by pancreas, cleaves proteins at aromatic amino acid residues (tyrosine, tryptophan or phenylalanine). Brief exposure to this enzyme can be used to cleave cell surface proteins without dislodging cells from the culture dish. This enzyme is relatively large (~ 25 kDa) and does not have access to intracellular proteins of intact cells. We found that a pHlourin tag at the N-terminus of cell surface GPCRs is cleaved within a few seconds of exposure to chymotrypsin (see Figure 4). The cleavage of pHluorin tag could thus be used as a readout for detection and quantification of receptors on the cell surface.
Figure 4. Surface expression of GPR6 could not be detected in striatal neurons by proton or chymotrypsin accessibility.

A. Representative fluorescence images of neurons expressing pHGPR6 in control, pH 6.0, 0.3 mg/ml chymotrypsin buffers.
B. Representative fluorescence images of pHD1 receptor in different buffers.
C. Normalized fluorescence intensities of pHGPR6 or pHD1 receptors are presented.
D. Average effects of pH 6.0 and chymotrypsin buffers on fluorescence of pHGPR6 and pHD1 receptors. * Significantly different from control buffer values (P < 0.01, n = 4).
Reproduced with permission from Padmanabhan et al. (2009)
Methods
HEK 293 cells were plated and transfected with pHGPR6 or pHD1 as described above. After one wash in PBS, cells were treated with 0.3 mg/ml of chymotrypsin (40 units/mg) for 5 minutes. Following two gentle washes in PBS, cells were extracted in RIPA buffer. In each experiment, cells without chymotrypsin treatment served as control to determine total amount of receptor. Western blots of lysates were probed with GFP antibody. Densitometric values of bands corresponding to total and chymotrypsin resistant samples were analyzed.
Results
Data in Figure 3 show that 71% of D1 receptors are present on the cell surface, while GPR6 is not susceptible to chymotrypsin treatment. This latter fact also demonstrates that residual enzyme activity in cell lysates is not responsible for increased sensitivity of chymotrypsin susceptibility method over the cell surface biotinylation assay.
Figure 3. GPR6 is not detected at the cell surface chymotrypsin sensitivity assay.

A. Schematic representation of chymotrypsin sensitivity assay.
B. Representative blots pHD1 and GPR6 treated with (CT-resistant) or without (Total) 0.3 mg/ml chymotrypsin.
C. Densitometric analysis of bands corresponding to total and chymotrypsin resistant fraction are shown. n = 4.
A3. Imaging based assays for cell surface expression
Although the data presented above show that GPR6 is located in the intracellular compartments of HEK293 cells, it is important to determine the expression pattern of GPR6 in neurons where it is normally expressed. It is conceivable that a missing subunit or chaperone of GPR6 is required for its surface expression in heterologous expression systems. We next assessed expression of GPR6 in neurons that are likely to have these putative GPR6 associated proteins. However, low transfection efficiency of GPR6 in neurons precluded us from using either of the above two methods. We resorted to imaging based analysis of surface expression in individual cells that are transfected with pHGPR6 or pHD1. This assay takes advantage of the pH- and chymotrypsin-sensitivities of extracellular pHluorin.
Methods
Striatal neurons were obtained from post-natal day 2–4 rat pups. After enzymatic dissociation in 20 units/ml papain solution, cells were plated on glass coverslips coated with 100 μg /ml poly-D-lysine and 5 μg/ml laminin. Neuronal medium conditioned over glia was used to maintain the cultures as previously described (Padmanabhan et al., 2008). Neurons were transfected with 0.4 μg DNA constructs using the calcium phosphate method. Live cell images of transfected cells were obtained using laser scanning confocal microscope (Carl-Zeiss, Thornwood, NY, USA) using 488 nM excitation wavelength and 500–550 nm emission filter. Images were acquired at the rate of 1 per second under continuous perfusion of control buffer (pH 7.4). Change in fluorescence caused by brief application of pH 6.0 buffer or 0.3 mg/ml chymotrypsin was measured. Analysis of fluorescence changes caused by these two treatments will be referred to as pH-imaging and chymotrypsin-imaging, respectively.
Results
Brief exposure to pH 6.0 buffer caused a reversible decrease in pHD1 fluorescence of greater than 90% (Figure 4). Chymotrypsin caused an irreversible decrease in fluorescence of comparable magnitude due to cleavage of the fluorophore on pHD1. Neither treatment caused a decrease in fluorescence of pHGPR6. Bright field images in Figure 4 show that chymotrypsin treatment did not dislodge cells from glass coverslip. These data show that about 90% of pHD1 receptor is present on the cell surface, while pHGPR6 is predominantly located in the intracellular compartment of neurons.
A4. Antibody labeling assay for cell surface expression
Internalization of G-protein coupled receptors after being activated is one of the important mechanisms of receptor desensitization and subsequent down regulation (Ferguson, 2001). It is conceivable that, because of its high constitutive activity, GPR6 is continuously internalized and recycled to the surface. A small portion of GPR6 that is present on the cell surface may not be detected under the experimental conditions of the above three assays. Thus, we used an antibody labeling assay to determine if a small fraction of GPR6 is expressed at the cell surface and is being recycled. A high affinity GFP antibody is likely to bind all GPR6 receptors that are at the cell surface at any point during the period of antibody incubation. Furthermore the antibody can be labeled with fluorophores that have significantly greater quantum yield (brightness) than pHluorin, increasing the sensitivity of detection.
Methods
Transfected HEK 293 cells were incubated with Alexa Fluor-594 conjugated polyclonal GFP antibody (10 μg/ml, Invitrogen) for 15 minutes at 37°C. Z-stack images of cells were collected using 1.5 μm optical sections with 0.73 μm intervals, after washing out the labeling antibody. pHluorin was imaged with settings described above, while GFP antibody was imaged with 543 nm excitation wavelength and 590–720 nm emission filter. Fluorescence intensities were measured after the Z-stack images were compressed to obtain a projection image.
Results
A comparison of fluorescence intensities of GFP antibody and pHluorin of cells expressing pHD1 receptors showed that antibody labeling is substantially more sensitive in detecting pHD1 receptors. Antibody labeling was clearly evident in cells where pHluorin fluorescence was below the limit of detection. Direct comparison of these two fluorescence intensities and minimum detectable pHluorin fluorescence of pHD1 (Figure 5B) indicate that antibody labeling should have detected GPR6 even if less than 3% of total GPR6 is expressed on the surface. However, none of the pHGPR6 cells showed any antibody labeling, further demonstrating that GPR6 is located in intracellular compartments. Similar results were also obtained in antibody labeling of neurons expressing pHGPR6 (Padmanabhan et al., 2009).
Figure 5. Surface expression of GPR6 in HEK293 cells was not detected by antibody labeling.

A. Compressed images constructed from Z-stacks of pHluorin fluorescence pictures of pHGPR6 or pHD1 are shown in green. Staining of the same cells with GFP antibody is shown in red.
B. pHluorin fluorescence intensities of individual cells expressing pHD1 are plotted against corresponding GFP antibody fluorescence values. Fluorescence data points corresponding to the three cells labeled in A are indicated by a, b and c. The slope (4.7) and intercept (11906) of linear regression line provide a measure of the sensitivity of this assay (R2 = 0.78). None of the pHGPR6 expressing cells has any detectable antibody staining and are not shown in this graph.
Reproduced with permission from Padmanabhan et al. (2009)
Comparison of the cell surface protein detection methods
As is evident from the data presented above, different techniques have different efficiency, sensitivity and utility to detect cell surface expression of membrane proteins. Of the different techniques used, the imaging based chymotrypsin and proton susceptibility methods showed best efficiency in detecting cell surface expression of D1 receptors. Thus, chymotrypsin sensitivity in imaging experiments was used as a bench mark (100% efficiency) to express relative efficiency to detect cell surface expression of pHD1 by different methods. In order to provide a reasonable comparison of different techniques, only data from HEK293 cells transfected with pHD1 receptors were used (Figures 2, 3, 5 and imaging data in HEK293 cells from Padmanabhan et al., 2009). Data in Table 1 show that cell surface biotinylation assay is only 15% as efficient as chymotrypsin-imaging assay. Similar low biotinylation efficiencies for other surface proteins have been reported and several factors such as buffer pH, cell type, available extracellular lysines and membrane polarity influence biotinylation rates (Gottardi and Caplan, 1992). Chymotrypsin sensitivity analysis by western blots fared far better with 89% efficiency. Inherent differences in imaging and western analysis of proteins might be responsible for the small differences in chymotrypsin sensitivities of these two methods (89% Vs 100%). The efficiency of the antibody labeling experiment could not be determined as intracellular labeling with antibody was not measured.
Table I.
Comparison of cell surface expression assays
| Method | Efficiency | Sensitivity | Primary Cul. | Endogenous Rec. |
|---|---|---|---|---|
| Cell Surface Biotinylation | 12% | Low | No | Yes |
| Chymotrypsin | 89% | Moderate | No | Yes |
| Imaging | 100% | Moderate | Yes | No |
| Antibody Labeling | ND | High | Yes | Yes |
Efficiency is defined as ability to detect cell surface expression of D1 receptors relative to chymotrypsin-imaging technique.
Sensitivity is based on relative efficiencies of assays and detection limits of western blots and imaging analysis.
Primary Cul. refers to the adaptability of the technique for studying expressed receptors in primary cultures.
Endogenous Rec. refers to the utility of the technique for studying endogenous receptors.
The sensitivity of detecting cell surface proteins by these methods is dependent on the epitope (pHluorin) detection methods. Both cell surface biotinylation and chymotrypsin susceptibility methods depend on antibody labeling of proteins on membranes. However, presumably due to poor labeling of the cell surface proteins, the biotinylation technique has relatively low sensitivity. Among the imaging methods, the antibody labeling has better sensitivity to detect cell surface proteins. This is primarily due to high quantum yield (brightness) of the fluorophore attached to the GFP antibody. As evident from Figure 5B, GFP antibody fluorescence under our imaging conditions is several-fold higher than that of pHluorin fluorescence. Several cells that had barely detectable pHluorin fluorescence readily showed antibody fluorescence as indicated by the Y axis intercept of the correlation line in Figure 5B.
GPR6 is predominantly expressed in neurons in the striatum of brain (song et al., 1994; Lobo et al., 2007). Thus, it is important to study the expression and signaling mechanisms of this receptor in its native environment. Cell surface biotinylation and chymotrypsin susceptibility methods are not suitable for studying expressed GPR6 because of poor transfection efficiency in neuronal cultures. However, imaging and antibody labeling can be easily used to determine surface expression in individual neurons. Future research on signaling mechanisms of GPR6 is required to validate the conclusions drawn from cloned GPR6 expressed in HEK293 cells and neurons. All the methods described here, with the exception of imaging analysis are likely to be useful in measuring surface expression of endogenous GPR6 in neuronal cultures. pH and chymotrypsin sensitivities in imaging assays rely on the pHluorin tag and thus is not likely to be useful in studying endogenous receptors without special labeling tools. The other three methods could easily be adapted to studying endogenous receptors if selective GPCR antibodies are available. Obviously, the use of antibody labeling method for endogenous GPCR labeling would require an antibody that selectively binds extracellular epitopes of receptors.
B. Methods of detecting constitutive activity of GPR6
As outlined in the introduction, GPR6 is a constitutively active Gs-coupled receptor. Heterologous expression of this receptor in different cell types significantly increases intracellular cyclic AMP. We used three different assays to assess the Gs-mediated constitutive activity of GPR6.
B1. cAMP Enzyme immunoassay
Enzyme immunoassays are simple and widely-available assays that provide a direct measurement of cAMP in lysed cells. Constitutive activity of Gs-coupled receptors should be reflected in an elevated intracellular cAMP concentration, especially in the presence of a phosphodiesterase inhibitor.
Methods
HEK293 cells plated in 24-well plates were transfected with pHGPR6 or pHD1 receptors. D1 receptors were used as a control for a Gs-coupled receptor that does not have appreciable constitutive activity. Two days after transfection, cells were washed once with PBS and then incubated in presence of 100 μM R0 20-1724 (a phosphodiesterase inhibitor) for 30 minutes. Dopamine (1 μM) was added to cells expressing pHD1 to test the effect of D1 receptor activation on cAMP content. Cells were then extracted into 300 μl of 0.1 N HCl. Samples were neutralized and assayed for cAMP content using an enzyme immunoassay kit from Biomedical Technologies Inc. (Stoughton, MA, USA).
Results
cAMP content of cells expressing pHGPR6 is significantly greater than that of pHD1 expressing cells (Figure 6). As expected, dopamine application stimulated cAMP production in pHD1 cells. pHGPR6 cells but not pHD1 cells had significantly greater cAMP content than untransfected cells, demonstrating the constitutive activity of GPR6 in absence of exogenous ligands (Eggerickx et al., 1995; Padmanabhan et al., 2009).
Figure 6. Constitutive activity of GPR6 can be detected by cAMP enzyme immunoassay.
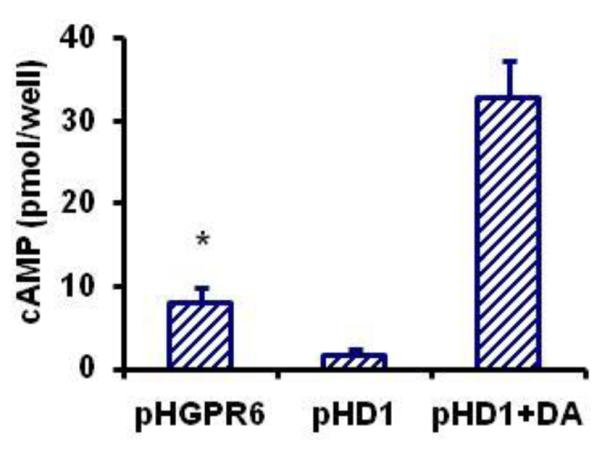
cAMP content of cultures expressing pHGPR6 or pHD1 are shown as mean ± SEM. pHD1+DA represents cultures treated with 1 μM dopamine. * Significantly different from the other two groups (P < 0.01, n = 4).
Reproduced with permission from Padmanabhan et al. (2009)
B2. Measurement of cAMP changes in live cells using bioluminescence resonance energy transfer (BRET)
In recent years several genetically-encoded indicators based on fluorescent and luminescent proteins have been developed for measurement of cAMP in living cells (Nikolaev and Lohse 2006). Probes based on intramolecular changes in fluorescence- and bioluminescence resonance energy transfer (FRET and BRET) make use of cAMP-binding domains, which are placed between FRET or BRET donors and acceptors. Binding of cAMP changes the distance between and orientation of donors and acceptors, thus producing changes in FRET or BRET. For studies in easily-transfected heterologous cells we used the BRET sensor CAMYEL (Jiang et al. 2007).
Methods
HEK293 cells plated in 6-well plates were transfected with GPR6 and CAMYEL (ATCC, Manassas, VA, USA). After 24 hours cells were washed once with PBS-EDTA, detached and resuspended in 0.9 ml of PBS. Suspended cells were distributed (200 μl per well) into black 96-well plates (Thermo Fisher Scientific Nunc, Rochester, NY, USA). Coelenterazine h (Nanolight, Pinetop, AZ, USA) was added to each well to a final concentration of 5 μM, and luminescence was measured using a multimode plate reader (Mithras LB940, Berthold, Bad Wildbad, Germany). The number of photons emitted at 535 nm divided by the number emitted at 480 nm was taken as the raw BRET ratio. This ratio decreases when cAMP binds to the CAMYEL indicator (Jiang et al. 2007).
Results
As shown in Figure 7, direct activation of adenylate cyclase with forskolin (10 μM) decreases CAMYEL BRET in untransfected cells, and this change is amplified by inhibiting phosphodiesterase activity with isobutylmethylxanthine (IBMX). Increasing the amount of GPR6 DNA transfected produces a graded increase in cAMP, as indicated by a graded decrease in BRET. Increases in cAMP induced by GPR6 expression were additive with those produced by forskolin. At the highest levels of GPR6 expression IBMX no longer decreased BRET signals in the presence of forskolin, suggesting possible saturation of the indicator (Kd=8.8 μM cAMP; Jiang et al. 2007).
Figure 7. Constitutive activity of GPR6 can be detected using BRET.
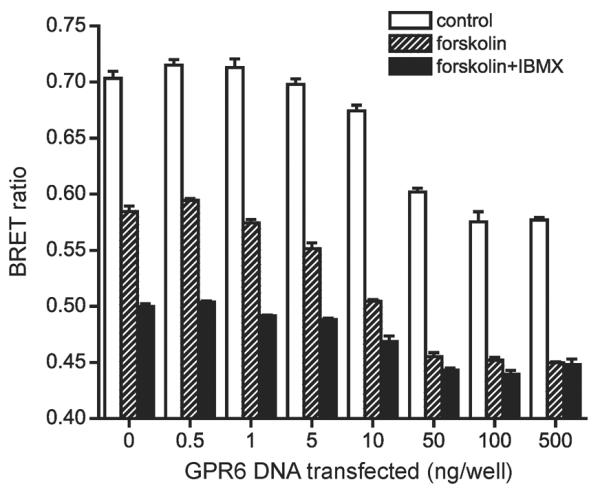
Raw BRET ratio is plotted against the amount of plasmid DNA encoding GPR6 used for transfection of each well of a 6-well plate. During detection cells were also incubated with either 10 μM forskolin or forskolin + isobutylmethylxanthine (IBMX). Decreases in the BRET ratio indicate increases in [cAMP]. All experiments were peformed in quadruplicate,
B3. Phospho-CREB activity as a readout of constitutive activity of GPR6
As with the cell surface expression assays, it is important to determine the constitutive activity of GPR6 in neurons where it is normally expressed. However, low transfection efficiency in neurons limited us from using cAMP EIA or BRET assays in primary cells. We thus used phospho-cyclic AMP response element-binding protein (pCREB) as a downstream surrogate indicator of elevated cAMP concentrations.
Methods
Neuronal cultures transfected with pHGPR6 or pHD1 were fixed by incubating in 4% paraformaldehyde for 15 minutes. After two washes in PBS, cells were permeabilized and blocked using a buffer containing 1% triton X-100, 4% normal goat serum and 1% bobine serum albumin. A rabbit pCREB antibody (1:1000, Millipore, Temecula, CA, USA) and Rhodamine Red-X conjugated anti rabbit secondary antibody were used to immunostain the cells. pCREB fluorescence intensities of neurons overexpressing receptor constructs were compared to neighboring untransfected neurons.
Results
pHGPR6 cells but not pHD1 cells has significantly greater pCREB staining intensity than untransfected neurons (Figure 8). These data illustrate that pCREB immunostaining could be used as a surrogate down-stream indicator for constitutive activity of a Gs-coupled receptor.
Figure 8. Constitutive activity of GPR6 in striatal neurons can be demonstrated by increase in CREB phosphorylation.

A. Representative confocal images of phospho-CREB immunostaining. Arrows indicate neurons transfected with pHGPR6 or pHD1.
B. Phospho-CREB fluorescence intensities of receptor transfected neurons are expressed as percent of untransfected controls. * Significantly different from controls (P < 0.01, n = 6).
Reproduced with permission from Padmanabhan et al. (2009)
Comparison of the constitutive Gs-activity detection methods
Of the three methods described here only the EIA and BRET assays are direct assays for cAMP, and thus capable of being calibrated to [cAMP]. Their sensitivity and dynamic range to detect cAMP depend on the cAMP antibody and reporter construct being used, respectively. In contrast, the pCREB assay is an indirect assay, and sensitivity can not be measured for comparison with the other two methods. On the other hand, because of poor transfection efficiency, the EIA and BRET assays could not be used in primary cultures to measure the constitutive activity of expressed or endogenous GPR6. FRET indicators similar to CAMYEL (Nikolaev and Lohse 2006) could be used for this purpose. Nevertheless, constitutive activity of expressed receptors could be easily detected using all three of these techniques. In the absence of suitable ligands it is more difficult to document constitive activity of endogenous GPR6 in native tissue. However, these methods could be used to measure cAMP in GPR6-expressing and GPR6-null animals (Lobo et al., 2007), which are available from the Jackson Laboratory (Bar harbor, ME, USA).
Conclusions
Different assays have varying efficiencies and sensitivities to detect cell surface expression of membrane proteins. Of the different methods we used, those based on the chymotrypsin sensitivity appear to be most reliable in providing accurate estimates of relative cell surface expression. For measuring constitutive activity of Gs-coupled receptors EIA or BRET assays are direct assays with good sensitivity. Development of GPR6 selective antibodies and different cAMP reported constructs targeted to subcellular compartments are likely to aid in studying constitutive signaling mechanisms of GPR6.
REFERENCES
- Calebiro D, Nikolaev VO, Gagliani MC, de Filippis T, Dees C, Tacchetti C, Persani L, Lohse MJ. Persistent cAMP-signals triggered by internalized G-protein-coupled receptors. PLoS Biol. 2009;7:e1000172. doi: 10.1371/journal.pbio.1000172. [DOI] [PMC free article] [PubMed] [Google Scholar]
- Eggerickx D, Denef JF, Labbe O, Hayashi Y, Refetoff S, Vassart G, Parmentier M, Libert F. Molecular cloning of an orphan G-protein coupled receptor that constitutively activates adenylate cyclase. Biochem. J. 1995;309:837–843. doi: 10.1042/bj3090837. [DOI] [PMC free article] [PubMed] [Google Scholar]
- Ferguson SS. Evolving concepts in G protein-coupled receptor endocytosis: the role in receptor desensitization and signaling. Pharmacol. Rev. 2001;53:1–24. [PubMed] [Google Scholar]
- Gottardi CJ, Caplan MJ. Cell surface biotinylation in the determination of epithelial membrane polarity. J. Tissue Culture Methods. 1992;14:173–180. [Google Scholar]
- Ignatov A, Lintzel J, Kreienkamp HJ, Schaller HC. Sphingosine 1-phosphate is a high-affinity ligand for the G-protein coupled receptor GPR6 from mouse and induces intracellular Ca2+ release by activating the sphingosine-kinase pathway. Biochem. Biophys. Res. Commun. 2003;311:329–336. doi: 10.1016/j.bbrc.2003.10.006. [DOI] [PubMed] [Google Scholar]
- Jalink K, Moolenaar WH. G protein-coupled receptors: the inside story. Bioessays. 2010;32:13–16. doi: 10.1002/bies.200900153. [DOI] [PubMed] [Google Scholar]
- Jiang LI, Collins J, Davis R, Lin K-M, DeCamp D, Roach T, Hsueh R, Rebres RA, Ross EM, Taussig R, Fraser I, Sternweis PC. Use of a cAMP BRET sensor to characterize a novel regulation of cAMP by the sphingosine 1-phosphate/G13 pathway. J. Biol. Chem. 2007;282:10576–10584. doi: 10.1074/jbc.M609695200. [DOI] [PMC free article] [PubMed] [Google Scholar]
- Lobo MK, Cui Y, Ostlund SB, Balleine BW, Yang XW. Genetic control of instrumental conditioning by striatopallidal neuron-specific S1P receptor GPR6. Nat. Neurosci. 2007;10:1395–1397. doi: 10.1038/nn1987. [DOI] [PubMed] [Google Scholar]
- Mehlmann LM, Saeki Y, Tanaka S, Brennan TJ, Evsikov AV, Pendola FL, Knowles BB, Eppig JJ, Jaffe LA. The Gs-linked receptor GPR3 maintains meiotic arrest in mammalian oocytes. Science. 2004;306:1947–1950. doi: 10.1126/science.1103974. [DOI] [PubMed] [Google Scholar]
- Nikolaev VO, Lohse MJ. Monitoring of cAMP synthesis and degradation in living cells. Physiology (Bethesda) 2006;21:86–92. doi: 10.1152/physiol.00057.2005. [DOI] [PubMed] [Google Scholar]
- Padmanabhan S, Lambert NA, Prasad BM. Activity-dependent regulation of the dopamine transporter is mediated by Ca(2+)/calmodulin-dependent protein kinase signaling. Eur. J. Neurosci. 2008;28:2017–2027. doi: 10.1111/j.1460-9568.2008.06496.x. [DOI] [PubMed] [Google Scholar]
- Padmanabhan S, Myers AG, Prasad BM. Constitutively active GPR6 is located in the intracellular compartments. FEBS Lett. 2009;583:107–112. doi: 10.1016/j.febslet.2008.11.033. [DOI] [PubMed] [Google Scholar]
- Sankaranarayanan S, De Angelis D, Rothman JE, Ryan TA. The use of pHluorins for optical measurements of presynaptic activity. Biophys. J. 2000;79:2199–2208. doi: 10.1016/S0006-3495(00)76468-X. [DOI] [PMC free article] [PubMed] [Google Scholar]
- Seifert R, Wenzel-Seifert K. Constitutive activity of G-protein-coupled receptors: cause of disease and common property of wild-type receptors. Naunyn Schmiedebergs Arch. Pharmacol. 2002;366:381–416. doi: 10.1007/s00210-002-0588-0. [DOI] [PubMed] [Google Scholar]
- Song ZH, Young WS, Brownstein MJ, Bonner TI. Molecular cloning of a novel candidate G protein-coupled receptor from rat brain. FEBS Lett. 1994;12:375–379. doi: 10.1016/0014-5793(94)00888-4. [DOI] [PubMed] [Google Scholar]
- Tanaka S, Ishii K, Kasai K, Yoon SO, Saeki YJ. Neural expression of G-protein coupled receptors GPR3, GPR6, and GPR12 up-regulates cyclic AMP levels and promotes neurite outgrowth. J. Biol. Chem. 2007;282:10506–10515. doi: 10.1074/jbc.M700911200. [DOI] [PubMed] [Google Scholar]
- Thathiah A, Spittaels K, Hoffmann M, Staes M, Cohen A, Horré K, Vanbrabant M, Coun F, Baekelandt V, Delacourte A, Fischer DF, Pollet D, De Strooper B, Merchiers P. The orphan G protein-coupled receptor 3 modulates amyloid-beta peptide generation in neurons. Science. 2009;323:946–951. doi: 10.1126/science.1160649. [DOI] [PubMed] [Google Scholar]
- Uhlenbrock K, Gassenhuber H, Kostenis E. Sphingosine 1-phosphate is a ligand of the human gpr3, gpr6 and gpr12 family of constitutively active G-protein coupled receptors. Cell Signal. 2002;14:941–953. doi: 10.1016/s0898-6568(02)00041-4. [DOI] [PubMed] [Google Scholar]
- Yin H, Chu A, Li W, Wang B, Shelton F, Otero F, Nguyen DG, Caldwell JS, Chen YA. Lipid G protein-coupled receptor ligand identification using beta-arrestin PathHunter assay. J Biol. Chem. 2009;284:12328–12338. doi: 10.1074/jbc.M806516200. [DOI] [PMC free article] [PubMed] [Google Scholar]