

Abstract
High-risk types of human papillomavirus (HPV) cause nearly all cases of cervical cancer. The E6 oncoprotein is produced as a full-length variant (E6) as well as several shorter isoforms (E6*). E6* inhibits certain oncogenic activities of E6, suggesting that it might play an anti-oncogenic role in vivo. To test this, we created E6*-expressing SiHa (HPV+) and C33A (HPV−) cells, then examined the ability of both the parental and E6*-expressing cells to form tumors in nude mice. We found that over-expression of E6* indeed decreased the growth of tumors derived from both SiHa and C33A cells, with the reduction greatest in tumors derived from E6*-expressing SiHa cells. These findings point to multiple anti-oncogenic characteristics of E6*, some of which likely involve down-regulation of the full-length isoform, and others that are independent of HPV. These data represent the first demonstration of biologically-relevant E6* activities distinct from those of the full-length isoform in vivo.
Keywords: HPV 16, E6, cervical cancer, tumor, E6*, in vivo
Introduction
High-risk types of the human papillomavirus (HPV) are the causative agents of nearly all cases of cervical cancer, as well as a significant number of head, neck, penile, vulvar and anal cancers. Like many other viruses with small genomes, HPV (~8 kb) utilizes numerous mechanisms to increase the capacity of its genome to encode the proteins necessary for successful completion of its infectious life cycle. Alternative splicing of viral mRNA is one common mechanism used by many viruses, including HPV, to produce multiple proteins from a limited genetic sequence. The early HPV genes (E1, E2, E4, E5, E6 and E7), and in particular, E1, E2, E6 and E7, have been studied intensively over the last 2 decades (Bodily and Laimins, 2011; Ghittoni et al., 2010; Graham, 2010; McLaughlin-Drubin and Munger, 2009; Moody and Laimins, 2010; Munger and Howley, 2002; Pim and Banks, 2010). Their activities and roles in the virus life cycle and during cellular transformation have been well established, with the E6 and E7 oncogenes from high risk types implicated as the major transforming agents. However, the functions of their alternatively spliced products have not yet been closely examined, even though increasing evidence suggests that these proteins may play important roles in the viral life cycle as well as contribute to carcinogenesis. For example, the splicing product E1^E4 has been linked to the productive life cycle. This function is associated with keratin networks, although the exact mechanism has not yet been elucidated (Doorbar et al., 1991). Additionally, overexpression of HPV-11 and HPV-16 E1^E4 has been shown to induce G2 arrest (Davy et al., 2002). Another example of an HPV splice product with a biologically important role is the spliced E8^E2C fusion protein, which functions as a negative regulator of viral transcription and replication for HPV 31 (Stubenrauch et al., 2000; Stubenrauch, Zobel, and Iftner, 2001).
The E6 and E7 oncogenes of high-risk HPVs are predominantly transcribed as an early transcript from the early promoter that produces bicistronic E6/E7 pre-mRNA. If the introns within this E6/E7 transcript remain unspliced, the resulting mRNA expresses oncogenic full length E6. If, however, these introns are spliced out, several splice variants are possible. High-risk HPVs possess one 5′ donor splice site within the E6 coding region as well as multiple acceptor splice sites localized within E6 as well as in other genes (Zheng and Baker, 2006). The E6*I and E6*II splice variants are produced when the acceptor sites are localized within the E6 sequence, and their protein products are quite similar as they differ only in the last 7 aa (Figure 1A). The ability to produce splice variants of E6 appears to be a characteristic of high-risk types of HPVs, as HPV 16, HPV 18, HPV 31, HPV 33 and HPV 45 do produce these variants (Sotlar et al., 2004), while low-risk types such as HPV 6b and HPV 11 do not (Filippova et al., 2007; Pim, Tomaic, and Banks, 2009). This difference in the presence of E6 splice variants between low- and high-risk HPV types may suggest that E6 splicing plays a role in viral oncogenesis (Zheng, 2010). An alternative suggestion is that this alternate splicing is somehow required for successful completion of the high-risk (but not the low-risk) life cycle.
Figure 1.


Alignment and expression of E6, E6*I and E6*II. A) Alignment of the protein sequences for E6, E6*I, and E6*II. The common amino acids for these three proteins are highlighted. B) Expression of Flag-E6 wt, Flag-E6, and Flag-E6*I at the protein level. U2OS cells were transiently transfected with Flag-E6 wt, Flag-E6, or Flag-E6*I. Forty-eight h post-transfection, expression was analysed by immunoprecipitation using α-Flag agarose, followed by detection using antibodies directed against Flag-HRP. C and D) Expression of E6*I is higher than expression of E6*II in cervical cancer cell lines (C) and in U2OS cells stably transfected with pHA-E6 wt under the control of the tet promoter (UtetE6wt) (D). qRT-PCR was performed using primers designed specifically for E6*I and E6*II. 5′ primers for E6*I and E6*II were homologous to exon-exon splicing regions, while the 5′ primer for E6 was designed for intron I of E6. The 3′ primer used for each of the three isoforms was homologous to the C-terminus of E6. Primers for GAPDH were used to normalize input of cDNA. C) The ratio between the levels of mRNA expression of E6, E6*I, and E6*II in CaSki and SiHa cells is presented as a fold-change relative to E6 expression in CaSki cells. D) UtetE6wt cells were grown in media without Doxycycline (Dox) (high level of E6 expression), or in media containing 100 ng/ml of Dox (low level of E6 expression). The level of E6*I expression in UtetE6wt cells at low and high levels of Dox was set at 100%, and the level of mRNA expression of E6*II was expressed as a percentage of E6*I expression. The lower panel of (D) shows the expression of E6 and E6* in UtetE6wt cells in the presence and absence of 100 ng/ml Dox, as determined by immunoblot using antibodies directed against the N-terminus of E6.
One initial explanation for these splice variants was that such splicing, particularly splicing of intron 1 resulting in the E6*I transcript, benefited E7 expression (Tang et al., 2006). Investigators showed that when protein translation occurs on E6E7 mRNA, the space between termination of E6 translation and the initiation of E7 is not sufficient for effective translation of E7 (Zheng et al., 2004). However, there is enough space on the spliced E6*I-E7 mRNA for termination of E6*I translation and re-initiation of E7 translation (Zheng et al., 2004), leading to the suggestion that the purpose of E6 splicing was simply to promote E7 expression. Interestingly, although the presence of transcripts coding for E6 splice variants has been acknowledged for several years the activity and existence of the E6* protein has remained under question. The recent availability of antibodies with improved sensitivity and specificity for E6 and E6* has now allowed us to demonstrate the presence of E6* at the protein level in cervical cancer cell lines, and also to observe differences in the expression levels of both E6 and E6* between the CaSki and SiHa cervical carcinoma cell lines (Filippova et al., 2009). We found not only that E6* is indeed produced at detectable levels, but also that it is biologically active. For example, we demonstrated that the over-expression of E6* in SiHa cells sensitized these cells to apoptosis induced through the TNF and Fas pathways (Filippova et al., 2009), indicating a possible pro-apoptotic role for this protein. Additional functions of E6* from HPV18 have been demonstrated by the Banks group (Pim, Massimi, and Banks, 1997), which showed that HPV 18 E6* can suppress the growth of transformed cells, and decrease the ability of the full-length isoform to degrade p53.
This type of data, suggesting that E6* possesses anti-oncogenic activities, led to the intriguing suggestion that the truncated isoform might play a distinct role in carcinogenesis, possibly by opposing activities of the full-length isoform. Each of the studies noted above was carried out in the context of cell lines, so to test the prospect that E6* might act as an anti-oncogene in vivo, we examined the influence of E6* on tumor formation in a cervical cancer xenograft model. To discriminate between activities that require the presence of the full-length isoform and activities that are independent of E6, we asked whether E6* could affect the formation of tumors from both HPV16+ SiHa cells and HPV16− C33A cells. We were able to demonstrate that indeed, over-expression of E6* in both HPV16+ SiHa cells and HPV16− C33A cells led to the inhibition of tumor growth in nude mice, with the inhibition of tumor growth greatest in tumors derived from HPV+ cells. These findings suggest the involvement of both E6-specific and E6-independent activities.
Results
E6*I is expressed at a higher level than is E6*II in both CaSki and SiHa cells
When expressed in mammalian cells, the high-risk E6 oncoprotein is expressed as both full-length and smaller isoforms, with the smaller isoform comprising approximately one-third of the full-length sequence from the N-terminus of E6 (Figure 1A, where highlighted residues represent residues in common between E6, E6*I and E6*II). Because the two smaller isoforms expressed from the E6 gene differ only in the last 7 aa of their C-terminus (Figure 1A), the difference in size between them is too small to be distinguished by immunoblot (Figure 1B). At the RNA level, however, 3 transcripts of ~0.5 kb, ~0.3 kb and ~0.2 kb can be detected, which can be respectively translated into 3 proteins: the full length isoform of 158 aa and two smaller isoforms of 50 aa (E6*I) and 55 aa, (E6*II) (Figure 1A). To determine which transcript corresponds to the smaller protein band (Figure 1B), we estimated the relative levels of E6*I and E6*II expression using qRT-PCR. qRT-PCR of E6*I and E6*II transcripts was performed using mRNA isolated from the cervical cancer cell lines, CaSki and SiHa (Figure 1C), as well as from U2OStetE6 cells (Filippova et al., 2009; Filippova et al., 2007) (Figure 1D). In these U2OStetE6 cells, E6*I and E6*II are expressed from a stably-transfected plasmid expressing the wild-type sequence for E6 (pE6 wt). Expression of E6 wt is under control of the tet response element, and high and low levels of HA-E6 expression are regulated by the concentration of doxycycline in the culture medium (Figure 1D bottom panel). As shown in Figure 1C and D, the E6*I transcript is several times more abundant than the E6*II transcript in CaSki, SiHa and U2OS cells, and the ratio of the levels of the E6*I transcript to the E6* II transcript does not depend on the level of E6 expression in U2OStetE6 cells. This data, therefore, suggests that the smaller E6 band detected by immunoblot (Figure 1B) is translated primarily from the E6*I transcript. The prevalence of E6*I over E6*II expression allowed us to focus on E6*I in the following experiments, and this gene and its corresponding protein are henceforth referred to as E6*.
E6* expression increases levels of caspase 8, p53 and E-cadherin and sensitizes SiHa cells to TNF
To assess the properties of E6* during tumor formation, we first created and characterized cervical cancer-derived cell lines expressing E6* in the context of both an HPV+ and an HPV− background. SiHa cells stably transfected with the empty vector pFlag are HPV+ cells with a low level of E6* expression (control), while SiHa cells stably transfected with pE6* are HPV+ cells with a high level of E6*. A similar pair of cell lines originating from the HPV− C33A cervical cancer cell line was also created by stably transfecting these cells with either pFlag (C33A pFlag, control) or pE6* (C33A E6*). After selection in G418, pE6*-expressing SiHa-derived lines were analyzed for their level of E6* expression by immunoblot. Eighteen clonal lines were expanded and screened, and of these, six were selected on the basis of high levels of E6* expression (data not shown). An equal number of cells from each of these six lines were combined, and the resulting pooled cells (SiHa pE6*) were used for further study. The use of pooled cells was employed in order to minimize the possible impact of site-specific integration events. Figure 2A shows expression of E6* in the pooled SiHa pE6* cells as compared to those in the pooled SiHa pFlag cells, demonstrating increased expression levels of E6* in cells harboring the pE6* plasmid. The relative levels of E6 and E6* expression at the mRNA level are shown in Figure 2B, and demonstrate that the level of the full-length E6 transcripts does not change significantly following over-expression of E6*. Expression of E6* in the analogous pooled C33A-derived lines is shown in Figure 2C. To create these cells, 24 stable cell lines were isolated, characterized, and equal numbers of the six C33A-derived lines with the highest expression of E6* were pooled.
Figure 2.

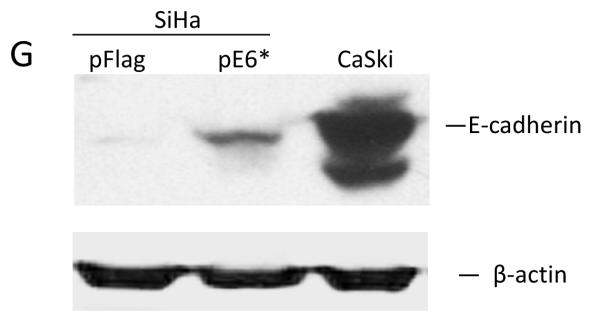
Expression and activity of E6* in SiHa and C33A cells. A and C) Pooled SiHa pE6*(A) and C33A pE6* (C) cells express Flag-E6*. PVDF membranes carrying the SDS-separated proteins were probed with α-Flag-HRP antibodies, and α-β-actin antibodies were used to normalize for protein load or immunoprecipitation input, respectively (A and C) (bottom panels). B) The ratio between the levels of mRNA expression of E6 and E6* in SiHa pFlag and SiHa pE6* cells is presented as a fold-change relative to β-actin expression as determined by qRT-PCR. D, E, F and G) Expression of E6* in SiHa cells affects the level of expression of procaspase 8 and p53 as detected by immunoblot (D) and by p53-ELISA (E), as well as TNF-α-induced apoptosis (F) and expression of E-cadherin (G). D) Cell lysates prepared from SiHa pFlag and SiHa pE6* cells were treated with 10 uM MG 132 for 16 h prior to lysis. Detection of p53 and caspase 8 was performed by immunoblot, β-actin was used for normalization. E) 106 SiHa pFlag or SiHa pE6* cells were treated with either mitomycin C or DMSO (control) for 16 h prior to lysis. p53 ELISA was performed as described in Material and Methods. Data is presented as the optical density at 405 nm per mg protein in cells treated with mitomycin C, minus that same measurement in cells not treated with mitomycin C. Measurements were made in triplicate, and the error bars represent the standard deviation. * indicates a 0.98 level of confidence. F) 104 cells per well were seeded onto a 96-well plate. Cells were treated with 10 μg/ml of cycloheximide in the presence or absence of 50 ng/ml of TNF-α for 16 h. Cell viability was monitored using the CellTiter-Glo Luminescent Cell Viability Assay (Promega). ** indicates a 0.99 level of confidence. G) The E-cadherin level was detected by immunoblot in lysates prepared from SiHa pFlag, SiHa pE6* and CaSki cells, normalized by β-actin.
We have previously demonstrated that E6 protects U2OS cells from TNF-induced apoptosis by decreasing the level of procaspase 8. In contrast to E6, E6* stabilizes procaspase 8, sensitizing these cells to TNF-induced apoptosis (Filippova et al., 2007; Tungteakkhun et al., 2009), and we found this to be true in SiHa cells as well. Figures 2D and 2E demonstrate that increasing the level of E6* expression in SiHa cells (SiHa pE6*) leads to higher levels of procaspase 8 as well as p53, and Figure 2F shows that this increase in E6* sensitizes cells to TNF. We also found that E6* expression causes an increase in E-cadherin levels in SiHa cells, though not to the level observed in CaSki cells (Figure 2G). E-cadherin is a marker of epithelial cell-cell adhesion and its function is lost in many epithelial cancers (Hazan et al., 2004).
E6* was unable to change the level of expression of caspase 8, p53 or E-cadherin in C33A cells (data not shown). C33A cells do not express caspase 8 or E-cadherin, either in the absence or the presence of E6* expression. They do express mutant p53 at high levels (Crook et al 1991), and over-expression of E6* did not alter these high levels.
Expression of E6* in HPV16+ SiHa cells dramatically reduces tumor formation in a xenograft mouse model
To determine whether expression of E6* affects tumor formation in vivo, 7.5 × 10⁶ cells of SiHa pFlag and of SiHa pE6* were injected subcutaneously into each of five nude mice. SiHa pFlag cells were injected on the left side, while SiHa pE6* cells were injected on right side of the same mouse. Tumor formation was assessed by measuring the tumor size approximately every four or five days with calipers. On the 88th day, mice were sacrificed, and the tumor was isolated and divided into two pieces. One piece was paraffin embedded, sectioned, and stained using haematoxylin-eosin, or used for immunohistochemical detection of VEGFR-1; the other part was used for RNA isolation.
Figure 3A shows a representative mouse with developed tumors. On the left side of each mouse, a large tumor derived from SiHa pFlag cells developed, while on the right side of the same mouse, a tumor derived from SiHa pE6* cells was in most cases barely noticeable. The relative size of the two tumors following dissection is shown in the bottom panel. Figure 3B shows the relative tumor growth for SiHa pFlag and SiHa pE6* tumors, calculated as a percent of the tumor size on day 4 when measurements began. During the first 19 days following injection, the size of all tumors decreased and remained fairly constant until day 34. SiHa pFlag and SiHa pE6* tumors experienced a similar pattern of reduction in size, probably due to a gradual decrease in the inflammation that accompanied the initial injection of the cells. Following day 34, tumors derived from the SiHa pFlag cells began a rapid period of growth, reaching an average volume of more than 320 mm3, (650% of the day 4 value) by the 88th day. In contrast, tumors derived from the SiHa pE6* cells did not grow until day 74. Following this, a slow growth of SiHa pE6* tumors was observed, reaching an average volume of 67 mm3 (less than 200% of the day 4 value) by day 88 (Figure 3B).
Figure 3.

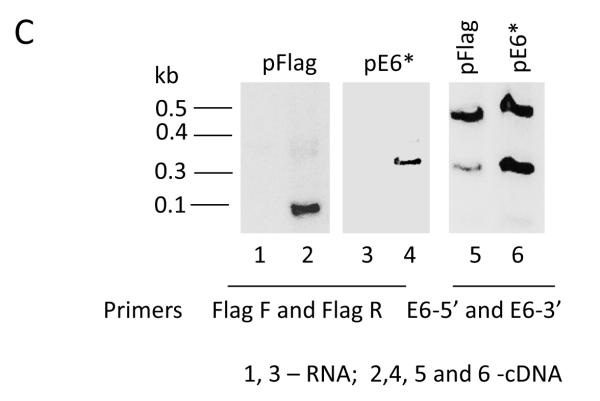
Over-expression of E6* in SiHa cells reduces tumor growth in a tumor xenograft model. A) A representative mouse bearing a tumor derived from SiHa pFlag cells on the left side and a tumor derived from SiHa E6* cells on the right side (upper panel). The bottom panel shows representative tumors following isolation the 88th day post-injection. B) The relative average tumor volume observed for the SiHa pFlag and SiHa pE6* tumors. The volume of the tumor at day 4 was set at 100%, and error bars represent the standard error of the mean. ** indicates that the mean tumor volumes at day 88 were significantly different between the two groups (P>0.99). C) Expression of E6 and E6* at the mRNA level in dissected tumors derived from SiHa pFlag and SiHa pE6*. Expression of Flag-E6* and Flag-E6 transcripts in tumors was detected by RT-PCR using primers specific for Flag-E6* (Flag F and Flag R primers) (left and medium panels) and for E6 (E6-5′ and E6-3′) (right panel). 1, 3 – RNA; 2, 4, 5 and 6 – cDNA.
Over-expression of E6* in the tumors derived from the SiHa E6* cells was demonstrated by RT-PCR (Figure 3C). Sections from corresponding tumors were pooled and used for RNA isolation. When the Flag F and Flag R primers were used, corresponding to sequences in the cloning vector, the product detected in the SiHa pFlag tumors was less than 0.1 kb in size, while in the SiHa pE6* tumors, the PCR product was greater than 0.3 kb (left and middle panels). When primers designed for the E6 gene were used, both the full-sized E6 and the E6* isoform were detected in both types of tumors (right panel). However, E6* was detected at a much higher level in tumors derived from the SiHa pE6* cells than in tumors derived from the control cells, demonstrating that this over-expression had not been lost during in vivo passage.
Analysis of cross-sectioned tumors stained with haematoxylin-eosin revealed that tumors derived from SiHa pFlag and SiHa pE6* cells differ in their morphological characteristics (Figure 4). The large tumors derived from SiHa pFlag cells were consistently heterogeneous with sheets and nests of squamous cell carcinoma combined with extensive leukocytic cell infiltration and large areas of unstructured necrotic masses with imbedded damaged cells (Figure 4A and 4B, left-side panels).
Figure 4.


Sectioned SiHa tumor xenografts were stained with haematoxylin-eosin (A and B), and VEGFR-1 was detected by immunohistochemistry (C). A) Objective x10; B and C) Objective ×40. Arrows indicate live cells, necrotic cells, and connective tissues. C) α-VEGFR-1 antibodies were applied to the indicated sections, while no primary antibodies were applied to negative controls. Sections were then counter-stained with haematoxylin.
In contrast, the tumors derived from SiHa pE6* cells were significantly smaller than the SiHa pFlag tumors. These smaller tumors were more consistently well circumscribed and encapsulated, and the structure was more homogenous, with the majority of the tumor being composed of squamous cells (Figure 4A and 4B, right-side panels). One dramatic difference between the SiHa pFlag and SiHa pE6*-derived tumors was in the size of necrotic areas; only a small focal amount of this necrosis was observed in 3 of the 5 SiHa pE6*-derived tumors.
In addition, we employed immunohistochemistry to assess VEGFR-1 expression in these tumor sections because the distribution and level of expression of this molecule has frequently served as a marker of tumor angiogenesis (Harris, 2002). In tumors derived from the SiHa pFlag cells, high levels of VEGFR-1 expression were observed in large areas of the tumor, where cells presumably had a low oxygen supply, while areas with healthy squamous cells exhibited low levels of VEGFR-1 (Figure 4C, middle panel). However, in tumors derived from the SiHa pE6* cells, where tumors consisted primarily of healthy cells, expression of VEGFR-1 was nearly undetectable (Figure 4C, right panel). Only a slight staining was observed in areas where necrotic cells were also found.
Expression of E6* also reduces tumor formation when expressed in HPV− C33A cells
To determine whether expression of E6* would be able to reduce tumor formation in the absence of HPV proteins, we repeated the in vivo experiment using the HPV-negative C33A pFlag and C33A pE6* cell lines (Figure 2C). In this experiment, 5 × 10⁶ cells of C33A pFlag and C33A pE6* cells each were injected subcutaneously into five nude mice. C33A pFlag cells were injected on the left side, and C33A pE6* cells were injected on right side of the same mouse. Tumors produced by C33A cells were observed to grow more rapidly than the tumors derived from SiHa cells. Two mice were sacrificed at day 48 due to the rapid growth and resulting size (>1500 mm3) of the tumor, and the other three mice were sacrificed when tumor size reached 1500 mm3. Figure 5A shows a representative mouse with tumors. On the left side of each mouse a large tumor derived from C33A pFlag cells developed, while on the right side of the same mouse a smaller tumor derived from C33A pE6* cells was formed. The relative size of the two tumors following dissection is shown in the bottom panel of Figure 5A.
Figure 5.

Over-expression of E6* in C33A cells reduces tumor growth in a tumor xenograft model. A) A representative mouse bearing a tumor derived from C33A pFlag cells on the left side and a tumor derived from C33A E6* cells on the right side (upper panel). The bottom panel shows representative tumors following isolation on day 53 post-injection. B) The relative average tumor volume observed for the C33A pFlag and C33A pE6* tumors. The volume of tumor at day 7 was set at 100%. Error bars represent the standard error of the mean. ** indicates that the mean tumor volumes at day 53 were significantly different between the two groups.
Figure 5B shows the relative tumor growth for C33A pFlag and C33A pE6* tumors, which is calculated as a percent of the tumor size on day 7 when measurements began. In contrast to the growth of tumors induced by SiHa-derived cells, the tumors derived from C33A cells did not show a reduction in size at the beginning. Tumors started to grow a week after cell injection and gradually enlarged, with more rapid tumor growth observed following day 45 post-injection. At day 53, the average size of tumors derived from C33A pFlag reached >900 mm3, corresponding to more than 1200% of their size at day 7. However, tumors derived from the C33A pE6* cells reached a size of only 273 mm3, slightly exceeding a 400% increase (Figure 5B).
Cross-sectioned tumors derived from C33A pFlag and C33A E6* cells and stained with haematoxylin-eosin were characterized by consistently heterogeneous sheets and nests of squamous cell carcinoma combined with large areas of unstructured necrotic masses with imbedded damaged cells and patches of connective tissues. Differences between C33A pFlag and C33A E6* included larger areas of necrotic masses and connective tissues and smaller areas of squamous cells in C33A pFlag tumors (Figure 6A and B). However, no significant difference in the expression of VEGFR-1 between C33A pFlag and C33A pE6* tumors was detected by immunohistochemistry (Figure 6C, middle and right panels).
Figure 6.


Sectioned C33A tumor xenografts were stained with haematoxylin-eosin (A and B), and VEGFR-1 was detected by immunohistochemistry (C). A) Objective ×10; B and C) Objective ×40. Arrows indicate live cells, necrotic cells, and connective tissues. C) α-VEGFR-1 antibodies were applied to the indicated sections, while no primary antibodies were applied to negative controls. Sections were then counter-stained with haematoxylin.
Reduction of tumor growth by E6* in tumors derived from HPV+ SiHa cells is greater than in tumors derived from HPV− C33A cells
A comparison of the growth curves (Figures 3B and 5B) revealed that the development of tumors from the SiHa and C33A cells followed different dynamics. To determine how expression of E6* impacted these dynamics in both the HPV+ SiHa and the HPV− C33A cells, the average relative sizes of E6*-expressing tumors as a percentage of the control pFlag tumors (in the same mouse) in SiHa and C33A cells were compared. For this comparison, we selected the time period beginning when tumors were first detectable and ending just prior to sacrifice (days 40 – 88 post-injection for SiHa cells, Figure 3B; and days 17 – 48 post-injection for C33A cells, Figure 5B), during which exponential tumor growth occurred. Figure 7A shows the relative sizes of the E6*-expressing tumor as compared to the corresponding control tumor during this period. Interestingly, the trends differed between the two cell lines. While the relative sizes of the E6*-expressing SiHa tumors were relatively low throughout this period of exponential growth with the ratio changing less than two-fold, the relative sizes of the E6*-expressing C33A tumors were higher throughout the experiment, and decreased more than two-fold over this time period. One conclusion from this comparison is that the control SiHa tumors grew significantly faster than did the corresponding SiHa E6* tumors, with the relative difference remaining somewhat constant over time. In contrast, the difference between the size of control C33A-derived tumors and those derived from the corresponding E6*-expressing cells was smaller and increased over time, implying increasing effectiveness of the viral protein. In particular, the E6*-mediated reduction in size in the context of SiHa cells ranged from 67% to 92% on day 88, (average of 79%), while the corresponding values for the C33A cells ranged from 44% to 72% at day 53 (average of 56%), a difference of more than 20% (Figure 7B). The significance of the difference in these curves was estimated by one-way ANOVA (P-value = 2.51 × 10⁻⁷). These results suggest that E6* may act through a different set of pathways in the two cell lines. In summary, E6* appears to be more effective in suppressing tumor growth in the presence of E6 (SiHa cells) than in its absence (C33A cells).
Figure 7.


Expression of E6* resulted in a greater reduction of tumor volume in tumors derived from SiHa cells than in tumors derived from C33A cells. A) The relative volume of pE6* tumors in each cell line was calculated as a percentage of the volume of the pFlag tumor in the same mouse during exponential tumor growth, and the average relative size of the E6* tumors was plotted along with the linear trend. B) The average reduction in tumor volume was calculated as the difference between the volume of the pE6*-derived tumor and the volume of the pFlag-derived tumor from the same mouse at the date of harvest, expressed as a percentage of the volume of the corresponding pFlag tumor. The significance of A) and B) was determined by one-way ANOVA. ** indicates that the means of tumor volume reduction at day 53 were significantly different between the two groups. C) E6* binds to E6. 107 U2OS cells were co-transfected with pFlag or pFlag-E6* together with pHA-E6 for 48 h, and cells were treated with 10 μM MG132 for 16 h prior to preparation of lysates. Flag-tagged proteins were precipitated by Flag-agarose, and HA-E6 was detected using HRP-coupled antibodies directed against HA (upper panel). Input levels of E6 and E6* in the lysates (lower panel) were determined by immunoblot using antibodies directed against the N-terminus of E6. D) E6* inhibits cell growth in SiHa but not C33A cells. 5 × 10³ cells per well were seeded into four 96-well plates. Twenty-four h later (day 0) and on the following three days, cells were fixed in 10% formaldehyde. Staining of live cells was performed using crystal violet. Absorbance at 570 nm was measured after dissolving the crystal violet in 100 μl of 10% acetic acid. Measurements were made in triplicate, and error bars represent the standard deviation.
E6* binds to and inactivates the full-length isoform
One possible explanation for the greater reduction of tumor size caused by E6* in SiHa as compared to C33A cells is that the shorter isoform inhibits the oncogenic activities of the full-length isoform. It is known, for example, that E6* proteins from both HPV16 (Filippova et al., 2009) and 18 (Pim and Banks, 1999) can bind to E6 and modify its activities. Figure 7C demonstrates this binding. In this co-immunoprecipitation experiment, U2OS cells were co-transfected with either pFlag or pFlag-E6* together with HA-E6. Flag-tagged proteins were precipitated using Flag-agarose, and the co-immunoprecipitated HA-E6 was detected by immunoblot. The results show that HA-E6 was precipitated by Flag antibodies from cell lysates where Flag-E6* was expressed, confirming the binding interaction between the proteins.
Inactivation of E6 activity by E6* has the potential to affect cell viability and growth. To determine if this was likely to account for the difference in tumor growth, the growth rates of both SiHa and C33A control cells and cells expressing E6* were compared. Cells from each line were plated and allowed to grow for 3 days, and the number of viable cells measured every 24 h using crystal violet. These results (Figure 7D) demonstrate a difference in growth rate between SiHa pE6* as compared to SiHa pFlag cells, as well as a lack of variance in the growth rate between C33A pFlag and C33A pE6* cells. Because the SiHa pE6* cells grow slower than SiHa pFlag cells, an E6*-mediated reduction in growth rate could contribute to the observed difference in SiHa-derived tumor formation from SiHa cells, though this is unlikely to be the case for C33A-derived tumors. Colony-forming assays also suggest that the over-expression of E6* in SiHa cells impedes the formation of colonies, though this trend is not apparent in C33A cells (data not shown).
Overall, these data show that E6* can bind to the larger protein, and that its expression reduces the growth rate of HPV+, but not of HPV− cells. Clearly, this mechanism has the potential to contribute to the reduction of tumor size in our HPV+ SiHa xenograft model. However, the C33A data (Figure 5) indicates that additional mechanisms, which are independent of the interaction(s) of E6* with other HPV proteins, participate as well.
Discussion
Studies over the past few decades have focused intensively on the activities and roles of E6 proteins from high-risk types of HPV during the process of cellular transformation, clearly implicating E6 as a major transforming agent. However, the role of the smaller splice isoform, E6*, in the carcinogenic process (if any) has not yet been established. In the present study, we provide insight into the behavior of the E6* protein during tumor growth in an in vivo nude mouse xenograft model demonstrating that E6* displays both E6-dependent and E6-independent anti-tumor activity. The difference in tumor size observed in the presence and absence of E6*, when expressed in both HPV+ (SiHa) and HPV− (C33A) cells (Figures 3 and 5), is dramatic and consistent, strongly indicating an anti-oncogenic role for E6* in this context.
Opposing functions of alternatively spliced variants have previously been demonstrated for a large number of cellular and viral genes, including many that are associated with cancer (David and Manley, 2010; Mercatante and Kole, 2000). Alternative splicing of viral transcripts is a well-known phenomenon, as it provides a way to increase the encoding capacity of viral genomes, and thus to enhance viral versatility and adaptability. Although alternatively spliced HPV transcripts for the E6 isoforms have been known for over two decades (reviewed in (Zheng and Baker, 2006), an appreciation of the opposing biological functions of the full-length and truncated isoforms is relatively recent (Filippova et al., 2009; Guccione, Pim, and Banks, 2004; Pim, Massimi, and Banks, 1997). One reason for this delayed appreciation has been the historical difficulty of demonstrating significant expression of E6* at the protein level. Indeed, it was only after the availability of appropriate antibodies (Euromedex, France) that our laboratory was able to document, for the first time, endogenous expression of E6* as a protein in cervical cancer cells at levels comparable to that seen for expression of the full-length isoform (Filippova et al., 2009).
Cellular models have previously been used to demonstrate opposing functions of E6 and E6* on components of cellular apoptotic pathways. In particular, we have reported that E6 expression protects cells from apoptosis induced by members of the TNF superfamily (such as TNFα, FasL and TRAIL) by accelerating the degradation of procaspase 8. In contrast, the binding of E6* to procaspase 8 leads to its stabilization and increased cellular levels of the protein (Filippova et al., 2007)(Tungteakkhun et al., 2009). Consistent with these differential effects, we found that E6 and E6* actually bind to different sites on procaspase 8 (Tungteakkhun et al., 2010). Extending and supporting these findings, we demonstrate here that plasmid-expressed Flag-E6* is able to re-sensitize SiHa cells to TNFα–induced apoptosis (Figure 2F) through an increase in the level of endogenous procaspase 8 (Figure 2D). Radio-sensitization by HPV 16 E6*I has previously been reported in cells derived from oropharyngeal squamous cell carcinoma (Pang et al., 2011), again indicating that E6* can enhance apoptosis. In addition, the negative influence of E6* on cell growth in lines transformed both by HPV and by other mechanisms has been demonstrated for HPV18 E6* (Pim, Massimi, and Banks, 1997), in good agreement with the data from our SiHa model (Figure 7D). Interestingly, E6* expression can affect functions in addition to apoptosis and cell growth. During the transformation process, epithelial cells frequently lose their epithelial cell-cell contacts (Takeichi, 1993). One of the epithelial adhesion proteins involved is E-cadherin, which is responsible for Ca2+-dependent cell-cell adhesion (Hazan et al., 2000). We found that expression of E6* was partially able to restore the level of E-cadherin in SiHa cells (Figure 2G), although not in C33A cells.
Interestingly, E6* can sometimes mimic E6 activity in the absence of E6. Banks and coworkers found that E6* from HPV 18 can accelerate the degradation of some PDZ-containing proteins, including Akt, Dlg, and MAGI-1 (Guccione, Pim, and Banks, 2004; Pim and Banks, 1999; Pim, Massimi, and Banks, 1997; Pim, Tomaic, and Banks, 2009). In the absence of the full-length isoform, it may be that E6*, corresponding to the N-terminal half of E6, can mimic E6 through self-oligomerization and in this way down-regulate the expression levels of certain PDZ-proteins. Together, these data indicate that E6* is not simply a smaller version of E6, capable of carrying out only a subset of the biological activities executed by E6, but that E6* can act independently of full-length E6 .
The in vivo studies described here deepen and expand our understanding of E6*, and build on previous cellular data by showing that E6* activity can indeed reduce tumor growth in a xenograft nude mouse model (Figures 3 and 5). Interestingly, we found that tumor growth inhibition by E6* is greater in tumors derived from SiHa cells, which are HPV16-positive, than in tumors produced by C33A, which are HPV-negative (Figure 3B, 5B 7A and 7B). This difference implies that E6* acts by interfering with the oncogenic activity of the full-length protein as well as through one or more HPV-independent mechanisms. Consistent with this idea, we found that E6* does indeed bind to the full-sized isoform (Figure 7C) and inhibits its ability to accelerate degradation of p53 (Figures 2D and 2E). Together, the biological activities of E6* reduce the growth rate of SiHa pE6* cells (Figure 7D), contributing to a reduced growth rate of E6*-expressing tumors. These findings are consistent with earlier studies showing inhibition of tumor growth in a xenograft model following expression of shRNA directed against E6 (Bai et al., 2006). In another study, the inhibition of both E6 and E7 expression led to reduced cell growth and invasive ability for SiHa cells both in vitro and in vivo (Chang et al., 2010).
E6* also displays HPV-independent anti-tumor activity, as it was able to reduce the size of itumors derived from HPV− C33A cells (Figure 5). Interestingly, this anti-tumor activity is likely not p53-related because C33A cells express mutant p53 (Crook, Wrede, and Vousden, 1991). In addition, we found that the over-expression of E6* in C33A cells does not affect cellular growth, at least in vitro (Figure 7D). In this case, therefore, it is likely that E6* engages one or more other mechanisms to reduce tumor growth. For example, activation of AMPK, a cellular metabolic sensor that modulates normal and cancer cell metabolism, inhibits cervical cancer cell growth through a decrease in FOXM1 levels. FOXM1 is a transcription factor reported to be abnormally upregulated in human cervical squamous cell carcinomas, and is involved in down-regulating p27 and p21 (Chan et al., 2008). Since the phenomenon of growth inhibition through decreased levels of FOXM1 by AMPK activation was observed in four different cervical carcinoma cell lines, including C33A (Chan et al., 2008), we speculate that perhaps oncogenic factors such as FOXM1 could play an important role in the mechanisms through which E6* inhibits growth of C33A-derived tumors in our in vivo system as well. In addition to this possibility, we note that the deregulation of Wnt/B-catenin signaling is prevalent in many cancers of epithelial origin, including cervical cancer (Delmas et al., 2011)(Kwan et al., 2013), and it may be that expression of E6* leads to Wnt/B-catenin dysregulation. Our future studies will focus on elucidating the mechanisms through which E6* mediates inhibition of tumor growth in both C33A and SiHa cells by identifying pathways affected by E6* expression.
Epidemiological studies of actual cases of cervical cancer have shown differential splicing in the E6/E7 region for both HPV 16 and HPV 18 (Berumen et al., 2001; De la Cruz-Hernandez et al., 2005), and demonstrated that patterns of HPV18 E6/E7 splicing associated with E6 variants can be related to differences in cancer aggressiveness and prognosis for treatment. For example, cells isolated from tumors expressing the African variant of E6, which express relatively high levels of E6*, formed tumors in nude mice more slowly than did cells possessing the Asian-Amerindian variant of E6, which express relatively low levels of E6* along with high levels of E6 (De la Cruz-Hernandez et al., 2005). In addition, the data reported by De la Cruz-Hernandez and coworkers linked E6* expression in patient samples to higher levels of p53, which is also consistent with our data.
The role of E6* in the virus life cycle has not yet been established. It is known, however, that splicing of the E6/E7 transcript enhances E7 expression (Zheng et al., 2004), suggesting that the potential for alternative splicing is of functional significance. Furthermore, HPV16 E6 alternative splicing in the epithelia depends on the level and presence of EGF, indicating that the splicing of E6 is not a random process (Rosenberger et al.). E6* may work by regulating the activity of E6 (and/or other HPV proteins such as E2), as well as cellular proteins through protein-protein interactions within the differentiating epithelium. Such questions await further research. In summary, we report here for the first time that the smaller isoform of E6, E6*, possesses anti-oncogenic activities that can be demonstrated in vivo. Importantly, these biological activities are distinguishable from those of E6. Future work will focus on the significance of these findings in the context of human cancers, where we will explore the possibility of mimicking or replicating the anti-oncogenic activity of E6* in such a way as to provide therapeutic benefit. Another direction for future research will be to determine what role E6* plays in the viral life cycle.
Materials and Methods
Reagents
MG132 (Sigma-Aldrich)) was dissolved in DMSO to yield a 10 mM stock, then stored at −20° C until use. Doxycycline (Dox) (BD Biosciences) was dissolved in PBS to a 1 mg/ml stock. α-Flag agarose, α-Flag-HRP conjugated antibodies and α-β-actin were obtained from Sigma-Aldrich. α-VEGFR-1 antibodies were purchased from Epitomics, α-E6 N-terminus antibodies were obtained from Euromedex (France), α-E-cadherin was purchased from Cell Signalling Technology, α-caspase 8 antibodies were purchased from BD Biosciences, α-HA was obtained from Roche Applied Science, and secondary ImmunoPure Antibody HRP conjugated antibodies were obtained from Fisher Scientific. α-p53 p122 antibodies were purified from conditioned media obtained during hybridoma growth.
Cell culture
U2OS cells, derived from a human osteosarcoma, as well as SiHa, C33A, and CaSki cells, derived from cervical carcinomas, were obtained from the ATCC. U2OS cells and their derivatives were cultured in McCoy’s 5A medium (Invitrogen), and SiHa, C33A, and CaSki cells were maintained in MEM medum (Mediatech, Inc). Media was supplemented to contain 10% fetal bovine serum (Invitrogen), penicillin (100 u/ml) and streptomycin (100 μg/ml) (Sigma-Aldrich). Media for U2OS cells expressing E6 under the control of the tet-responsive element (UtetE6wt and UtetE6) was supplemented with Tet-FBS (BD Biosciences). The description and production of stably transfected U2OS cell lines capable of expressing variable amounts of HA-E6 wt, regulated by different concentrations of Dox present in media, has been described previously (Filippova et al., 2005; Filippova, Parkhurst, and Duerksen-Hughes, 2004).
Plasmids, transfection, and production of stable cell lines
The plasmid pTre-E6 (BD Clontech), which expresses HA-tagged HPV 16 E6 wild type (E6 wt) has been cloned and described previously (Filippova, Parkhurst, and Duerksen-Hughes, 2004; Filippova et al., 2002). The plasmids pFlag-E6 wt (pE6wt), pFlag-E6*(pE6*), and pFlag-E6 large (pE6) were obtained by cloning E6 wt, E6*I, or E6 large, respectively, in frame with the N-terminal Flag-tag and the C-terminal C-myc-tag into the pFlag-myc CMV-22 vector (Sigma-Aldrich). To produce stable cell lines expressing E6, pE6*, or the vector control, the appropriate plasmids were transfected into SiHa or C33A cells using the TransIt-LT1 Transfection Reagent (MirusBio), as directed by the manufacturer. Forty-eight h post-transfection, G418 (500 μg/ml) was applied to cells and antibiotic selection applied for 3 weeks. Expression of the desired protein was assessed by immunoblot.
Cell viability and growth assays
To measure cell survival following TNF-α treatment, SiHa-derived cells were seeded at a density of 104 cells per well on a 96-well plate and allowed to adhere overnight. TNF-α (50 ng/ml) was applied in the presence or absence of 10 μg/ml of cycloheximide (Cx), and cells were incubated for 16 h prior to measuring cell viability by CellTiter-Glo Luminescent Cell Viability Assay (Promega).
To estimate cell growth, 5×10³ cells were seeded into four 96-well plates and allowed to adhere overnight. The next day (day 0) and for the 3 days following, cells were fixed in 10% formaldehyde. Staining of cells was performed using crystal violet solution (Sigma-Aldrich). Absorbance at 570 nm was measured after dissolving crystal violet in 100 μl of 10% acetic acid (Fisher Scientific).
Immunoblotting and co-immunoprecipitation
For immunoblot analysis, cells (106) were lysed in 100 μl of Laemmli lysis buffer, then lysates were sonicated and loaded onto a SDS-PAGE gel. After protein transfer to Immobilon P membranes (Millipore Corporation) and blocking the membrane with 1% BSA, primary antibodies were applied in TBST containing 1% BSA. After incubation with primary antibodies overnight at 4°C, membranes were washed with TBST. Secondary ImmunoPure Antibodies (α-mouse or α-rabbit) conjugated with horseradish peroxidase (Fisher Scientific) were applied to the membrane for 1 h, and the detection of signals was performed using the chemiluminescent SuperSignal West Dura or Pico Maximum Sensitivity substrate (Fisher Scientific).
For immunoprecipitation and co-immunoprecipitations, cells were treated with 5 or 10 μM MG132 for 16 h prior to preparation of lysates. For co-immunoprecipitation 107 U2OS cells were cotransfected with pFlag or pFlag-E6* together with pHA-E6 for 48 h, Flag-tagged proteins were precipitated using Flag-agarose, and bound proteins were subjected to SDS-PAGE, then transferred to a PVDF membrane and detected by immunoblot. For the SiHa- and C33A-related experiments, 5×10⁶ pooled cells were lysed, then the Flag-E6* proteins were precipitated using Flag-agarose. Detection of Flag-E6* was performed using α-Flag-HRP antibodies.
PCR
Total RNA from cells was isolated using TrizolR, then tissues were homogenized in TrizolR using a Tissue Miser homogenizer (Fisher Scientific). cDNA was synthesized using SuperScript II reverse transcriptase (Invitrogen) according to the manufacturer’s protocols. Semi-quantitative RT-PCR was performed using 5′-GCACCAAAAGAGAACTGCAATGT-3′ and 5′-TGGGTTTCTCTACGTGTTCTTGAT-3′ primers to detect both E6 isoforms (E6 primers), or Flag-F 5′-CCAAAATCAACGGGACTTTC-3′ and Flag-R 5′-CACAGGGATGCCACCCGGG-3′ to detect FlagE6* transcripts.
Quantitative real-time PCR was performed to measure the concentration of E6 isoforms using primers designed by Hafner et al. (Hafner et al., 2008), using the Absolute QPCR SYBR Green kit according to the manufacturer’s protocol (ABgene). Concentrations of cDNAs were normalized using GAPDH or β-actin expression.
Implantation of tumor xenografts in mice
Five–week old female Crl:CD-1-Foxn1nu nude mice were obtained from Charles Rivers (Cambridge, MA), maintained in pathogen-free conditions and fed a standard irradiated chow diet while housed within the Animal Research Facility of the Loma Linda VA Medical Center (Loma Linda, CA). Mice were kept at 25° C, with a 12 h light-dark schedule and free access to food and water. All experiments were done under protocols approved by the Institutional Animal Care and Use Committee.
Six mice were injected subcutaneously with 31 Ga. needles in the flanks bilaterally. On the left side, 7.5 ×10⁶ SiHa pFlag cells or 5×10⁶ C33A pFlag cells were injected; and on the right side, 7.5 ×10⁶ SiHa E6* cells or 5×10⁶ C33A pE6* cells were injected, forming two tumors per mouse. Tumor formation and size were evaluated at 4-7 day time intervals for approximately 13 weeks for SiHa-derived tumors and for 8 weeks for C33A-derived tumors. Tumors were measured using calipers for two perpendicular measurements, and tumor volume was calculated according to the formula: Width2 × Length/2. In one mouse injected with SiHa-derived cells, and in one mouse injected with C33A-derived cells, both tumors gradually decreased until they disappeared. These mice were excluded from the reported averages.
All mice were killed by CO2 inhalation followed by thoracotomy. Tumors were explanted and dissected to obtain 2 samples from each xenograft: formalin-fixed for paraffin-embedding for morphological and immunohistochemical assays, and snap frozen in liquid nitrogen for RNA isolation.
Histochemistry and Immunohistochemistry
Tumor pieces fixed in formalin were embedded in paraffin, and sections were cut from tumors. For histochemical analysis, sections were stained with haematoxylin-eosin and analyzed under a light microscope. Localization of VEGFR-1 was performed using immunohistochemistry. Rabbit monoclonal antibodies (Epitomics) specific to VEGFR-1 (N-term) were applied to tissue sections at 1:100 dilutions. Visualization of VEGFR-1 was performed using Vestastain Elite ABC kit (Vector Laboratories). Slides were counter-stained by haematoxylin and analyzed under a light microscope.
p53 ELISA
The procedure for performing the p53 ELISA has been previously described (Filippova and Duerksen-Hughes, 2003). The protein concentration in the cell lysates was measured using the Bio-Rad DC protein assay (Bio-Rad).
Research Highlights.
The small splice isoform of E6, E6*, acts in an anti-oncogenic manner in vivo.
E6* expression reduces tumor formation in both HPV+ (SiHa) and HPV− (C33A) cells.
E6*-mediated tumor inhibition is greater in HPV+ SiHa cells than in HPV− C33A cells.
Acknowledgments
We thank John Hough for help with histochemical techniques and Nadya Fodor and Svetlana Bashkirova for technical support. The Loma Linda VA Medical Center provided laboratory support for the animal experiments. This work was supported in part by NCI grant RO1 CA095461 from the National Institutes of Health.
Footnotes
Conflict of Interest The authors have no competing financial interests in relation to the work described.
Publisher's Disclaimer: This is a PDF file of an unedited manuscript that has been accepted for publication. As a service to our customers we are providing this early version of the manuscript. The manuscript will undergo copyediting, typesetting, and review of the resulting proof before it is published in its final citable form. Please note that during the production process errors may be discovered which could affect the content, and all legal disclaimers that apply to the journal pertain.
References
- Bai L, Wei L, Wang J, Li X, He P. Extended effects of human papillomavirus 16 E6-specific short hairpin RNA on cervical carcinoma cells. Int J Gynecol Cancer. 2006;16(2):718–29. doi: 10.1111/j.1525-1438.2006.00380.x. [DOI] [PubMed] [Google Scholar]
- Berumen J, Ordonez RM, Lazcano E, Salmeron J, Galvan SC, Estrada RA, Yunes E, Garcia-Carranca A, Gonzalez-Lira G, Madrigal-de la Campa A. Asian-American variants of human papillomavirus 16 and risk for cervical cancer: a case-control study. J Natl Cancer Inst. 2001;93(17):1325–30. doi: 10.1093/jnci/93.17.1325. [DOI] [PubMed] [Google Scholar]
- Bodily J, Laimins LA. Persistence of human papillomavirus infection: keys to malignant progression. Trends Microbiol. 2011;19(1):33–9. doi: 10.1016/j.tim.2010.10.002. [DOI] [PMC free article] [PubMed] [Google Scholar]
- Chan DW, Yu SY, Chiu PM, Yao KM, Liu VW, Cheung AN, Ngan HY. Over-expression of FOXM1 transcription factor is associated with cervical cancer progression and pathogenesis. J Pathol. 2008;215(3):245–52. doi: 10.1002/path.2355. [DOI] [PubMed] [Google Scholar]
- Chang JT, Kuo TF, Chen YJ, Chiu CC, Lu YC, Li HF, Shen CR, Cheng AJ. Highly potent and specific siRNAs against E6 or E7 genes of HPV16- or HPV18-infected cervical cancers. Cancer Gene Ther. 2010;17(12):827–36. doi: 10.1038/cgt.2010.38. [DOI] [PMC free article] [PubMed] [Google Scholar]
- Crook T, Wrede D, Vousden KH. p53 point mutation in HPV negative human cervical carcinoma cell lines. Oncogene. 1991;6(5):873–5. [PubMed] [Google Scholar]
- David CJ, Manley JL. Alternative pre-mRNA splicing regulation in cancer: pathways and programs unhinged. Genes Dev. 2010;24(21):2343–64. doi: 10.1101/gad.1973010. [DOI] [PMC free article] [PubMed] [Google Scholar]
- Davy CE, Jackson DJ, Wang Q, Raj K, Masterson PJ, Fenner NF, Southern S, Cuthill S, Millar JB, Doorbar J. Identification of a G(2) arrest domain in the E1 wedge E4 protein of human papillomavirus type 16. J Virol. 2002;76(19):9806–18. doi: 10.1128/JVI.76.19.9806-9818.2002. [DOI] [PMC free article] [PubMed] [Google Scholar]
- De la Cruz-Hernandez E, Garcia-Carranca A, Mohar-Betancourt A, Duenas-Gonzalez A, Contreras-Paredes A, Perez-Cardenas E, Herrera-Goepfert R, Lizano-Soberon M. Differential splicing of E6 within human papillomavirus type 18 variants and functional consequences. J Gen Virol. 2005;86(Pt 9):2459–68. doi: 10.1099/vir.0.80945-0. [DOI] [PubMed] [Google Scholar]
- Delmas AL, Riggs BM, Pardo CE, Dyer LM, Darst RP, Izumchenko EG, Monroe M, Hakam A, Kladde MP, Siegel EM, Brown KD. WIF1 is a frequent target for epigenetic silencing in squamous cell carcinoma of the cervix. Carcinogenesis. 2011;32(11):1625–33. doi: 10.1093/carcin/bgr193. [DOI] [PMC free article] [PubMed] [Google Scholar]
- Doorbar J, Ely S, Sterling J, McLean C, Crawford L. Specific interaction between HPV-16 E1-E4 and cytokeratins results in collapse of the epithelial cell intermediate filament network. Nature. 1991;352(6338):824–7. doi: 10.1038/352824a0. [DOI] [PubMed] [Google Scholar]
- Filippova M, Brown-Bryan TA, Casiano CA, Duerksen-Hughes PJ. The human papillomavirus 16 E6 protein can render cells either sensitive or resistant to TNF: Effect of dose. Cell Death Differ. 2005;12:1622–1635. doi: 10.1038/sj.cdd.4401678. [DOI] [PMC free article] [PubMed] [Google Scholar]
- Filippova M, Duerksen-Hughes PJ. Inorganic and dimethylated arsenic species induce cellular p53. Chem Res Toxicol. 2003;16(3):423–31. doi: 10.1021/tx025606a. [DOI] [PubMed] [Google Scholar]
- Filippova M, Filippov VA, Kagoda M, Garnett T, Fodor N, Duerksen-Hughes PJ. Complexes of human papillomavirus type 16 E6 proteins form pseudo-death-inducing signaling complex structures during tumor necrosis factor-mediated apoptosis. J Virol. 2009;83(1):210–27. doi: 10.1128/JVI.01365-08. [DOI] [PMC free article] [PubMed] [Google Scholar]
- Filippova M, Johnson MM, Bautista M, Filippov V, Fodor N, Tungteakkhun SS, Williams K, Duerksen-Hughes PJ. The large and small isoforms of human papillomavirus type 16 E6 bind to and differentially affect procaspase 8 stability and activity. J Virol. 2007;81(8):4116–29. doi: 10.1128/JVI.01924-06. [DOI] [PMC free article] [PubMed] [Google Scholar]
- Filippova M, Parkhurst L, Duerksen-Hughes PJ. The human papillomavirus 16 E6 protein binds to Fas-associated death domain and protects cells from Fas-triggered apoptosis. J Biol Chem. 2004;279(24):25729–44. doi: 10.1074/jbc.M401172200. [DOI] [PubMed] [Google Scholar]
- Filippova M, Song H, Connolly JL, Dermody TS, Duerksen-Hughes PJ. The human papillomavirus 16 E6 protein binds to tumor necrosis factor (TNF) R1 and protects cells from TNF-induced apoptosis. J Biol Chem. 2002;277(24):21730–9. doi: 10.1074/jbc.M200113200. [DOI] [PubMed] [Google Scholar]
- Ghittoni R, Accardi R, Hasan U, Gheit T, Sylla B, Tommasino M. The biological properties of E6 and E7 oncoproteins from human papillomaviruses. Virus Genes. 2010;40(1):1–13. doi: 10.1007/s11262-009-0412-8. [DOI] [PubMed] [Google Scholar]
- Graham SV. Human papillomavirus: gene expression, regulation and prospects for novel diagnostic methods and antiviral therapies. Future Microbiol. 2010;5(10):1493–506. doi: 10.2217/fmb.10.107. [DOI] [PMC free article] [PubMed] [Google Scholar]
- Guccione E, Pim D, Banks L. HPV-18 E6*I modulates HPV-18 full-length E6 functions in a cell cycle dependent manner. Int J Cancer. 2004;110(6):928–33. doi: 10.1002/ijc.20184. [DOI] [PubMed] [Google Scholar]
- Hafner N, Driesch C, Gajda M, Jansen L, Kirchmayr R, Runnebaum IB, Durst M. Integration of the HPV16 genome does not invariably result in high levels of viral oncogene transcripts. Oncogene. 2008;27(11):1610–7. doi: 10.1038/sj.onc.1210791. [DOI] [PubMed] [Google Scholar]
- Harris AL. Hypoxia--a key regulatory factor in tumour growth. Nat Rev Cancer. 2002;2(1):38–47. doi: 10.1038/nrc704. [DOI] [PubMed] [Google Scholar]
- Hazan RB, Phillips GR, Qiao RF, Norton L, Aaronson SA. Exogenous expression of N-cadherin in breast cancer cells induces cell migration, invasion, and metastasis. J Cell Biol. 2000;148(4):779–90. doi: 10.1083/jcb.148.4.779. [DOI] [PMC free article] [PubMed] [Google Scholar]
- Hazan RB, Qiao R, Keren R, Badano I, Suyama K. Cadherin switch in tumor progression. Ann N Y Acad Sci. 2004;1014:155–63. doi: 10.1196/annals.1294.016. [DOI] [PubMed] [Google Scholar]
- Kwan HT, Chan DW, Cai PC, Mak CS, Yung MM, Leung TH, Wong OG, Cheung AN, Ngan HY. AMPK activators suppress cervical cancer cell growth through inhibition of DVL3 mediated Wnt/beta-catenin signaling activity. PLoS One. 2013;8(1):e53597. doi: 10.1371/journal.pone.0053597. [DOI] [PMC free article] [PubMed] [Google Scholar]
- McLaughlin-Drubin ME, Munger K. Oncogenic activities of human papillomaviruses. Virus Res. 2009;143(2):195–208. doi: 10.1016/j.virusres.2009.06.008. [DOI] [PMC free article] [PubMed] [Google Scholar]
- Mercatante D, Kole R. Modification of alternative splicing pathways as a potential approach to chemotherapy. Pharmacol Ther. 2000;85(3):237–43. doi: 10.1016/s0163-7258(99)00067-4. [DOI] [PubMed] [Google Scholar]
- Moody CA, Laimins LA. Human papillomavirus oncoproteins: pathways to transformation. Nat Rev Cancer. 2010;10(8):550–60. doi: 10.1038/nrc2886. [DOI] [PubMed] [Google Scholar]
- Munger K, Howley PM. Human papillomavirus immortalization and transformation functions. Virus Res. 2002;89(2):213–28. doi: 10.1016/s0168-1702(02)00190-9. [DOI] [PubMed] [Google Scholar]
- Pang E, Delic NC, Hong A, Zhang M, Rose BR, Lyons JG. Radiosensitization of oropharyngeal squamous cell carcinoma cells by human papillomavirus 16 oncoprotein E6 *I. Int J Radiat Oncol Biol Phys. 2011;79(3):860–5. doi: 10.1016/j.ijrobp.2010.06.028. [DOI] [PubMed] [Google Scholar]
- Pim D, Banks L. HPV-18 E6*I protein modulates the E6-directed degradation of p53 by binding to full-length HPV-18 E6. Oncogene. 1999;18(52):7403–8. doi: 10.1038/sj.onc.1203134. [DOI] [PubMed] [Google Scholar]
- Pim D, Banks L. Interaction of viral oncoproteins with cellular target molecules: infection with high-risk vs low-risk human papillomaviruses. APMIS. 2010;118(6-7):471–93. doi: 10.1111/j.1600-0463.2010.02618.x. [DOI] [PubMed] [Google Scholar]
- Pim D, Massimi P, Banks L. Alternatively spliced HPV-18 E6* protein inhibits E6 mediated degradation of p53 and suppresses transformed cell growth. Oncogene. 1997;15(3):257–64. doi: 10.1038/sj.onc.1201202. [DOI] [PubMed] [Google Scholar]
- Pim D, Tomaic V, Banks L. The human papillomavirus (HPV) E6* proteins from high-risk, mucosal HPVs can direct degradation of cellular proteins in the absence of full-length E6 protein. J Virol. 2009;83(19):9863–74. doi: 10.1128/JVI.00539-09. [DOI] [PMC free article] [PubMed] [Google Scholar]
- Rosenberger S, De-Castro Arce J, Langbein L, Steenbergen RD, Rosl F. Alternative splicing of human papillomavirus type-16 E6/E6* early mRNA is coupled to EGF signaling via Erk1/2 activation. Proc Natl Acad Sci U S A. 107(15):7006–11. doi: 10.1073/pnas.1002620107. [DOI] [PMC free article] [PubMed] [Google Scholar]
- Sotlar K, Diemer D, Dethleffs A, Hack Y, Stubner A, Vollmer N, Menton S, Menton M, Dietz K, Wallwiener D, Kandolf R, Bultmann B. Detection and typing of human papillomavirus by e6 nested multiplex PCR. J Clin Microbiol. 2004;42(7):3176–84. doi: 10.1128/JCM.42.7.3176-3184.2004. [DOI] [PMC free article] [PubMed] [Google Scholar]
- Stubenrauch F, Hummel M, Iftner T, Laimins LA. The E8E2C protein, a negative regulator of viral transcription and replication, is required for extrachromosomal maintenance of human papillomavirus type 31 in keratinocytes. J Virol. 2000;74(3):1178–86. doi: 10.1128/jvi.74.3.1178-1186.2000. [DOI] [PMC free article] [PubMed] [Google Scholar]
- Stubenrauch F, Zobel T, Iftner T. The E8 domain confers a novel long-distance transcriptional repression activity on the E8E2C protein of high-risk human papillomavirus type 31. J Virol. 2001;75(9):4139–49. doi: 10.1128/JVI.75.9.4139-4149.2001. [DOI] [PMC free article] [PubMed] [Google Scholar]
- Takeichi M. Cadherins in cancer: implications for invasion and metastasis. Curr Opin Cell Biol. 1993;5(5):806–11. doi: 10.1016/0955-0674(93)90029-p. [DOI] [PubMed] [Google Scholar]
- Tang S, Tao M, McCoy JP, Jr., Zheng ZM. The E7 oncoprotein is translated from spliced E6*I transcripts in high-risk human papillomavirus type 16- or type 18-positive cervical cancer cell lines via translation reinitiation. J Virol. 2006;80(9):4249–63. doi: 10.1128/JVI.80.9.4249-4263.2006. [DOI] [PMC free article] [PubMed] [Google Scholar]
- Tungteakkhun SS, Filippova M, Fodor N, Duerksen-Hughes PJ. The Full Length Isoform of HPV 16 E6 and its Splice Variant E6* Bind to Different Sites on Procaspase 8 DED. J Virol. 2009 doi: 10.1128/JVI.01331-09. [DOI] [PMC free article] [PubMed] [Google Scholar]
- Tungteakkhun SS, Filippova M, Fodor N, Duerksen-Hughes PJ. The Full Length Isoform of HPV 16 E6 and its Splice Variant E6* Bind to Different Sites on Procaspase 8 DED. J Virol. 2010;84(3):1453–63. doi: 10.1128/JVI.01331-09. [DOI] [PMC free article] [PubMed] [Google Scholar]
- Zheng ZM. Viral oncogenes, noncoding RNAs, and RNA splicing in human tumor viruses. Int J Biol Sci. 2010;6(7):730–55. doi: 10.7150/ijbs.6.730. [DOI] [PMC free article] [PubMed] [Google Scholar]
- Zheng ZM, Baker CC. Papillomavirus genome structure, expression, and post-transcriptional regulation. Front Biosci. 2006;11:2286–302. doi: 10.2741/1971. [DOI] [PMC free article] [PubMed] [Google Scholar]
- Zheng ZM, Tao M, Yamanegi K, Bodaghi S, Xiao W. Splicing of a cap-proximal human Papillomavirus 16 E6E7 intron promotes E7 expression, but can be restrained by distance of the intron from its RNA 5′ cap. J Mol Biol. 2004;337(5):1091–108. doi: 10.1016/j.jmb.2004.02.023. [DOI] [PubMed] [Google Scholar]