

Abstract
Objective
Electronic health records (EHRs) contain information to detect adverse drug reactions (ADRs), as they contain comprehensive clinical information. A major challenge of using comprehensive information involves confounding. We propose a novel data-driven method to identify ADR signals accurately by adjusting for confounders.
Materials and methods
We focused on two serious ADRs, rhabdomyolysis and pancreatitis, and used information in 264 155 unique patient records. We identified an ADR using established criteria, selected potential confounders, and then used penalized logistic regressions to estimate confounder-adjusted ADR associations. A reference standard was created to evaluate and compare the precision of the proposed method and four others.
Results
Precision was 83.3% for rhabdomyolysis and 60.8% for pancreatitis when using the proposed method, and we identified several drug safety signals that are interesting for further clinical review.
Discussion
The proposed method effectively estimated ADR associations after adjusting for confounders. A main cause of error was probably due to the nature of the dataset in that a substantial number of patients had a single visit only and, therefore, it was not possible to determine correctly the appropriate sequence of events for them. It is likely that performance will be improved with use of EHR data that contain more longitudinal records.
Conclusions
This data-driven method is effective in controlling for confounding, resulting in either a higher or similar precision when compared with four comparators, has the unique ability to provide insight into confounders for each specific medication–ADR pair, and can be easily adapted to other EHR systems.
Introduction
Adverse drug reactions (ADRs) cause high morbidity and mortality rates, and cost several billion dollars yearly.1 2 Traditionally, clinical trials and spontaneous reporting systems were the main resources for detecting ADR in post-marketing stages.3 4 Due to their inherent limitations, including reporting biases, underreporting, incomplete information and indeterminate population exposure,5 the use of health claims and electronic health records (EHRs) has recently been explored.6–13
EHRs contain comprehensive patient information collected during routine practice.14 Unlike spontaneous reporting systems, they are not subjective regarding ADRs. However, EHRs introduce other challenges. First, most of the information is buried in narrative clinical notes, and is inaccessible for automated applications. This can be addressed by using natural language processing (NLP) systems, which encode narrative clinical notes.15–17 Second, the vast amount of clinical narrative information in the EHR exacerbates the problem of confounding by introducing many conditions. Third, records usually mention the patient's medications, symptoms, diseases, and procedures individually without mentioning their relationships. Therefore, statistical methods are needed to obtain associations, which do not denote relationships. For example, a statistical association between a medication and a condition may be a treatment, an ADR, or an indirect association stemming from another event (eg, a confounder).18 19 As ADRs occur rarely, most associations are due to confounding. For instance, when certain serious ADRs were identified using abnormal laboratory signals (ALS), 70% were not drug related, but corresponded to spurious associations between drugs and the adverse events.20 ADR signals detected in the EHR are likely to be confounded by co-medication, by indication, by comorbidity, or any combination of the three. Confounding by co-medication occurs when two or more medications are frequently prescribed together, but only one causes the ADR of interest. For example, Rosinex causes nausea, but because Rosinex and Ganclex are frequently prescribed together, a spurious association between Ganclex and nausea may also occur.5 Confounding by indication occurs when medications are prescribed to treat symptoms or manifestations of an ADR before the ADR is diagnosed. For example, the medication fentanyl may be prescribed for patients who have severe pain before the diagnosis of the condition responsible for the pain. Confounding by comorbidity occurs when an ADR is associated with the disease that the medication is used to treat. For example, Naltrexone may be associated with pancreatitis because it treats alcoholism, which often leads to pancreatitis. In this study, we focus on eliminating confounding by comorbidity.
To ascertain a causal relationship between a drug and an ADR, confounders need to be identified and removed from the observed marginal associations. This is critical for observational studies, in which the data are collected without randomization or strict inclusion/exclusion criteria.21 22 A study conducted by Harpaz et al3 selected potential confounders that were highly associated with the outcome ADR and then determined whether an association between a medication and an ADR existed based on changes in association strengths with and without the confounders.6 These identified confounders are actually more similar to risk factors (RF) for an ADR (hereafter the method of Harpaz et al3 is referred to as RF). The propensity score method (PSM) also controls for confounding, and has been applied to health claims databases for drug effectiveness, comparative studies,21 23 24 and ADR detection.25–27 The PSM estimates each patient's probability of the exposure of medication, which it uses as a surrogate to mitigate confounding. The RF method identifies the confounders only by their associations with the ADR, while the PSM selects confounders based only on their associations with the medication. The algorithm we propose takes both types of associations into account, which helps avoid detecting inappropriate confounders. We apply our method to two serious ADR, rhabdomyolysis and pancreatitis, to study performance, but it can be used to detect other ADRs.
Methods
Study setting
The study was conducted at Columbia University Medical Center/New York Presbyterian Hospital (CUMC/NYPH), after institutional review board approval. EHR data consisted of retrospective narrative outpatient visits, admission notes, discharge summaries, and structured medication orders and laboratory results from 2004 to 2010. Narrative reports and structured medication orders were used to obtain the patients’ medical conditions and medications, and laboratory data were used to detect ADR occurrences.
Methodological framework
Figure 1 is an overview of the methodology, which consists of five steps: (1) collecting the appropriate EHRs and performing NLP of the narrative notes to obtain structured coded data; (2) creating each ADR case group, generating the 2×2 contingency tables, and identifying initial candidate drug safety signals; (3) identifying potential confounders; (4) estimating medication–ADR associations while adjusting for confounders; and (5) determining medication–ADR signals.
Figure 1.

Methodological framework.
Step 1 data collection and preparation
An NLP system, MedLEE, was used to structure and encode the narrative notes.28 MedLEE identified medical concepts, such as medications, diseases and symptoms, and mapped the concepts to the unified medical language system (UMLS) concept identifiers to standardize them.29 MedLEE also identified modifiers of the medical concepts, such as time and negation. By using them, events that were not experienced by the patient or that occurred in the past were excluded.30 For example, chest pain in the sentence ‘The patient had three admissions in the past for chest pain’, was excluded as a current problem. Medication names were normalized to their generic names. For example, the trade name Lipitor (UMLS identifier C0593906) was normalized to the generic atorvastatin (UMLS identifier C0286651). Finally, we captured temporal information corresponding to dates of the laboratory tests, dates of admission and discharge for inpatients, and dates of office visit for outpatients.
Step 2 identify candidate drug safety signals
The two ADR groups were identified based on abnormal laboratory tests. Rhabdomyolysis was based on a serum creatine kinase (CK) ≥1000 U/L, and pancreatitis was based on an amylase ≥300 U/L or lipase ≥120 U/L. The control groups for each ADR consisted of patients in the same population without the particular ADR. We analyzed associations of ADR by considering medications that were mentioned before the ADR occurred as the exposure should always precede the ADR. We utilized two criteria to select medications in the case group: (1) medications mentioned in a clinical note were included if the note was written before the initial date of the ALS, or (2) only medications mentioned in the sections Medications on Admission or Current Medications were included if the note was written during the same admission or office visit corresponding to the date of the first ALS because these sections generally specify medications taken before the ADR. In contrast, all the medications for the control patients were collected. Subsequently, we constructed 2×2 contingency tables for each medication–ADR pair, as shown in supplementary table S1 (available online only).
Using formula (1) we calculated the OR for each contingency table to obtain an initial set of drugs associated with the ADR. An OR greater than 1 indicates that the chance of developing an ADR is higher for those who took the medication than those who did not. We used Fisher's exact test31 to test whether the OR were significantly larger than 1, and ranked the resulting p values from smallest to largest. We selected the top K drugs using a family-wise false discovery rate (FDR)32 controlled at 5%.
 |
1 |
Rx represents the drug of interest.
Step 3 identify confounders for specific medications
Potential confounders included diseases and symptoms of individual patients. We calculated the OR of each condition with the drug (θ1), and with the ADR (θ2), and identified a condition as a confounder for the drug–ADR association if: (i) both θ1>1 and θ2>1, and (ii) ln(θ1×θ2)>0.2. The rationale is that a confounder could falsely amplify the ADR signal if and only if it is positively associated with both the drug and the ADR, and the associations are strong. For example, as shown in figure 2, alcoholism was positively associated with both Naltrexone (θ1=58.8) and pancreatitis (θ2=4.09), and the associations were strong (ln(θ1×θ2)=5.74). Therefore, alcoholism was considered a potential confounder for Naltrexone-pancreatitis.
Figure 2.
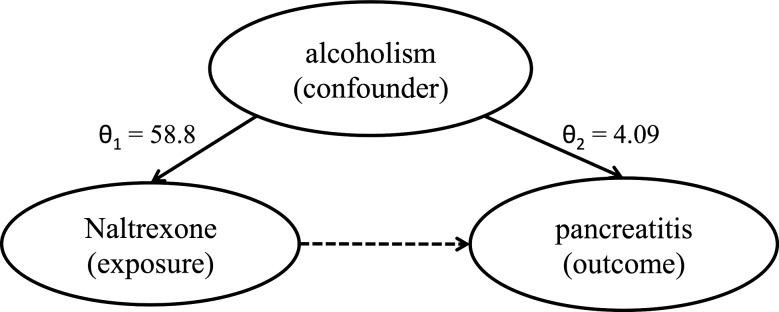
Example of confounding by comorbidity.
Step 4 estimate the medication–ADR associations adjusting for potential confounders
We fit the logistic regression model shown in formula (2) to re-evaluate the drug–ADR association while adjusting for the identified confounders simultaneously.
 |
2 |
Rx represents the medication of interest; β is the effect of the medication associated with the ADR after adjusting for all the Ci; γi is the effect of the ith confounder C concerning the ADR.
In step 3, the potential confounders Ci were identified on an individual basis, and were often correlated with each other. Therefore, some conditions no longer confounded the drug–adverse event association in the presence of other conditions. Including irrelevant items could inflate the estimation variability and undermine the statistical power for detecting ADR associations. To address such over-controlling, we incorporated a least absolute shrinkage and selection operator (LASSO) type regularization into the estimation of the model, which automatically selected the significant Ci.33 34 The LASSO involves a turning parameter λ, which controls the penalty on the model complexity. We selected an optimal λ by 10-fold cross-validation.
To relieve the computational burden, we included the conditions into formula (2) sequentially. In particular, we ranked the Ci by the strength of their association with the ADR (θ2). Instead of including all the Cs at once, we only included the top 500 confounders, and then used LASSO to eliminate the insignificant conditions. We repeated this procedure by iteratively adding the next 500 confounders. The method stopped and the drug–ADR association was rejected if after adding confounders, there was no association between medication and ADR. However, if after adding all confounders, the association still existed, this was considered a possible ADR signal.
Step 5 determine the adjusted medication-ADR signals
For each drug–ADR association, we tested the null hypothesis β=0 using the Wald test.35 If β=0 was accepted, it implied that the observed marginal drug–ADR association was due to the existing confounding conditions; otherwise, the medication was considered to be associated with the ADR even after adjusting for the confounders.
Evaluation
We compared the performance of our method to four other methods using a reference standard, which consisted of drugs implicated in causing rhabdomyolysis and pancreatitis. It was constructed independently by a pharmacological expert using Micromedex,36 literature reviews and published reports, and ADRs listed in the Medi-Span adverse drug effects databases,37 and is described in more detail in another paper.38
Comparisons
Four methods were compared with ours in this study: (1) A baseline method, which only used steps 1 and 2 of the proposed method in which confounding was not considered. (2) A knowledge-based method in which a knowledge base, developed by clinical experts, containing comprehensive non-drug-related RF for rhabdomyolysis and pancreatitis was applied to exclude patients with predisposing causes, which eliminated confounders from the population regardless of medication exposures. The rhabdomyolysis knowledge base was previously established and is in the supplementary data (available online only) of Haerian's publication,7 and the one for pancreatitis is available in supplementary table S2 (available online only). After excluding patients with underlying conditions for developing the ADR, we performed step 2 of the proposed method. (3) the RF method proposed by Harpaz et al38 was utilized in which the shrinkage parameter was selected based on a conjecture that a size of between 20 and 40 conditions was reasonable; however, we used cross-validation to select the shrinkage parameter as this was more reproducible. (4) The PSM proposed by Tatonetti et al27 was replicated, except that for each medication, we only used the top 200 associated conditions, based on their phi coefficients, to generate the propensity score for each patient.
Results
Data collection and cohort characteristics
Data were collected for 264 155 patients accounting for 6221 unique generic drugs and 32 122 unique medical conditions. The characteristics of patients who had rhabdomyolysis and pancreatitis are shown in table 1. There were more men than women, and more African-Americans than other ethnic groups developing rhabdomyolysis, as expected, because baseline CK levels are higher in men than in women, and higher in African-Americans than in other groups.39 There were almost equal numbers of men and women, and no ethnic predisposition for pancreatitis. There is no evidence that ethnicity or age affect the chance of developing pancreatitis.40
Table 1.
Demography of patient population
| Variable | Unique patients | Rhabdomyolysis | Pancreatitis |
|---|---|---|---|
| N | 264 155 | 3670 | 6294 |
| Mean age (±SD) | 50.9 (±23.9) | 57.6 (±21.8) | 57.9 (±22) |
| Sex (male) | 42.5% | 68.2% | 50.3% |
| Race (% of group) | |||
| White | 27.7% | 26.1% | 26.2% |
| Hispanic | 30% | 22.4% | 29.4% |
| Black | 14% | 23.8% | 19.3% |
| Asian | 2% | 2.2% | 2% |
| Other/undocumented | 26.3% | 25.5% | 23.1% |
Reference standard
Table 2 shows statistics and examples of the reference standard.
Table 2.
The statistics and examples of reference standard
| Rhabdomyolysis | Pancreatitis | |
|---|---|---|
| Total no of drugs | 618 | 436 |
| Examples | Acetaminophen, simvastatin, candesartan, iotrolan | Amiodarone, omeprazole, meloxicam, zidovudine |
Statistics of detected drug-safety signals
True positive signals signify that the signals are in the reference, whereas false positive signals signify that those signals are not. Precision is measured as the ratio of true positive signals divided by the sum of true positive and false positive signals. Table 3 shows precision for the five methods. Among them, the proposed method performed significantly better than the other four methods for rhabdomyolysis, with a precision of 83.3%. For pancreatitis, the proposed method demonstrated similar precision compared with the PSM, as depicted by a precision of 60.8% and 66.2%, respectively. The performance of the RF method was comparable to the knowledge-based method, and was worse than the PSM and the proposed methods. The knowledge-based method was significantly better than the baseline method, demonstrating that medical knowledge is effective in identifying confounders, but not as effective as the PSM and proposed models. The number of signals retrieved by each of the five methods is shown in supplementary table S3 (available online only).
Table 3.
The precision of five methods
| Crude marginal association (does not deal with confounders) | Knowledge-based method | RF method (only considers conditions for developing ADR) | Propensity score method (only considers conditions for prescribing medications) | Proposed method (considers conditions both to prescribe medications and develop ADR) | |
|---|---|---|---|---|---|
| Rhabdomyolysis | 38.7% (33.5% to 43.7%) | 58.0% (48.3% to 67.7%) | 50.0% (10.0% to 90.0%) | 72.7% (65.0% to 80.4%) | 83.3% (62.2% to 100%) |
| Pancreatitis | 27.7% (24.3% to 31.1%) | 32.8% (28.5% to 37.2%) | 42.9% (6.2% to 79.5%) | 66.2% (58.4% to 74.0%) | 60.8%* (47.4% to 74.2%) |
The number in the brackets is the CI for the precision (p)  , n is the number of signals retrieved by a method.
*This precision can be improved to 70.5% (57.0%, 83.9%).
ADR, adverse drug reactions; RF, risk factor.
Table 4 lists the true and false positive signals obtained by the proposed method for rhabdomyolysis and pancreatitis. The false positive signals could be classified as due to: (1) co-medication confounding; (2) indication confounding; (3) comorbidity confounding; and (4) possible true signals not in the reference standard.
Table 4.
ADR signals detected by the proposed method and compared with reference standard
| Rhabdomyolysis | Pancreatitis | |
|---|---|---|
| TP | ||
| Gemfibrozil, olanzapine, atorvastatin, aspirin, lorazepam, lisinopril, sulfamethoxazole, zidovudine, sirolimus, labetalol | Aluminum hydroxide, calcitriol, didanosine, furosemide, pentamidine, propofol, sulfamethoxazole, trimethoprim, lisinopril, stavudine, folate, lansoprazole, lamivudine, caspofungin, omeprazole, nelfinavir mesylate, imatinib mesylate, ergocalciferol, famotidine, fluconazole, gemfibrozil, nadolol, prednisone, sodium chloride, ondansetron, pantoprazole, mycophenolate mofetil, levofloxacin, atorvastatin, rabeprazole, esomeprazole | |
| FP | ||
| 1 | Calcium acetate, mycophenolate mofetil | NA |
| 2 | NA | Clonidine, fentanyl, meperidine, metoclopramide, norepinephrine, nystatin, simethicone, vancomycin, sodium acetate, calcium acetate |
| 3 | NA | Insulin, nph insulin, ursodeoxycholate, ursodiol, midazolam, lorazepam |
| 4 | NA | Levodopa, sildenafil citrate, lepirudin, sevelamer carbonate |
ADR, adverse drug reactions; FP, false positive; false positive signals are likely to be due to confounding by (1) co-medication; (2) indication; (3) comorbidity, and (4) possible true signals not in the reference standard; NA, not applicable; TP, true positive.
Discussion
Our results demonstrate that the proposed method is effective for dealing with confounders from EHR reports, and either outperforms or has similar performance as the four other comparators.
Qualitative analysis of results
False positive signals
Only two false positive signals were obtained for rhabdomyolysis probably due to confounding by co-medication. For example, calcium acetate treats patients who have transplants or end-stage renal disease, and consequently are on multiple drug regimens, such as prednisone and tacrolimus, both of which are known to cause rhabdomyolysis. Our method currently does not handle confounding by co-medication, but will address it in future work.
Among the false positive signals for pancreatitis, six were likely to be due to confounding by comorbidity. For example, ursodeoxycholate and ursodiol are used to treat gallstones, common bile duct calculi, and biliary cirrhosis, which are risk factors for pancreatitis. After controlling for these confounders, the association still existed between pancreatitis and those two medications. This could be due to inherent limitations of EHR documentation, NLP errors produced during data preparation, or using incorrect time sequences in patients with only a single visit.
The other 10 false positive signals, such as fentanyl, were likely to be due to confounding by indication. According to our criteria, these drugs should have been excluded as the exposures occurred after the ALS. However, for some cases the first measurement for amylase/lipase occurred after the drugs were ordered, which mainly happened because treatment for pancreatitis was started based on early symptoms before the ALS was obtained, or because of the data characteristics, which is explained below. Such false positives are categorized in supplementary table S4 (available online only).
Sevelamer carbonate, lepirudin, sildenafil citrate and levodopa are four candidates for which physicians could not find confounding or other reasons to relate with pancreatitis. Further investigation of these drugs will be performed in future work.
In this study, we compared results to a reference standard but did not look at individual cases to see what the actual causes of the ADR were for the individual patients, therefore some true positive signals may be false when applied to patients.
False negative signals
False negative signals signify that the signals were not detected by the method but are in the reference standard. There were two reasons for false negative signals: insufficient data and over-adjusting.
Having a large enough set of patients is critical for detecting ADRs, especially rare cases.41 For example, in order to detect chloroquine-induced rhabdomyolysis (incidence rate between 3% and 5%), at least 100 patients must take this medication.42 However, in our dataset, only 37 patients were on chloroquine. An insufficient number of patients for certain medications seemed to be the primary reason for false negatives.
False negative signals also occurred due to over-adjusting, in which the proposed method selected more confounders than it should have. For example, amlodipine, which causes pancreatitis between 1% and 4% of the time,37 was prescribed to 28 832 unique patients in our data, but the proposed method did not detect this because it adjusted for several superfluous confounders such as cytomegalovirus infection. In the future we will explore considering conditions based on smaller p values to address this problem.
The characteristic of the dataset and the inherent nature of the two ADRs
The results showed that the proposed method obtained better precision for rhabdomyolysis than for pancreatitis, which is due both to the characteristic of the data and to the nature of the ADR. Approximately 42% of the dataset we used consists of patients with only a single visit. In such a case, when the ALS is reported, the corresponding clinical note frequently mentions the ADR, which is a diagnosis based on the ALS. In that sense the ALS and ADR are synonymous, and the ADR is not a confounding condition. For example, a patient with an elevated CK test is likely to have rhabdomyolysis mentioned in their note. Therefore, we eliminated the use of the conditions rhabdomyolysis and pancreatitis, respectively, when they occurred in the note associated with the same hospitalization as the ALS. The strategy worked well for rhabdomyolysis but not for pancreatitis because rhabdomyolysis is mainly an acute event. In contrast, pancreatitis could also be chronic, and chronic pancreatitis may lead to an ALS, or a predisposition for acute episodes. Therefore, removing mentions of pancreatitis reduced our method's ability to detect it as a confounder, leading to a reduction in precision for detecting the ADR pancreatitis. We subsequently explored the false positive medication signals by allowing pancreatitis to be a confounder if it met the criteria of confounding for category 2 and 3 of table 4, and eight false positive signals were removed that are displayed in supplementary table S5 (available online only), improving the precision of the proposed method from 60.8% to 70.5% (57.0%, 83.9%). Although we were aware of the problem caused by single visits, we included them in the dataset because it was critical to obtain as many medication events as possible. Another difference between the two ADRs is that confounding by indication does not occur for rhabdomyolysis because medications are not used to treat it, but confounding by indication must be handled for pancreatitis because medications are used to treat it.
Comparison of methods
Apart from performance, the proposed method has the advantage of generalizability over the knowledge-based method. Generalizability is important because different facilities may have different populations. For example, Ramirez et al20 identified burn as a major cause of rhabdomyolysis in their population; in contrast, Haerian et al7 found that myocardial infarction (MI) was a major cause of elevated CK (the laboratory test for rhabdomyolysis) in their population. Developing knowledge specific to each population requires expertise of the ADR and manual review of patient charts to select risk factors, which is costly. In comparison, the proposed method automatically identifies and adjusts for confounders. In addition, the proposed method determines confounders in a data-driven fashion, which allows for finding proxy variables for the confounders, whereas the confounders must be predetermined when using knowledge. For example, in the association between aspirin and rhabdomyolysis, our method correctly identified ST-elevation MI as a confounder (MI also causes elevated CK), and also identified chest pain and increased sweating as confounders, which are common symptoms of MI. Our method was capable of adjusting for the confounding effect of MI using these proxy variables. Similarly, our method listed agitation and confusion as confounders of the association between lorazepam, which is used to treat cocaine abuse, and rhabdomyolysis. Cocaine abusers usually present with agitation and confusion, and are also associated with elevated CK.43
The proposed method has two advantages over the PSM. First, it has the power to detect drug safety signals when it mixes with the effect of comorbidity on the ADR outcome. For example, sevelamer is prescribed to patients on dialysis, which predisposes them to pancreatitis. The PSM eliminates the effect of sevelamer on pancreatitis due to the effect of a variety of kidney problems, while the proposed method adjusts for the appropriate confounders including kidney failure, but retains the effect of sevelamer on pancreatitis. Another advantage is the informative clinical knowledge displayed by the confounders identified by the model. For each medication–ADR pair, the proposed method generates a set of confounders, which describes the effect or non-effect of a medication when taking several conditions into account. These conditions provide informative clinical knowledge useful for further analysis of data. For example, chronic pancreatitis should have been a qualified confounder, but was missing from the pancreatitis model, as explained above. Therefore, we could re-analyze by including pancreatitis in the model. In contrast, the PSM is a black box and is not capable of providing insight concerning confounders.
Use of EHR narratives
There are several advantages to using EHR narratives for detecting ADR signals. It is possible to obtain more comprehensive and finer grained medical information than the International Classification of Disease, V.9 (ICD-9) codes assigned for billing purposes.10 44 Based on our data, patients had approximately 46 medical conditions on average per year based on their notes, while they only had about nine ICD-9 codes on average per year. Moreover, not every condition has an ICD-9 code, such as cardiac valve fibrosis.
Limitations
One limitation of this study concerns time intervals relevant to ADR detection. Currently, the method retrieved all medications before an ADR without considering time windows. For instance, a patient who took a drug in 2004 may have discontinued it in the same year, and may have developed an ADR in 2010. Our method counted this patient in the case group but that time interval may be inappropriate. However, note that one general time window cannot be used for detecting all ADRs, as previous studies have shown that the window between first drug exposure and the incidence of drug-induced pancreatitis can range between one and 1000 days depending on the drug.45
Second, our method did not deal well with other confounding issues, such as protopathic bias, particularly when patients had only a single visit. We plan on collaborating with researchers at other facilities to collect more longitudinal EHR data, which will allow us to obtain more accurate time information.
Third, we used abnormal laboratory results as surrogates for determining rhabdomyolysis and pancreatitis, which is common in pharmacovigilance, but an abnormal CK could be due to strenuous exercise and not to rhabdomyolysis, and an increased amylase could be due to an inflamed parotid gland, and not to pancreatitis.
Conclusion
We proposed a novel data-driven method to control for the problem of confounding when using comprehensive EHR data, and demonstrated that the method achieved either a higher or similar precision in detecting signals for two serious ADRs, rhabdomyolysis and pancreatitis, when compared to four other methods while providing insight into confounders for each specific medication–ADR pair. This method is likely to perform better with a larger patient population with more longitudinal data, can be generalized to detect other ADRs while taking into account either an acute or chronic status, and can be easily adapted to other EHR systems.
Supplementary Material
Acknowledgments
The authors would like to thank Dr Nigam H Shah for his assistance in compiling the reference standard, Dr Krystl Haerian for providing the knowledge base concerning risk factors for rhabdomyolysis, Lyudmila Ena for the assistance of the MedLEE system and EHR database, and Dr Nicholas Tatonetti for the discussion of the propensity score method.
Footnotes
Contributors: YL, CF and YW wrote and revised the manuscript, designed research, performed research, analyzed data, and contributed new reagents/analytical tools. HS wrote and revised the manuscript, and analyzed data. SV and HC analyzed data. CF and YW contributed equally.
Funding: This work was supported by the National Library of Medicine grants R01:LM010016, R01:LM010016-0S1, R01:LM010016-0S2, R01:LM008635 and R01:LM06910 and 5T15-LM007079 (HS).
Competing interests: CF is a consultant for a company that licenses MedLEE.
Ethics approval: Institutional Review Board of Columbia University.
Provenance and peer review: Not commissioned; externally peer reviewed.
References
- 1.Bates DW, Spell N, Cullen DJ, et al. The costs of adverse drug events in hospitalized patients. JAMA 1997;277:307–11 [PubMed] [Google Scholar]
- 2.Bates DW, Cullen DJ, Laird N, et al. Incidence of adverse drug events and potential adverse drug events. JAMA 1995;274:29–34 [PubMed] [Google Scholar]
- 3.Harpaz R, DuMouchel W, Shah N, et al. Novel data-mining methodologies for adverse drug event discovery and analysis. Clin Pharmacol Ther 2012;91:1010–21 [DOI] [PMC free article] [PubMed] [Google Scholar]
- 4.Bate A, Evans S. Quantitative signal detection using spontaneous ADR reporting. Pharmacoepidemiol Drug Saf 2009;18:427–36 [DOI] [PubMed] [Google Scholar]
- 5.Hauben M, Madigan D, Gerrits CM, et al. The role of data mining in pharmacovigilance. Expert Opin Drug Saf 2005;4:929–48. [DOI] [PubMed] [Google Scholar]
- 6.Harpaz R, Haerian K, Chase HS, et al. Mining electronic health records for adverse drug effects using regression based methods Proceedings of the 1st ACM International Health Informatics Symposium; 2010:100–7. [Google Scholar]
- 7.Haerian K, Varn D, Vaidya S, et al. Detection of pharmacovigilance-related adverse events using electronic health records and automated methods. Clin Pharmacol Ther 2012;92:228–34. [DOI] [PMC free article] [PubMed] [Google Scholar]
- 8.LePendu P, Iyer SV, Fairon C, et al. Annotation analysis for testing drug safety signals using unstructured clinical notes. J Biomed Semantics 2012;3(Suppl 1):S5. [DOI] [PMC free article] [PubMed] [Google Scholar]
- 9.Coloma PM, Schuemie MJ, Trifirò G, et al. Combining electronic healthcare databases in Europe to allow for large-scale drug safety monitoring: the EU-ADR Project. Pharmacoepidemiol Drug Saf 2011;20:1–11 [DOI] [PubMed] [Google Scholar]
- 10.Ryan PB, Madigan D, Stang PE, et al. Empirical assessment of methods for risk identification in healthcare data: results from the experiments of the Observational Medical Outcomes Partnership. Stat Med 2012;31:4401–15 [DOI] [PubMed] [Google Scholar]
- 11.Wang X, Hripcsak G, Markatou M, et al. Active computerized pharmacovigilance using natural language processing, statistics, and electronic health records: a feasibility study. J Am Med Inform Assoc 2009;16:328–37 [DOI] [PMC free article] [PubMed] [Google Scholar]
- 12.Stang PE, Ryan PB, Racoosin JA, et al. Advancing the science for active surveillance: rationale and design for the Observational Medical Outcomes Partnership. Ann Intern Med 2010;153:600. [DOI] [PubMed] [Google Scholar]
- 13.Tatonetti N, Denny J, Murphy S, et al. Detecting drug interactions from adverse-event reports: interaction between paroxetine and pravastatin increases blood glucose levels. Clin Pharmacol Ther 2011;90:133–42 [DOI] [PMC free article] [PubMed] [Google Scholar]
- 14.Cox E, Martin BC, Van Staa T, et al. Good research practices for comparative effectiveness research: approaches to mitigate bias and confounding in the design of nonrandomized studies of treatment effects using secondary data sources: the International Society for Pharmacoeconomics and Outcomes Research Good Research Practices for Retrospective Database Analysis Task Force Report—Part II. Value Health 2009;12:1053–61 [DOI] [PubMed] [Google Scholar]
- 15.Meystre SM, Savova GK, Kipper-Schuler KC, et al. Extracting information from textual documents in the electronic health record: a review of recent research. Yearb Med Inform 2008;35:128–44 [PubMed] [Google Scholar]
- 16.Xu H, Stenner SP, Doan S, et al. MedEx: a medication information extraction system for clinical narratives. J Am Med Inform Assoc 2010;17:19–24 [DOI] [PMC free article] [PubMed] [Google Scholar]
- 17.Savova GK, Masanz JJ, Ogren PV, et al. Mayo clinical Text Analysis and Knowledge Extraction System (cTAKES): architecture, component evaluation and applications. J Am Med Inform Assoc 2010;17:507–13 [DOI] [PMC free article] [PubMed] [Google Scholar]
- 18.Cao H, Hripcsak G, Markatou M. A statistical methodology for analyzing cooccurrence data from a large sample. J Biomed Inform 2007;40:343. [DOI] [PMC free article] [PubMed] [Google Scholar]
- 19.Wang X, Hripcsak G, Friedman C. Characterizing environmental and phenotypic associations using information theory and electronic health records. BMC Bioinform 2009;10(Suppl. 9):S13. [DOI] [PMC free article] [PubMed] [Google Scholar]
- 20.Ramirez E, Carcas A, Borobia A, et al. A pharmacovigilance program from laboratory signals for the detection and reporting of serious adverse drug reactions in hospitalized patients. Clin Pharmacol Ther 2009;87:74–86 [DOI] [PubMed] [Google Scholar]
- 21.Brookhart MA, Stürmer T, Glynn RJ, et al. Confounding control in healthcare database research: challenges and potential approaches. Med Care 2010;48:S114. [DOI] [PMC free article] [PubMed] [Google Scholar]
- 22.Greenland S, Morgenstern H. Confounding in health research. Annu Rev Pub Health 2001;22:189–212 [DOI] [PubMed] [Google Scholar]
- 23.Schneeweiss S, Rassen JA, Glynn RJ, et al. High-dimensional propensity score adjustment in studies of treatment effects using health care claims data. Epidemiology 2009;20:512. [DOI] [PMC free article] [PubMed] [Google Scholar]
- 24.Schneeweiss S, Avorn J. A review of uses of health care utilization databases for epidemiologic research on therapeutics. J Clin Epidemiol 2005;58:323–37 [DOI] [PubMed] [Google Scholar]
- 25.Caster O. Mining the WHO Drug Safety Database Using Lasso Logistic Regression. UUDM Project Report 2007;16 [Google Scholar]
- 26.Caster O, Norén GN, Madigan D, et al. Large-scale regression-based pattern discovery: the example of screening the WHO global drug safety database. Stat Anal Data Mining 2010;3:197–208 [Google Scholar]
- 27.Tatonetti NP, Ye PP, Daneshjou R, et al. Data-driven prediction of drug effects and interactions. Sci Transl Med 2012;4:125–31. [DOI] [PMC free article] [PubMed] [Google Scholar]
- 28.Friedman C, Shagina L, Lussier Y, et al. Automated encoding of clinical documents based on natural language processing. J Am Med Inform Assoc 2004;11:392–402 [DOI] [PMC free article] [PubMed] [Google Scholar]
- 29.Bodenreider O. The unified medical language system (UMLS): integrating biomedical terminology. Nucleic Acids Res 2004;32(Suppl. 1):D267–D70 [DOI] [PMC free article] [PubMed] [Google Scholar]
- 30.Chapman WW, Bridewell W, Hanbury P, et al. A simple algorithm for identifying negated findings and diseases in discharge summaries. J Biomed Inform 2001;34:301–10 [DOI] [PubMed] [Google Scholar]
- 31.Upton GJG. Fisher's exact test. J R Stat Soc A 1992;155:395–402 [Google Scholar]
- 32.Benjamini Y, Hochberg Y. Controlling the false discovery rate: a practical and powerful approach to multiple testing. J R Stat Soc B 1995;57:289–300 [Google Scholar]
- 33.Zou H, Hastie T. Regularization and variable selection via the elastic net. J R Stat Soc B 2005;67:301–20 [Google Scholar]
- 34.Tibshirani R. Regression shrinkage and selection via the lasso. J R Stat Soc B 1996;58:267–88 [Google Scholar]
- 35.Gourieroux C, Holly A, Monfort A. Likelihood ratio test, Wald test, and Kuhn-Tucker test in linear models with inequality constraints on the regression parameters. Econ J Econ Soc 1982;50:63–80 [Google Scholar]
- 36.Micromedex Health Series [Internet Database]. GreenwoodVillage, Colo: Thomson Reuters (Healthcare) Inc; Updated periodically 2010 [Google Scholar]
- 37. Medi-Span (R) (Wolters Kluwer Health, Indianapolis, IN) Drug Indications Database (TM)
- 38.Harpaz R, Vilar S, DuMouchel W, et al. Combing signals from spontaneous reports and electronic health records for detection of adverse drug reactions. J Am Med Inform Assoc 2012;20:413–19. [DOI] [PMC free article] [PubMed] [Google Scholar]
- 39.Neal RC, Ferdinand KC, Yčas J, et al. Relationship of ethnic origin, gender, and age to blood creatine kinase levels. Am J Med 2009;122:73–8 [DOI] [PubMed] [Google Scholar]
- 40.Santhi Swaroop Vege M. Etiology of acute pancreatitis. In: Basow DS. ed. UpToDate, Waltham, MA: UpToDate, 2012 [Google Scholar]
- 41.Makuch RW. Detecting rare adverse events in postmarketing studies: sample size considerations. Drug Inf J 2006;40:89–98 [Google Scholar]
- 42.Tisdale JE, Douglas A. Drug-induced diseases: prevention, detection, and management: American Society of Health-System Pharmacists, Bethesda, MD, 2010 [Google Scholar]
- 43.Warrian WG, Halikas JA, Crosby RD, et al. Observations on increased CPK levels in “asymptomatic” cocaine abusers. J Addict Dis 1992;11:83–95 [DOI] [PubMed] [Google Scholar]
- 44.Trifiro G, Fourrier-Reglat A, Sturkenboom M, et al. The EU-ADR project: preliminary results and perspective. Stud Health Technol Inform 2009;148:43–9 [PubMed] [Google Scholar]
- 45.Badalov N, Baradarian R, Iswara K, et al. Drug-induced acute pancreatitis: an evidence-based review. Clin Gastroenterol Hepatol 2007;5:648–61; e3 [DOI] [PubMed] [Google Scholar]
Associated Data
This section collects any data citations, data availability statements, or supplementary materials included in this article.